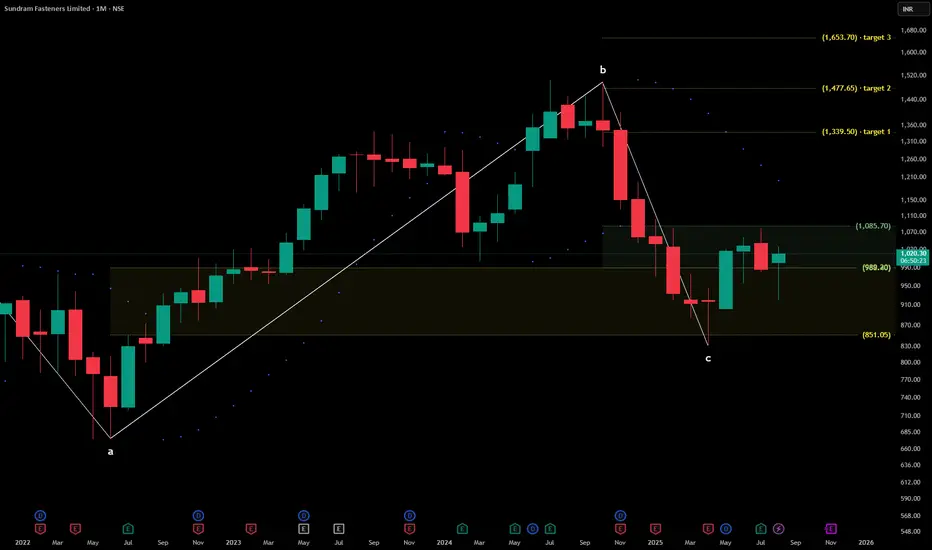
Sundaram Fastners Limited AnalysisPrice Takes liquidity From Discount Zone ,Making HH HL Ready to approach Monthly FVG
Sundram Fasteners Limited
No trades
Next report date
—
Report period
—
EPS estimate
—
Revenue estimate
—
26.35 INR
5.39 B INR
59.41 B INR
95.16 M
About Sundram Fasteners Limited
Sector
Industry
Website
Headquarters
Chennai
Founded
1962
Identifiers
2
ISININE387A01021
Sundram Fasteners Ltd. is engaged in the manufacture and sale of fabricated metal products and motor vehicle parts and accessories. Its products include bolts and nuts, water and petrol pumps, sintered products, cold extruded components, hot and warm forged parts, and radiator caps. It operates through the following segments: Passenger Vehicles, Commercial Vehicles, Three Wheelers, and Two Wheelers. The company was founded on December 10, 1962 and is headquartered in Chennai, India.
Related stocks

SUNDRAM FASTENERSSundram Fasteners Ltd. (currently trading at ₹1020) is a flagship company of the TVS Group and a leading manufacturer of high-tensile fasteners, cold extruded parts, powertrain components, and metal assemblies. With a strong export footprint and Tier-1 OEM relationships, the company serves automotiv
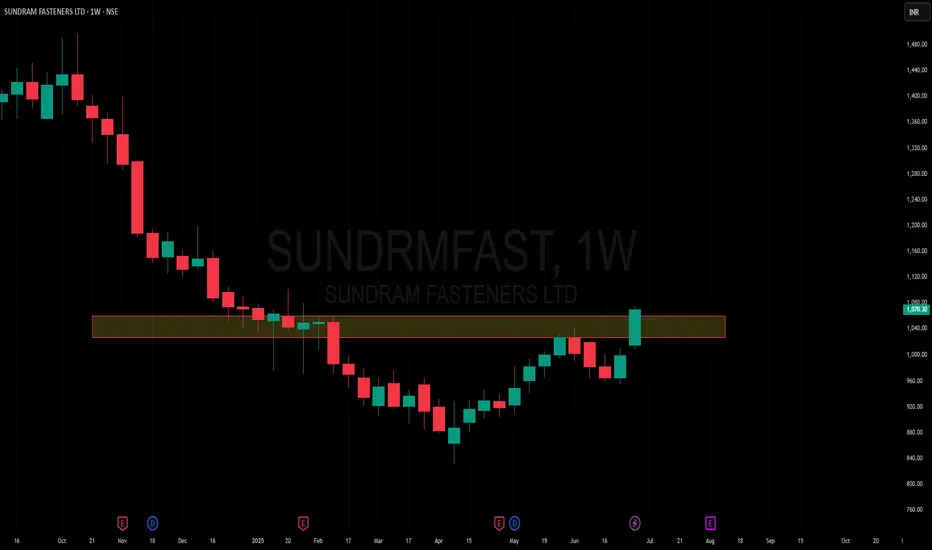
Amazing breakout on WEEKLY Timeframe - SUNDRMFASTCheckout an amazing breakout happened in the stock in Weekly timeframe, macroscopically seen in Daily timeframe. Having a great favor that the stock might be bullish expecting a staggering returns of minimum 25% TGT. IMPORTANT BREAKOUT LEVELS ARE ALWAYS RESPECTED!
NOTE for learners: Place the break
SUNDRNFAST, DAILY Beautiful formation of inverted head & shoulder with price consolidation on the neckline and today we got a breakout, with very small risk with good R:R ratio we can plan a trade.

SUNDRMFAST 1d time frame buy@ 1237 target @ 1270, 1299 ,1316 SUNDRMFAST 1d time frame
buy@ 1237 target @ 1270, 1299 ,1316
ascending channel support
risk reward 2.4
its just a view trade @ your own risk
sl@ 1204.50

SUNDARAM FASTNERS SWING TRADEswing trade take trade when nifty turns bullish swing trade perfect symmetrical triangle short term opportunity for upside take trade after breakout from the trendline according to own risk this is not call just a analysis.

Sundram Fasteners-The stock broke out of a VCP on 5th Jan. It has pulled back and moved in a narrow range for the last 3 days.
-My initial buy was at 982 with 948 as SL.
- Looking to pyramid above 1010 with an SL of 980.
-If one is a medium-term holder, then they can look to trail with 21 EMA as SL.

Sundram Fastners - 14 months consolidation -weekly breakout seenSundram Fastners - Controlled by South India's flagship TVS group - given weekly bo - FII's and DII's holding increased - looks good chartwise, stop loss would be 950.00 around on weekly closing basis , do note.

Sundaram fasteners: breakout candidateSundaram fasteners is a potential candidate for a strong breakout. Keep it on your radar!!

SUNDARAM FASTERNERS BREAKOUT=Volume Spike During Breakout
=HEAD AND SHOULDER BREAKOUT
=RSI TRENDLINE BREAKOUT

See all ideas
Summarizing what the indicators are suggesting.
Neutral
SellBuy
Strong sellStrong buy
Strong sellSellNeutralBuyStrong buy
Neutral
SellBuy
Strong sellStrong buy
Strong sellSellNeutralBuyStrong buy
Neutral
SellBuy
Strong sellStrong buy
Strong sellSellNeutralBuyStrong buy
An aggregate view of professional's ratings.
Neutral
SellBuy
Strong sellStrong buy
Strong sellSellNeutralBuyStrong buy
Neutral
SellBuy
Strong sellStrong buy
Strong sellSellNeutralBuyStrong buy
Neutral
SellBuy
Strong sellStrong buy
Strong sellSellNeutralBuyStrong buy
Displays a symbol's price movements over previous years to identify recurring trends.
MOSMALL250
Motilal Oswal Nifty Smallcap 250 ETF Units Exchange Traded FundWeight
0.52%
Market value
76.06 K
USD
Explore more ETFs
Frequently Asked Questions
The current price of SUNDRMFAST is 939.15 INR — it has increased by 0.16% in the past 24 hours. Watch Sundram Fasteners Limited stock price performance more closely on the chart.
Depending on the exchange, the stock ticker may vary. For instance, on NSE exchange Sundram Fasteners Limited stocks are traded under the ticker SUNDRMFAST.
SUNDRMFAST stock has risen by 0.94% compared to the previous week, the month change is a −0.91% fall, over the last year Sundram Fasteners Limited has showed a −17.91% decrease.
We've gathered analysts' opinions on Sundram Fasteners Limited future price: according to them, SUNDRMFAST price has a max estimate of 1,190.00 INR and a min estimate of 1,040.00 INR. Watch SUNDRMFAST chart and read a more detailed Sundram Fasteners Limited stock forecast: see what analysts think of Sundram Fasteners Limited and suggest that you do with its stocks.
SUNDRMFAST reached its all-time high on Jul 18, 2024 with the price of 1,505.95 INR, and its all-time low was 7.25 INR and was reached on Jul 26, 2001. View more price dynamics on SUNDRMFAST chart.
See other stocks reaching their highest and lowest prices.
See other stocks reaching their highest and lowest prices.
SUNDRMFAST stock is 1.04% volatile and has beta coefficient of 0.81. Track Sundram Fasteners Limited stock price on the chart and check out the list of the most volatile stocks — is Sundram Fasteners Limited there?
Today Sundram Fasteners Limited has the market capitalization of 197.43 B, it has decreased by −0.66% over the last week.
Yes, you can track Sundram Fasteners Limited financials in yearly and quarterly reports right on TradingView.
Sundram Fasteners Limited is going to release the next earnings report on Feb 14, 2026. Keep track of upcoming events with our Earnings Calendar.
SUNDRMFAST net income for the last quarter is 1.51 B INR, while the quarter before that showed 1.48 B INR of net income which accounts for 1.70% change. Track more Sundram Fasteners Limited financial stats to get the full picture.
Sundram Fasteners Limited dividend yield was 0.79% in 2024, and payout ratio reached 28.06%. The year before the numbers were 0.63% and 27.59% correspondingly. See high-dividend stocks and find more opportunities for your portfolio.
As of Dec 17, 2025, the company has 10.54 K employees. See our rating of the largest employees — is Sundram Fasteners Limited on this list?
EBITDA measures a company's operating performance, its growth signifies an improvement in the efficiency of a company. Sundram Fasteners Limited EBITDA is 9.52 B INR, and current EBITDA margin is 15.83%. See more stats in Sundram Fasteners Limited financial statements.
Like other stocks, SUNDRMFAST shares are traded on stock exchanges, e.g. Nasdaq, Nyse, Euronext, and the easiest way to buy them is through an online stock broker. To do this, you need to open an account and follow a broker's procedures, then start trading. You can trade Sundram Fasteners Limited stock right from TradingView charts — choose your broker and connect to your account.
Investing in stocks requires a comprehensive research: you should carefully study all the available data, e.g. company's financials, related news, and its technical analysis. So Sundram Fasteners Limited technincal analysis shows the sell today, and its 1 week rating is sell. Since market conditions are prone to changes, it's worth looking a bit further into the future — according to the 1 month rating Sundram Fasteners Limited stock shows the neutral signal. See more of Sundram Fasteners Limited technicals for a more comprehensive analysis.
If you're still not sure, try looking for inspiration in our curated watchlists.
If you're still not sure, try looking for inspiration in our curated watchlists.