TATVA
My View on the Chart TATVA
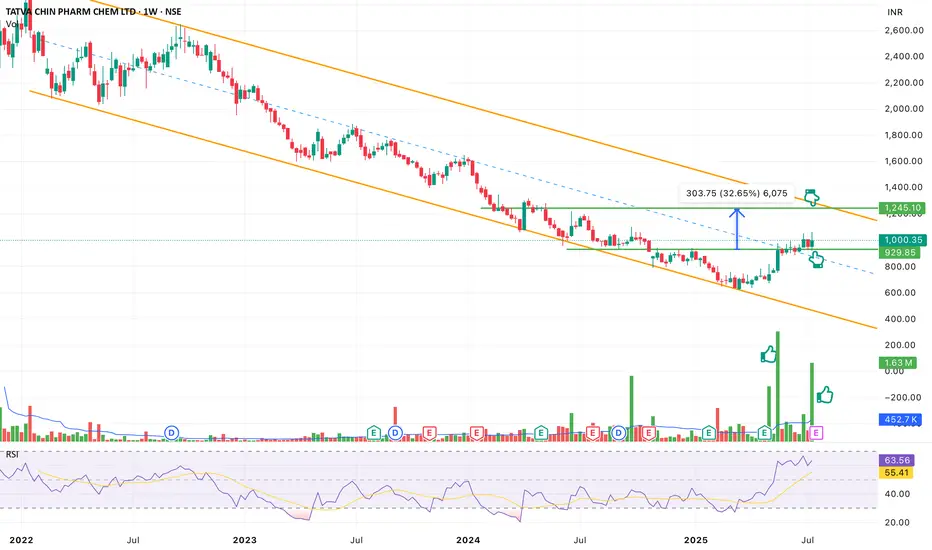
The market reacted from the initial demand zone marked by the first green line.
Risk is managed using the first red line as stop-loss.
If price fails to hold this structure, the lower green line is the next high-probability demand zone, with the corresponding red line acting as stop-loss.
⚠️ Disclaimer:
I am not a SEBI-registered advisor. This post is for educational and informational purposes only and should not be considered as investment advice. Please consult a SEBI-registered financial advisor before making any investment decisions.
Tatva Chintan Pharma Chem Limited
No trades
Market insights

Tatva Chintan Pharma Chem LtdTatva Chintan Pharma Chem Ltd
The company remains a niche player in specialty chemicals, with strong demand in Phase Transfer Catalysts and Electrolyte Salts.
Management is focused on margin improvement and operational efficiency, though working capital optimization is a near-term priority.
at least a 2X in near-term

Tatva Chintan Pharma Chem – Long Base Breakout
After 14 months of accumulation, price breaks out above ₹1,300 with 4× volume! All EMAs aligned bullishly — early stage trend reversal confirmed.
Key supports: ₹1,200 / ₹1,050
Watch for margin recovery + order traction in FY26 for sustained rerating.
#TatvaChintan #Breakout #VolumeSpike #SwingTrading #IndiaStocks #SpecialtyChemicals #EMA #BasePattern #TrendReversal #LongTermInvesting

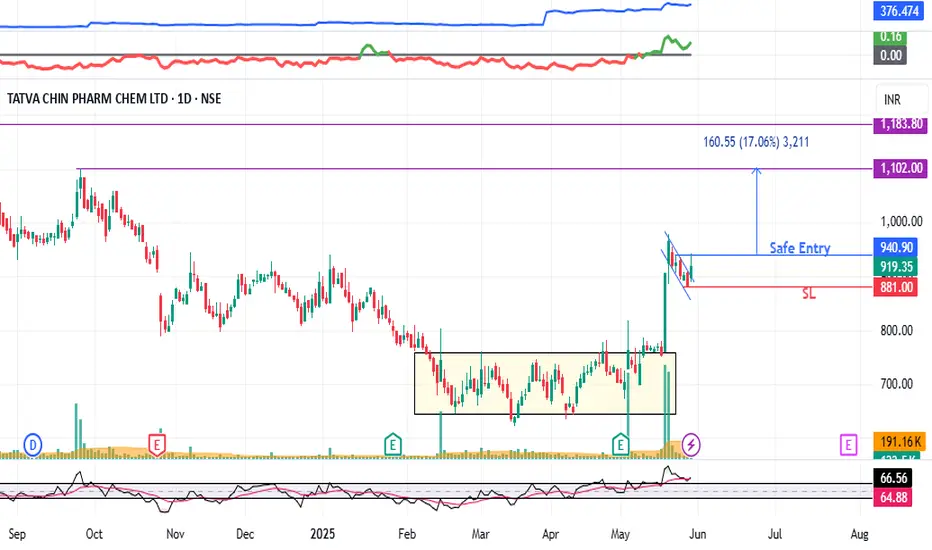
TATVA | Risk-Takers Buy @LTP or Safer Entry @1220TATVA | Risk-Takers Buy @LTP or Safer Entry @1220 | SL below 950 | Target 1840
Disclaimer:
This is not financial advice. Please do your own research or consult with a financial advisor before making any investment decisions. Investments in stocks can be risky and may result in loss of capital.

big volume Stock bottoms often carve out classic volume patterns that let observant traders make fast and accurate calls.
Tatva chintan Buy - 980-1015
Stoploss - 940
Target - 1200 short term
Long term hold for target of 2650

TATVA : Chart Pattern Breakout (Swing Pick)#TATVA #chartpatternbreakout #breakoutstock #flagbreakout
TATVA : Swing Trade
>> Chart Pattern Breakout
>> Flag & Pole Breakout Visible
>> Trending stock
>> Good Strength in stock
>> Volumes Driedup, Expansion imminent
>> Good Upside Potential
Swing Traders can lock profit at 10% and keep trailing
Disc : Stock charts shared are for Learning purpose and not a Trade recommendation.
Do your own analysis or Consult a SEBI Registered Advisior for taking positions
TATVA CHIN PHARM CHEM LTD S/RSupport and Resistance Levels:
Support Levels: These are price points (green line/shade) where a downward trend may be halted due to a concentration of buying interest. Imagine them as a safety net where buyers step in, preventing further decline.
Resistance Levels: Conversely, resistance levels (red line/shade) are where upward trends might stall due to increased selling interest. They act like a ceiling where sellers come in to push prices down.
Breakouts:
Bullish Breakout: When the price moves above resistance, it often indicates strong buying interest and the potential for a continued uptrend. Traders may view this as a signal to buy or hold.
Bearish Breakout: When the price falls below support, it can signal strong selling interest and the potential for a continued downtrend. Traders might see this as a cue to sell or avoid buying.
MA Ribbon (EMA 20, EMA 50, EMA 100, EMA 200) :
Above EMA: If the stock price is above the EMA, it suggests a potential uptrend or bullish momentum.
Below EMA: If the stock price is below the EMA, it indicates a potential downtrend or bearish momentum.
Trendline: A trendline is a straight line drawn on a chart to represent the general direction of a data point set.
Uptrend Line: Drawn by connecting the lows in an upward trend. Indicates that the price is moving higher over time. Acts as a support level, where prices tend to bounce upward.
Downtrend Line: Drawn by connecting the highs in a downward trend. Indicates that the price is moving lower over time. It acts as a resistance level, where prices tend to drop.
Disclaimer:
I am not a SEBI registered. The information provided here is for learning purposes only and should not be interpreted as financial advice. Consider the broader market context and consult with a qualified financial advisor before making investment decisions.

TATVA CHIN Descending Pattern Breakout CMP 913TATVA CHIN PHARM CHEM LTD CMP 913
You can add this stock in short to long term PF
This stock is nearly made bottom and giving a descending pattern breakout. For swing traders
Targets 1102/1317
Long Term Targets:- 1650/1880

Tatva Chin - At SupportTatva Chin :
Falling Wedge pattern spotted
Currently bounced from lower end support
Weak only below 920

TatvaChinta pharma Double bottom on daily chartAfter almost 3 y long correction, Tatva Chinta Pharma Formed double bottom on daily chart & also given breakout above neckline. Target will be arround 1130 with a stoploss of 1010 Rs
I am not Sebi registered analyst.
My studies are for educational purpose only.
Please Consult your financial advisor before trading or investing.

LONGTime nearing for trend change! Positive divergence seen, wait for clear trend change. It may be slow mover as chem sector still facing head wind.

$TATVA CHIN PHARM CHEMlovely chart bled since listing think august 2021
so assuming this does not get delisted the promoter may just wanna start running it back
as long as we hold white line looking for range high for now
got a little will add or reassess in a few weeks

Multiple reasons to buy TatvaNSE:TATVA is ready to break Trend line.
Head & Shoulder confirmed and retested.
Possible targets 1300-1320.
#Tatva

Tatva Chintan Pharma Chart InsightsTatva Chintan Pharma Chem Limited / 26th Nov 2023
The downward trend started from 2977 is likely to see it completion at current levels with support at 1399. The 5 wave Eillot waves are marked on the chart and the 5th wave is likely to have reached its target indicated by demand near 1400 levels that resulted in the formation of an important candlestick a "hammer".
The Fibonacci retracements shows the important levels to look for in coming year.

TATVA Stock Breakdown neckline.
More downside possible tomorrow
Don't entry 🚫 as now
It's a look like falling knife.
Chart setup very Bearish
Macd Bearish signal
Disclaimer This is my personal view for education purpose only.

Positive Divergence On chart- Tatva Chintan PharmaTatva Chintan Pharma Stock Analysis
Noteworthy development: The stock exhibits a Positive Divergence, signaling potential positive momentum.
Strategically poised near the critical support level of 1600, offering an opportunity for astute traders. Emphasize a diligent approach with a well-defined stop loss.

Tatva20/28/2023
Tatva
CMP:1721.30
If closed above 1770
Target:1850-1885-1955
SL:1670
Information is only for study purpose

Strong support Today all sector and index also down but 1600 is that level working as support take risk on yours side no recommendation for buy or sell support level 1600 good 👍


Tatva - Ready for upmove now?WIth double bottom formation after considerable fall seems like tatva is ready to move now. Tgt - 2050

Tatva Chintan Pharma Chem LtdTatva Chintan Pharma Chem Limited was incorporated in 1996 and it is a manufacturer of a diverse portfolio of structure Directing Agents, Phase Transfer Catalysts, electrolyte salts for batteries, and Pharmaceutical and Agrochemical Intermediates and other Speciality chemicals
Accumulate slowly - Even though results are not impressive in Q4 2023.
Elevated PE - Negative
Q4 - Results Negative
Company comments for future :
Future Plans and Strategies:
Expect 20-30% revenue growth in FY24, potential for 40-50% growth if pricing remains the same
Launching new products on commercial scale in FY24
Anticipate rebound in demand for SDAs
Capex of INR16-17 crores expected for new Agro intermediate product, total capex of INR30-35 crores for the year
Operating leverage to increase in FY25 due to new plant operations and continuous flow chemistry
Revenue growth guidance for FY24 is 20-30%
Electrolyte sales expected to have nearly 100% growth in FY24
Flame retardant revenue expected to be INR40-50 crores this year and INR200 crores next year
Tatva Chintan committed to delivering and improving the market for their products going forward.

TATVA CHINTANTatva Chintan operates in the space of niche specialty chemicals and is a globally recognized specialty chemical player with several market-leading products in its portfolio. The co. is the largest and only commercial manufacturer of structure-directing agents for zeolites in India (second globally) and caters to a wide range of industries across the globe.
Still High PE
HOLD
Market Cap
₹ 4,555 Cr.
Current Price
₹ 2,055
High / Low
₹ 2,670 / 1,954
Stock P/E
99.0
Book Value
₹ 219
Dividend Yield
0.10 %
ROCE
25.7 %
ROE
30.0 %
Face Value
₹ 10.0
Promoter holding
79.2 %
EPS last year
₹ 43.2
EPS latest quarter
₹ 5.24
Debt
₹ 140 Cr.
Pledged percentage
0.00 %
Net CF
₹ 58.5 Cr.
Price to Cash Flow
224
Free Cash Flow
₹ -68.7 Cr.
Debt to equity
0.29
Volume
4,109
OPM last year
25.0 %
OPM 5Year
21.5 %
Reserves
₹ 464 Cr.
Price to book value
9.39
Int Coverage
9.76
