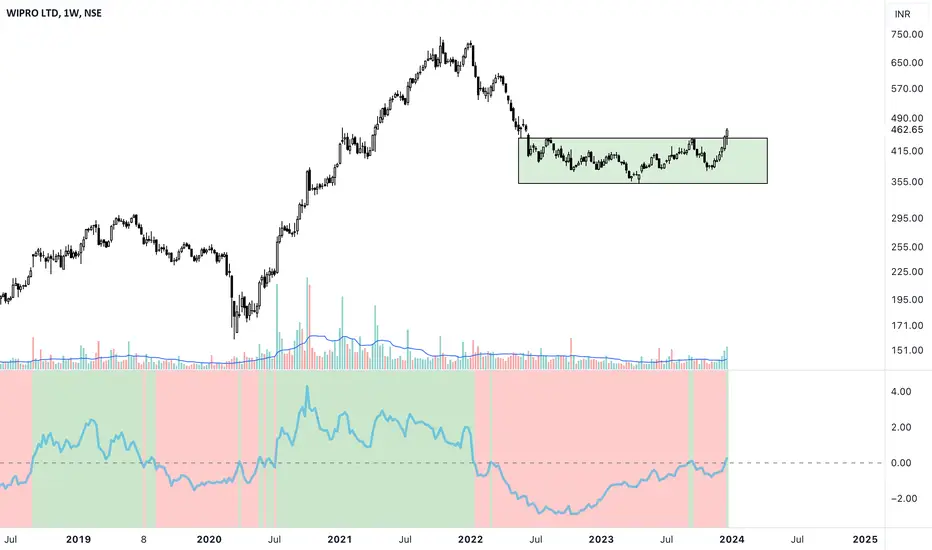
SWING IDEA - WIPRORetesting Current S/R zone @ 455.
Weekly closing above 455 levels should see a good move toward 500-520 in the coming weeks
Market insights

WIPRO - The IT sector pick with Minimal Downside Risk!Overview:
- Entry Point: Current Market Price (CMP) 475
- Target: Around All-Time High (ATH) 740
- Risk-Reward Ratio: With a downside risk of just 10% and aiming for a 50% upside, this trade offers an impressive 1:5 RR ratio.
Aiming for a significant upside with well-managed risk. Let's see if we can capture this opportunity right!
Stay tuned for updates and trade safely! Happy trading!
Disclaimer: This is NOT a buy/sell recomendation. This post is meant for learning purposes only. Please, do you due diligence before investing.
Thanks & Regards,
Anubrata Ray

WIPRO, Cup and HandlePotential breakout from the cup and handle,
Target at 713, Stoploss at 431
Disclaimer : I am a aspiring swing trader, i have only started to learn to catch the pattern. So, please take this only as a idea

WIPRO SHORT `POSITIONHi traders,
Turning our attention to WIPRO , we can observe that the price has been traded inside the upward-sloping channel .On another hand , relative strength index indicates an overbought territory and the price is approaching the resistance line , therefore we believe that the short position can be taken when the price retests this resistance line . The target would be at the up-slopping support . Invalidation of this thesis would be successful close above the up-sloping resistance line.

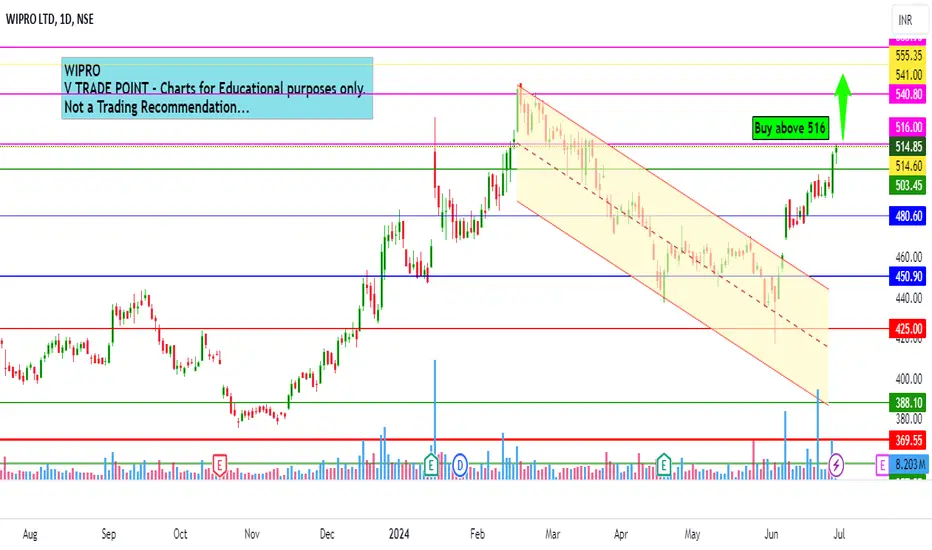
Wipro Intraday level for 15th July #WIPRO
Wipro Intraday level for 15th July #WIPRO
Buying opportunity above 565
Support area 560. Below ignoring buying opportunity
Charts for Educational purposes only.
Please follow strict stop loss and risk reward if you follow the level.
Thanks,
V Trade Point

WIPRO LTD S/R for 15/7/24Support and Resistance Levels: In technical analysis, support and resistance levels are significant price levels where buying or selling interest tends to be strong. They are identified based on previous price levels where the price has shown a tendency to reverse or find support.
Support levels are represented by the green line and green shade, indicating areas where buying interest may emerge to prevent further price decline.
Resistance levels are represented by the red line and red shade, indicating areas where selling pressure may arise to prevent further price increases. Traders often consider these levels as potential buying or selling opportunities.
Breakouts: Breakouts occur when the price convincingly moves above a resistance level (red shade) or below a support level (green shade). A bullish breakout above resistance suggests the potential for further price increases, while a bearish breakout below support suggests the potential for further price declines. Traders pay attention to these breakout signals as they may indicate the start of a new trend or significant price movement.
20 EMA: The yellow line denotes 20 EMA, to interpret the 20 EMA, you need to compare it with the prevailing stock price. If the stock price is below the 20 EMA, it signals a possible downtrend. But if the stock price is above the 20 EMA, it signals a possible uptrend.
Disclosure: I am not SEBI registered. The information provided here is for learning purposes only and should not be interpreted as financial advice. It is important to consult with a qualified financial advisor before making any investment decisions. Tweets neither advice nor endorsement.

WIPRO Cup&HandleThis stock has formed a Bullish structure pattern - Cup & Handle and have given a Neckline breakout, may retest the neckline and head for making targets of CUP & Handle. Even Data is also supporting as i see largest OI at 600 strike, Just a View not a Reco..


Wipro strong breakoutin my opinion now wipro share give strong breakout
for 1st Traget 610
2nd target 713
what you think guys?

WIPROSupport and Resistance Levels: In technical analysis, support and resistance levels are significant price levels where buying or selling interest tends to be strong. They are identified based on previous price levels where the price has shown a tendency to reverse or find support.

Wipro forming CUP & Handle PatternWipro just going to complete Cup & Handle pattern ,Buy above neck line with a stop loss of 501 .As per Fib Retracement ,Target mention on chart .Final target as per Fib Retracement , Cup & handle method will be arround 700

Wipro will be the future PRO in IT Group Wipro has shown huge consolidation in lower levels and now the time has come for the bull run in IT pack


Wipro Ltd Intraday level for 1st July #WIPRO Wipro Ltd Intraday level for 1st July #WIPRO
Buying opportunity above 516
Stop Loss area 509
Charts for Educational purposes only.
Please follow strict stop loss and risk reward if you follow the level.
Thanks,
V Trade Point
3 year WIPRO of pattern.
WIPRO is going now SYMMETRICAL TRIANGLE pattern.
this 3 years of pattern .
AND I think WIPRO breakout in next week.
A. CHEAKING
1.VOIUME
2.LINE BREAKOUT
3.SET ENTRY AND EXIT
MY ACTION ;
I have wipro in 408 price.
If the stock breaks I will buy.

Wipro Intraday level for 28th June #WIPRO Wipro Intraday level for 28th June #WIPRO
Buying opportunity above 514
Stop Loss area 508
Charts for Educational purposes only.
Please follow strict stop loss and risk reward if you follow the level.
Thanks,
V Trade Point

Wipro Breaks Resistance: Bullish Momentum Aims HigherWipro Ltd (NSE: WIPRO) showcases a strong breakout above its recent resistance level, indicating the potential for continued upward momentum. This move is backed by solid trading volume, reinforcing the bullish trend as the stock remains above all major moving averages. Traders should watch for continued support at this breakout level with an eye on targeting the next major resistance.

Wipro on daily charts looks good round bottom breakout.On daily charts looks good round bottom breakout.
We can see 520-530 levels soon.

Wipro swing tradeWipro daily time frame chart it may come to 370 to 380
Disclamer: I am not a sebi Registered, this is not a buy or sell recomendation

Wipro teams with Zscaler to boost AI-driven cybersecurity salesWipro Ltd. ADR has announced a strategic partnership with the IT giant Zscaler, enhancing the reach of its newly launched Wipro Cyber X-Ray platform. This collaboration is expected to bolster Wipro's position in the cybersecurity market, targeting a broader customer base with advanced AI-powered solutions.
The Wipro Cyber X-Ray platform employs artificial intelligence algorithms to enhance data protection tool management. Notably, it features a user-friendly cybersecurity monitoring and management dashboard designed to be intuitive even for non-professionals. The dashboard provides comprehensive insights into current risk levels, vulnerabilities, protection statuses, performance analyses, and potential consequences of cyberattacks, among other critical parameters.
Exploring potential trading opportunities, let's review the technical analysis of Wipro Ltd. ADR (NYSE: WIT):
On the Daily (D1) timeframe, Wipro's stock has established a resistance level at 5.70 USD and support at 5.15 USD. An initial uptrend is observable, suggesting potential for further price increases. If a downtrend initiates, a potential downside target could be 4.10 USD.
If the current uptrend persists and the stock breaks through the resistance at 5.70 USD, a short-term target is 6.45 USD. For a medium-term investment strategy, the stock price might rise to 8.05 USD if the upward momentum continues.
__
Ideas and other content presented on this page should not be considered as guidance for trading or an investment advice. RoboMarkets bears no responsibility for trading results based on trading opinions described in these analytical reviews.
The material presented and the information contained herein is for information purposes only and in no way should be considered as the provision of investment advice for the purposes of Investment Firms Law L. 87(I)/2017 of the Republic of Cyprus or any other form of personal advice or recommendation, which relates to certain types of transactions with certain types of financial instruments.
Risk Warning: CFDs are complex instruments and come with a high risk of losing money rapidly due to leverage. 69.88% of retail investor accounts lose money when trading CFDs with this provider. You should consider whether you understand how CFDs work and whether you can afford to take the high risk of losing your money.

Wipro Limited (WIPRO) AnalysisThe chart provided is of Wipro Limited (WIPRO) listed on the National Stock Exchange (NSE) of India, on a weekly timeframe. Here’s a detailed analysis and summary:
1. Trend Analysis:
- The stock experienced a strong uptrend from mid-2020 to late 2021, reaching a peak around 740.
- Since then, it has been in a downtrend with intermittent periods of consolidation and minor recoveries.
2. Support and Resistance Levels:
- Resistance:
- 543.55 (61.8% Fibonacci retracement level).
- 606.70 (previous high and key resistance).
- 711.90 (1.618 Fibonacci extension level).
- Support:
- 439.85 (Recent low and significant support).
3. Fibonacci Retracement Levels:
- The chart shows Fibonacci retracement levels from the recent high around 740 to the recent low at 439.85.
- 50% level at 523.75.
- 61.8% level at 543.55.
4. Chart Patterns:
- There appears to be a descending triangle pattern forming, with lower highs and a horizontal support level around 440.
- A breakout from this pattern, either upward or downward, will likely indicate the next major move for the stock.
5. Current Price Action:
- The current price is 484.55.
- The price has recently bounced off from near the 440 support level.
- The price is approaching the descending trendline, which could act as resistance in the near term.
6. Moving Averages and Indicators:
- The chart does not explicitly show moving averages or other indicators, but the trend lines, Fibonacci levels, and chart patterns provide key insights.
Summary:
The chart of Wipro Limited (WIPRO) shows that the stock has been in a downtrend since late 2021 after a significant rally. The stock found support around 440 and has recently bounced from this level. Key resistance levels to watch are around 523.75 (50% Fibonacci retracement) and 543.55 (61.8% Fibonacci retracement). The stock is currently testing the descending trendline resistance, and a breakout above this level could indicate a potential reversal. However, if it fails to break this resistance, the stock may continue to trade within the descending triangle pattern, with 440 being a critical support level.

Wipro last 2years IT company performance its worst.. now expecting positive rally .. its only for knowledge sharing only
