WIPRO WEEKLY CANDLE CHART📌WIPRO completed the bearish hormonic pattern and now its breaks the previous resistance after long duration,so will expect good moves in coming days also maintain the Stop loss at 348 at weekly candle closing basis (DYOR)
Market insights

Wipro Weekly Chart Analysis Wipro has given a strong breakout on weekly time frame now if wipro again retest 450 level we will take a long position at 450 level with sl of 50 points and for target of 600 - 620

wipro outlookwipro today huge gap up than going for correction , check for support zones , buy on dips pattern

Wipro Simple Price Action Trend Analysis BullishIn the past NSE:WIPRO was in a Down Trend, thereafter a Descending Channel formed in this chart which is a Bullish Pattern.
Recently price was able to create a HH in this chart which is also a signal for the beginning of a New Uptrend.
And the price is currently reacting from a Trap Zone, this should ideally take the price up.
The First Target is 452 and Second Target would be approx. 523

WIPRO BUYBreakout & retest done
20 DEMA support
Chart setup favour in long trade.
IT sector very well performe
Sentiments are positive.
Disclaimer This is my personal view for education purpose only
No Buy sell recommendations

WIPROWipro is showing strength after long consolidation. After quarterly results Wipro is about to give huge breakout breaking it's long range. Stock may go upto 550-600-650+ levels in short term keeping consolidation base as a sl. It will be interesting to see how much time stock will take to regain its all time high levels.

Wipro's Resilient Performance Signals Industry Rebound
In a recent announcement of financial results for the quarter ending December 31, 2023, Wipro Limited showcased a robust performance, defying industry expectations and setting an optimistic tone for the IT services sector. The company reported several key highlights, indicating not only a resilient business model but also a strategic approach that positions it for future growth.
Exceeding Expectations:
Wipro's revenue from its IT services segment for the quarter reached the top end of its guidance, demonstrating the company's ability to navigate through a seasonally soft period. Despite challenges in the macroeconomic environment, the company reported a 16% operating margin in its IT services business, showcasing efficiency and operational excellence.
Strategic Deal Wins:
A significant contributor to Wipro's success was the $3.8 billion order booking, comprising 14 large deal wins. The strategic partnerships span various industries, showcasing the company's diversified capabilities. Noteworthy among these wins are collaborations with a US-based health insurance non-profit, a global technology leader, an American Retail Bank, and a Middle Eastern financial regulatory body. These deals underscore Wipro's global reach, technological prowess, and its commitment to providing end-to-end solutions.
AI Integration and Innovation:
Wipro's CEO and Managing Director, Thierry Delaporte, highlighted the integration of AI across the company's solutions and client offerings. Under the ai360 strategy, AI is now embedded internally across all business and functional areas, aligning with industry trends and positioning Wipro as a technology leader. This forward-looking approach reflects the company's commitment to capitalizing on emerging opportunities as the macro environment improves.
Consulting Business Growth:
A notable aspect of Wipro's performance was the double-digit growth in order bookings in its Capco business, indicating early signs of a return to growth in consulting services. The company's focus on people, processes, and business operations appears to be paying off, as evidenced by the positive momentum in its consulting business.
Financial Rigor and Resilience:
Aparna C. Iyer, Wipro's Chief Financial Officer, expressed satisfaction with the company's financial metrics, including revenue, margin, EPS, and cash flow. Despite revenue headwinds and investments for growth and people, Wipro sustained its margins at 16%, showcasing financial discipline and resilience.
Industry Insights:
Wipro's performance stands out in the context of the challenging macroeconomic environment faced by the IT services industry, particularly in the United States and Europe. While competitors grapple with sluggish demand and reduced discretionary tech spending, Wipro's results offer a ray of hope and suggest potential stabilization in the industry.
Outlook for Q1 2024:
Looking ahead, Wipro ( NYSE:WIT ) expects its IT services revenue for the quarter ending March 31, 2024, to range between $2.62 billion and $2.67 billion in constant currency terms. This guidance, coupled with the company's track record of exceeding expectations, positions Wipro as a key player to watch in the coming months.
In conclusion, Wipro's recent financial results and strategic wins signal a company on the ascent, weathering challenges with resilience and innovation. As the industry looks for signs of recovery, Wipro's performance provides a compelling case for cautious optimism and a potential turning point for the IT services sector.


WITPotential to buy at 4.70 and sell it above 5.17 - 10% No recommendation, educational purpose only.

Bulls for Wipro?!Like anything in the market timing is everything. Being a sniper with execution is essential and knowing when to enter a trade is important. Here are my thoughts on this trade idea...
Fundamnetals: Highest Daily gainer on Friday with trading volume around 15.245M and usually its at 1.779M
That's a lot of momentum and the next quarter point is the next logical resistance it will meet which is $745.00
Chart Pattern: Bullish Pennant pattern
Indicator: Hidden Bullish Divergence


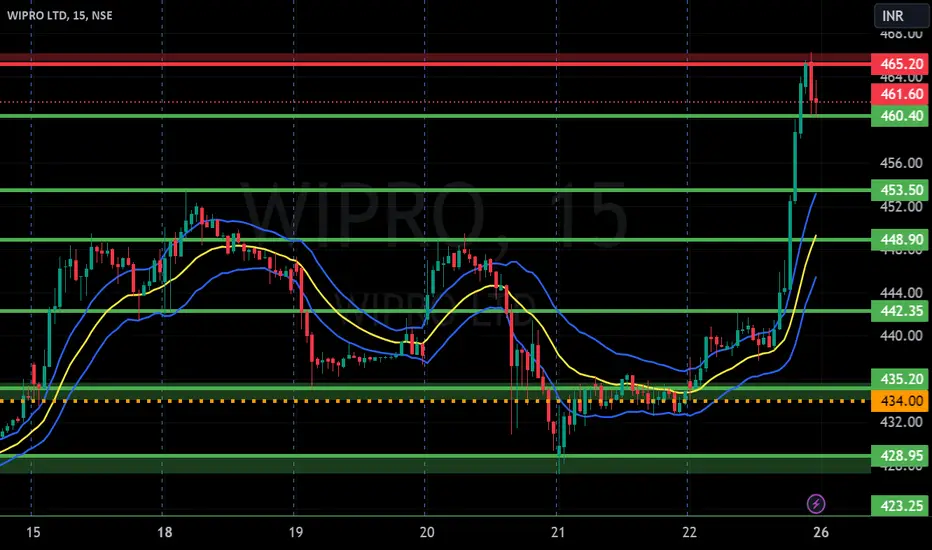
Is this correct? What I've marked.If Wipro breaks 465 and sustains then 527 will be the target. We can accumulate it till 440 and with a stop loss of 425 and a target of 527 is it a good fit and is it correct what I've done.
Or wait for it to retest 465 and then only enter.
Thanks for feedback in advance.
Mukund


Wipro If market does not cross recent high then market fall and tap to order block and continue in upside their is chance to go long because of the market golden ratio known as fib retracement.


Wipro Weekly Timeframe Analysis for long term
NSE:WIPRO has taken strong bounce from golden zone in monthly timeframe.
We can see long term move above 443 & can buy more till 417 with SL 401
Major targets levels are highlighted in blue lines.
Monthly Timeframe View:

WIPRO S/R for 26/12/23Support and Resistance Levels:
Based on the price action, you have to identify two significant levels: the red line acting as resistance and the green line acting as support. Additionally, there have marked red and green shades to represent resistance and support zones, respectively.
Support: The green line and green shade represent support levels. These levels are where the price tends to find buying interest, preventing it from falling further. Traders can consider these levels as potential buying opportunities.
Resistance: The red line and red shade represent resistance levels. These levels are where the price tends to encounter selling pressure, preventing it from rising further. Traders can consider these levels as potential selling opportunities.
Breakouts: If the price breaks above the resistance zone (red shade) convincingly, it may indicate a bullish breakout, and the price could move higher to the next resistance level. On the other hand, if the price breaks below the support zone (green shade) convincingly, it may indicate a bearish breakout, and the price could move lower to the next support level.
Keltner Channel:
The Keltner Channel is a technical indicator that uses an exponential moving average (EMA) to create an upper and lower channel around the price action. Traders can use this channel to identify potential long and short positions.
Long Position: If the price is above the upper line of the Keltner Channel, it may indicate a potential long opportunity, as it suggests the price is trading above the average range and might continue in an upward trend.
Short Position: If the price is below the lower line of the Keltner Channel, it may indicate a potential short opportunity, as it suggests the price is trading below the average range and might continue in a downward trend.
Disclosure: I am not SEBI registered. I just wanted to let you know that the information provided here is for learning purposes only. Please consult your financial advisor before making any decisions. Tweets neither advice nor endorsement.
WIPRO Bullish marubozu candle on chart
Breakout with huge volume
Chart setup favour of long position
Price above Moving averages
MACD & RSI Bullish
Disclaimer This is my personal view for education purpose only
No Buy sell recommendations.

ITPROWipro, is coming off a years of downtrends, it did breakout off a daily cup and handle pattern also looking good on weekly basis, this should rip higher especially since it sector hasnt been performing well, i think the rotation for the next leg higher for the indices would be IT to make index new highs.

Inverted head and shoulders Formed inverted head and shoulders at support and broken with good bullish candle. Good for swing trading. It's only my view not a recommendation.

Techno-Funda Chart of the week. WiproThis chart came to my attention when it gave breakout of the downward channel at 400. Last week, however, it has given a inverted head and shoulders breakout on its weekly chart with very good volumes. Wipro is India's one of best large cap IT and consumer products company with extremally good tract record of financials as well as management. Investors should have these fundamentally strong stocks in their portfolio.
Considering its all time high of 718, this stock is getting at 55% discount and Investor's should not miss this wealth creating opportunity. A new entrant should either keep no stoploss or very deep stoploss for this trade as there are clear indications on the chart of trend reversal.
CMP - 462 (24/12/23)
T - 600

LONG WIPRO We have a Range breakout in #Wipro after making a successful base around 350-380 levels, stock has managed to break the range upwards.Imp Levels marked in Black. Wipro can go towards new highs, Buy on dips until 370-377 Levels held!
R1- 490
R2- 540
R3- 615
S1- 444
S2- 377
S3- 355.
