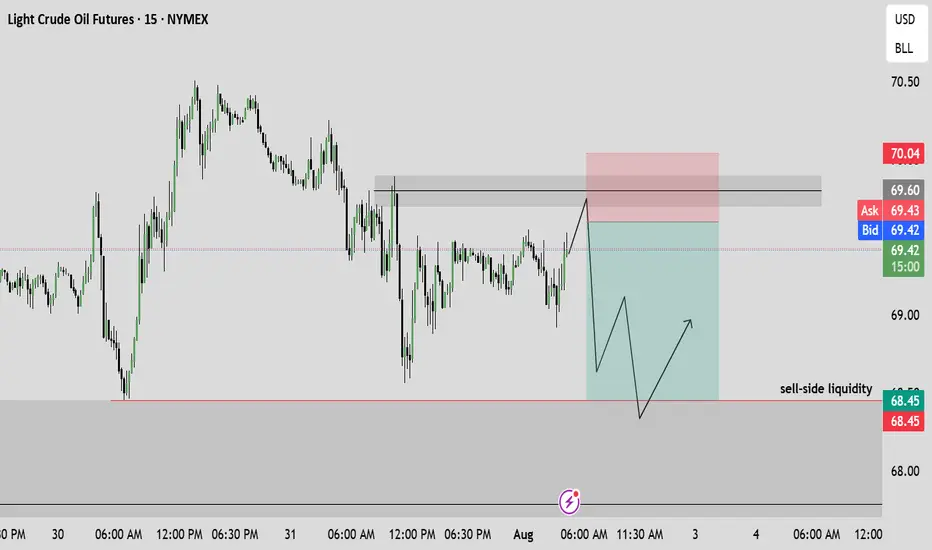
Crude oil: Sell around 70.20, target 65.00-64.00Crude Oil Market Analysis:
Yesterday's crude oil market was very strong, with buying driving the market higher. The daily chart ultimately closed with a clear bullish candlestick. Buying on the daily chart is testing the resistance level between 70.00 and 70.60. After two consecutive days of bullis
About Light Crude Oil Futures
Crude Oil is a naturally occurring liquid fossil fuel resulting from plants and animals buried underground and exposed to extreme heat and pressure. Crude oil is one of the most demanded commodities and prices have significantly increased in recent times. Two major benchmarks for pricing crude oil are the United States' WTI (West Texas Intermediate) and United Kingdom's Brent. The differences between WTI and Brent include not only price but oil type as well, with WTI producing crude oil with a different density and sulfur content. The demand for crude oil is dependent on global economic conditions as well as market speculation. Crude oil prices are commonly measured in USD. Although there have been discussions of replacing the USD with another trade currency for crude oil, no definitive actions have been taken.
Related commodities

S&P gold oil coffee8 5 25 in this video we're looking for some scalping trades the video gives my perception of where the buyers and sellers are and where the opportunity is for both buyers and sellers

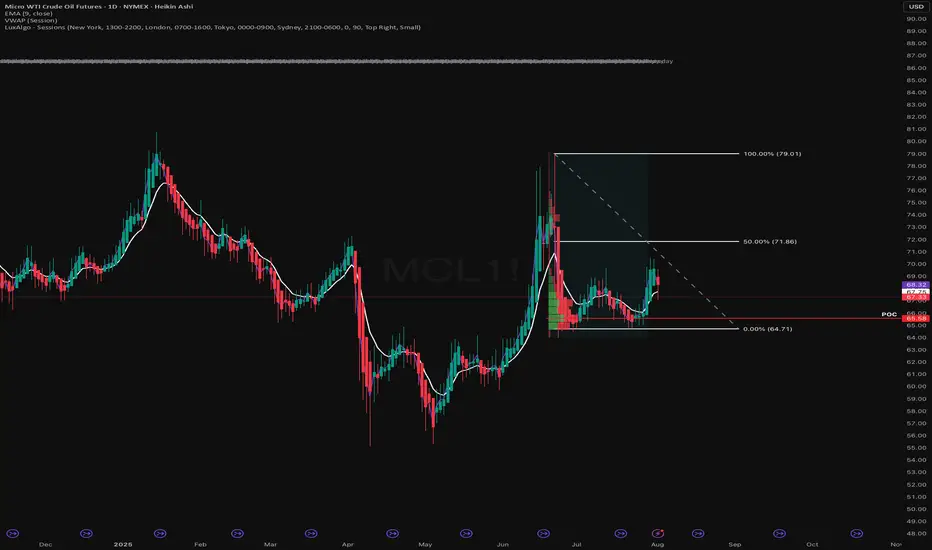
Crude Awakening. This Double Bottom’s Built DifferentCrude oil is sitting at a critical technical level. Zooming out to the daily chart, we’re seeing a textbook double bottom forming at $64.70 a level that’s already been defended twice this summer. Each time price tagged that zone, buyers stepped in with conviction, and last month we saw a strong rall
Oil Market Sentiment Shifts After Trump’s Urgent Warning, but...On June 23, 2025, at 9:35 AM, President Donald J. Trump issued a stark warning via social media:
"EVERYONE, KEEP OIL PRICES DOWN. I’M WATCHING! YOU’RE PLAYING RIGHT INTO THE HANDS OF THE ENEMY. DON’T DO IT!"
Since his post, oil prices experienced a notable bullish impulse. From both fundamental a
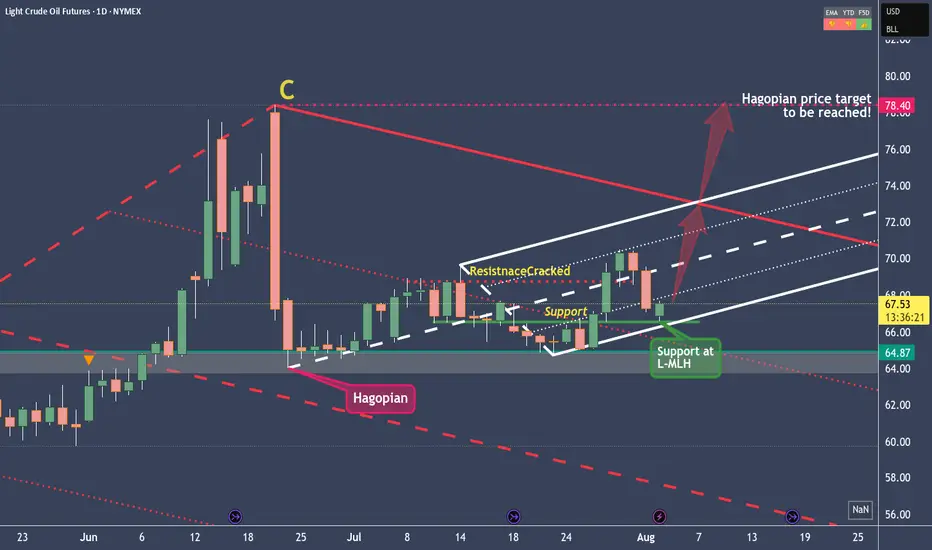
Crude Oil setting up for a Long Trade to $78.40In the long term, Crude Oil is in a short position.
We can see this from the red pendulum fork, which projects the price movement downward.
However, in the short- to medium-term, we're long, as clearly illustrated by the white fork. Supporting the case for higher prices is the Hagopian signal that
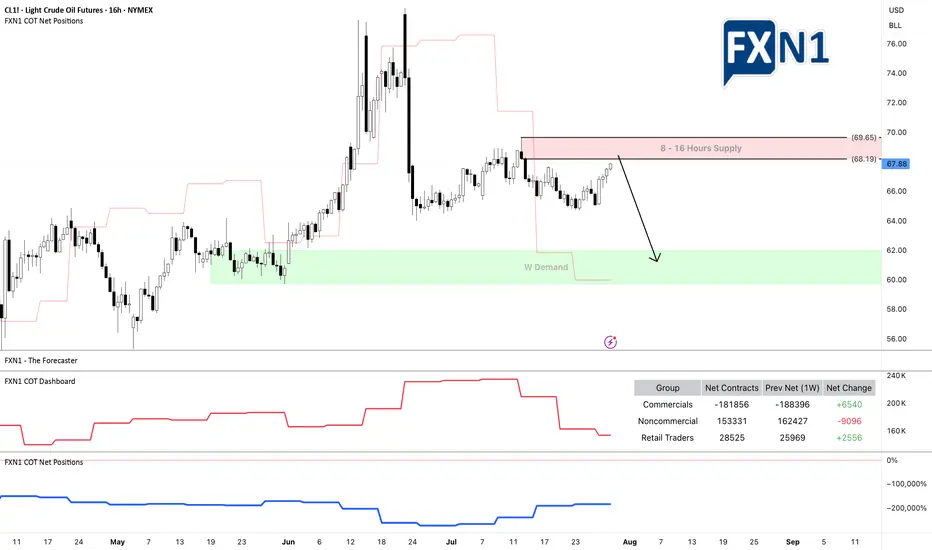
Crude Oil Resumes Its WeaknessCrude oil rised and then fell sharply from above 78 dollars back in June, after tensions in the Middle East. The drop unfolded as an impulse into wave A, so even if this is just a counter-trend move down from 78, it still appears incomplete. After we recently spotted a corrective rally in wave B tha

Crude Oil: Equilibrium, Key Levels & Trade ScenariosNYMEX:CL1! NYMEX:MCL1!
Market Recap
In our prior crude oil commentary, we identified a bullish flag formation with key support anchored at the Q3 micro composite Value Area Low. Following a measured pullback, prices decisively reclaimed the Q3 micro composite Value Area High, subsequently adv

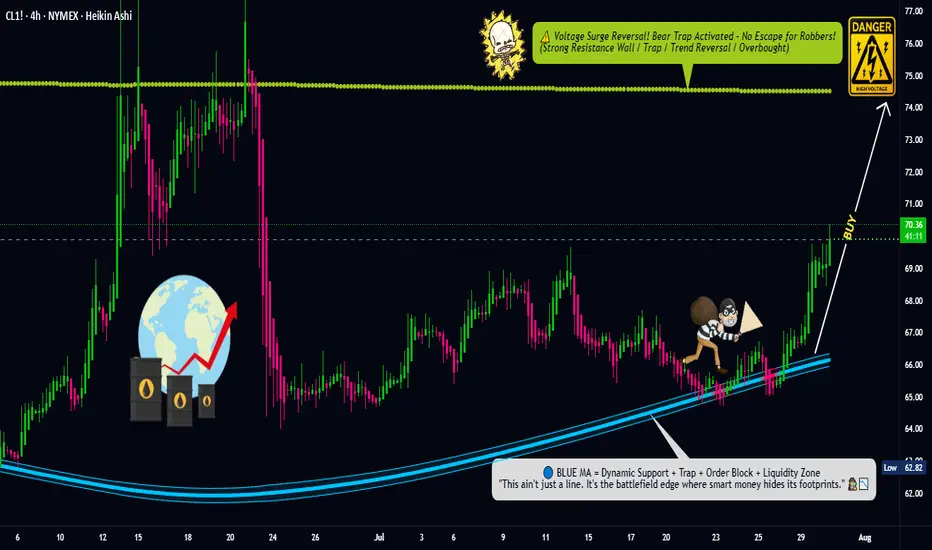
Oil Trap Activated – Limit Orders Set for the Big Score💥🛢️Crude Oil Vault Breach Plan – DCA Heist Begins!🧨💰
🚨Asset: CL1!
📈Bias: BULLISH RAID MODE ON
🎯Target: $74.50
🛡️Stop Loss: $67.50
🔑Entry: ANY LEVEL – Thief stacking limit orders like layers of gold bars 💼⚖️ (DCA Mode Activated)
🕵️♂️Thief Trader is not chasing, we're ambushing 🧠 — scaling in smart
US OILShort term bearish view in US OIL, I want price to drop below the OLD Low before continuing the upside momentum
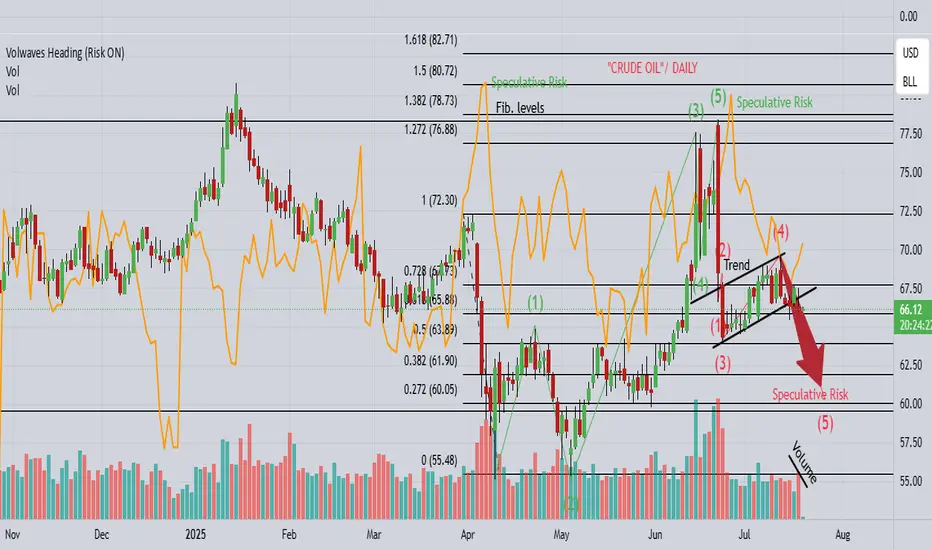
CL "OIL" continues the drop towards $60!1). Wave 5 drop needs a completion lower! 2). Risk is selling off! 3). Volume is falling! 4). Price appears to be heading towards lower market sentiment! 5). Trump is imposing more Tariffs, which is likely causing deeper corrections!
See all ideas
Summarizing what the indicators are suggesting.
Neutral
SellBuy
Strong sellStrong buy
Strong sellSellNeutralBuyStrong buy
Neutral
SellBuy
Strong sellStrong buy
Strong sellSellNeutralBuyStrong buy
Neutral
SellBuy
Strong sellStrong buy
Strong sellSellNeutralBuyStrong buy
A representation of what an asset is worth today and what the market thinks it will be worth in the future.
Displays a symbol's price movements over previous years to identify recurring trends.
Frequently Asked Questions
The current price of Light Crude Oil Futures is 64.33 USD / BLL — it has fallen −1.58% in the past 24 hours. Watch Light Crude Oil Futures price in more detail on the chart.
The volume of Light Crude Oil Futures is 1.83 K. Track more important stats on the Light Crude Oil Futures chart.
Open interest is the number of contracts held by traders in active positions — they're not closed or expired. For Light Crude Oil Futures this number is 318.25 K. You can use it to track a prevailing market trend and adjust your own strategy: declining open interest for Light Crude Oil Futures shows that traders are closing their positions, which means a weakening trend.
Buying or selling futures contracts depends on many factors: season, underlying commodity, your own trading strategy. So mostly it's up to you, but if you look for some certain calculations to take into account, you can study technical analysis for Light Crude Oil Futures. Today its technical rating is sell, but remember that market conditions change all the time, so it's always crucial to do your own research. See more of Light Crude Oil Futures technicals for a more comprehensive analysis.