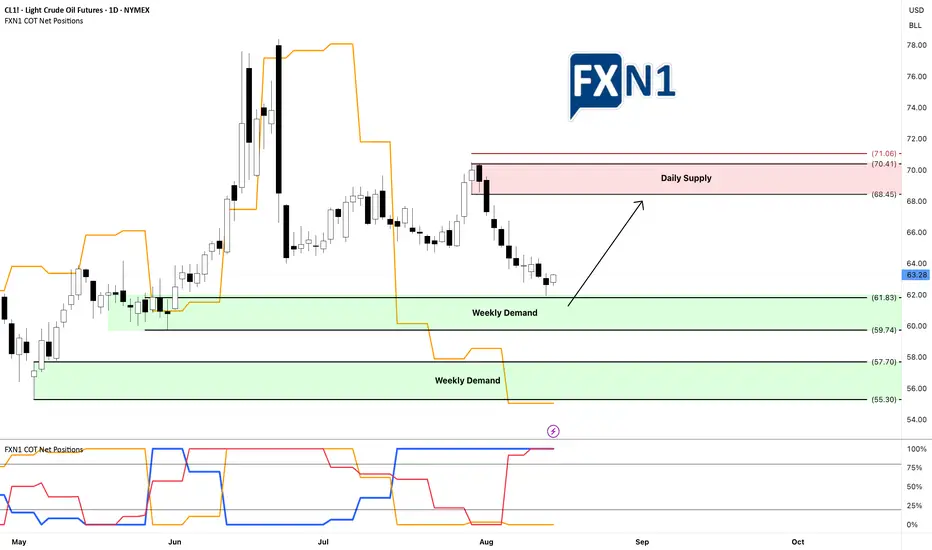
Oil Market Insights: Demand Zones and Future FundamentalsYesterday, CL1! oil tested and rebounded from my weekly demand zone without triggering my entry, resulting in a missed opportunity for several points. This suggests to me that there is buying interest at this level, regardless of the fact that non-commercial traders are short. I am now looking for a retest of this area—if I'm fortunate—to enter a long position. I am also awaiting the new COT data tomorrow to assess any potential shifts in fundamentals. Additionally, I am considering the presence of a stronger demand zone below, which appears even more promising. We'll see how it unfolds.
✅ Please share your thoughts about CL1! in the comments section below and HIT LIKE if you appreciate my analysis. Don't forget to FOLLOW ME; you will help us a lot with this small contribution.
CLN2021 trade ideas
Crude Oil Bearish and Bullish scenarios for the week (UPDATE!!!)Crude Oil can go both directions this week depending on the price we hit in the start of the week.
Patience Patience Patience!!!!
PS: Previous Idea had some wrong measurements. It is fixed now!
This is part two of a monthly reviewThis is the 21st of August.. It's important to go back and look at a previous video since I'm trying to make decisions as to the direction of the market and this will give you a chance to see whether or not price action and patterns can find you good trade location which includes small stops and reasonable Rewards.

A return to solid sellers in a downtrend paves the way for =SELL
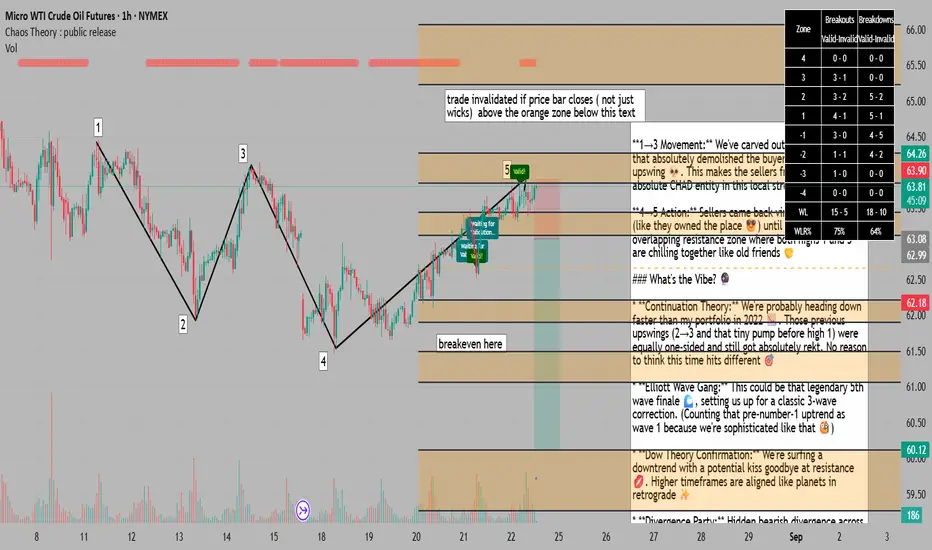
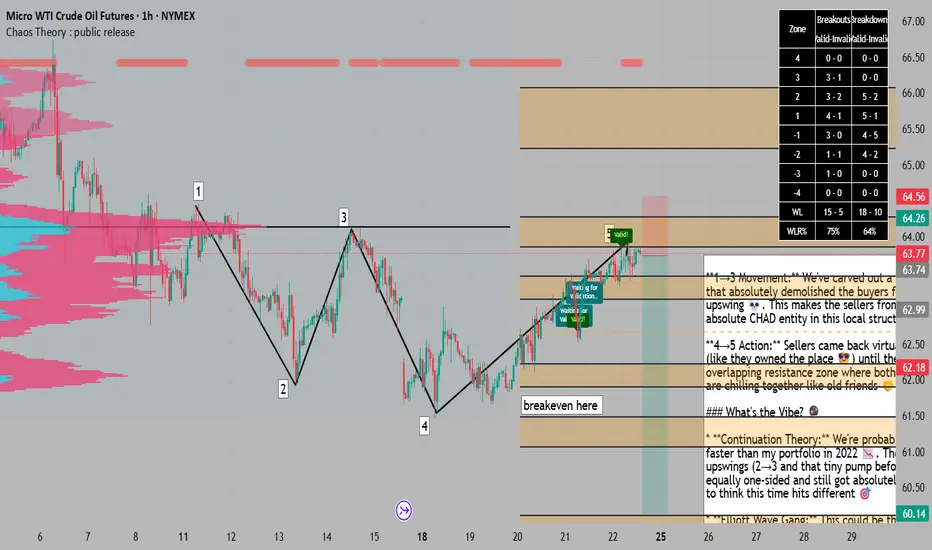
**1→3 Movement:** We've carved out a spicy lower low that absolutely demolished the buyers from that 2→3 upswing 💀. This makes the sellers from numero uno the absolute CHAD entity in this local structure 💪
**4→5 Action:** Sellers came back virtually unchecked (like they owned the place 😎) until they hit that overlapping resistance zone where both highs 1 and 3 are chilling together like old friends 🤝
### What's the Vibe? 🔮
* **Continuation Theory:** We're probably heading down faster than my portfolio in 2022 📉. Those previous upswings (2→3 and that tiny pump before high 1) were equally one-sided and still got absolutely rekt. No reason to think this time hits different 🎯
* **Elliott Wave Gang:** This could be that legendary 5th wave finale 🌊, setting us up for a classic 3-wave correction. (Counting that pre-number-1 uptrend as wave 1 because we're sophisticated like that 🧐)
* **Dow Theory Confirmation:** We're surfing a downtrend with a potential kiss goodbye at resistance 💋. Higher timeframes are aligned like planets in retrograde ✨
* **Divergence Party:** Hidden bearish divergence across RSI, MFI, and A/D indicators 📊 - the triple threat confirmation we love to see 🎪
### Chaos Theory Stats (Because We're Built Different) 🌪️
* **64% Probability:** If price closes below a zone, there's a 64% chance it'll hit the next zone down. That's better than a coinflip, and we'll take those odds all day 🎲
* **Breakeven Placement:** Strategically positioned because if price returns to the zone above after hitting BE, we've got a 75% chance of revisiting entry (and nobody likes giving back profits) 💸
* **Zone Selection:** Next orange zone below is the target because we're methodical like that 🎯
* **Data Backing:** These stats are from the last 2,500 bars - not some random hopium, actual backtested edge 📈
**Trade Invalid:** If price closes above that orange zone lurking below this text ⚠️
---
*Not financial advice, just one trader's vibe check on the markets* 🚀💀
Crude Oil Warning $66.40 Flip Signals $63.86 TargetWTI rolled over after failing near $68.66096 (top red dashed line). The breakdown through $66.40002 turned that level into resistance 🚧. After a sharp selloff, price is now hovering around the $65.54 area (thin entry line labeled 65.54232), just beneath the minor pivot band at 65.54 / 65.52 / 65.21 (green dashed cluster labeled 65.54232 • 65.52347 • 65.20824). The structure is lower-high → lower-low, which keeps momentum bearish while price holds below $66.40. If sellers keep control, the next magnet is the confluence support around $63.86661 (first lower green dashed line), with extension into $63.51000–$63.46746 if momentum accelerates.
You can also see repeated “S” tags on the push down from the high and into the mid-range, while the “B” tags cluster only at pullback lows—classic distribution behavior. Any spikes toward $66.07 (label 66.07275) and especially $66.40 should attract supply unless bulls reclaim and hold above that zone.
Trade setup 🎯 (from the chart):
• Entry: $65.54232 (≈ $65.54)
• Stop-loss: $66.07275 (≈ $66.07), conservative SL above $66.40002 if you prefer more room
• Targets: $63.86661 first take-profit; stretch targets $63.51000 → $63.46746
This offers a solid bearish R:R while price stays capped beneath $66.40. As it moves your way, book small profits 💰 at each objective, trail stops 🔒 (e.g., to $65.52 once under $65.21), and size the position to your own risk tolerance—WTI can spike on headlines.
Invalidation: A sustained reclaim and hold above $66.40 would neutralize the immediate bearish bias and open room back toward $68.66. Until then, the path of least resistance remains down 📉.

WTI(20250821)Today's AnalysisMarket Update:
This week, central bankers from around the world gathered in Jackson Hole, Wyoming, for the annual global central bank meeting. They planned not only to exchange research and enjoy the beautiful mountain scenery, but also to defend Federal Reserve Chairman Jerome Powell. Powell has come under sustained attack from US President Trump for his refusal to cut interest rates. Trump has also promised to replace Powell with a more compliant candidate after his term ends next year. This offensive has unnerved global policymakers, who worry that central bank independence, seen as key to controlling inflation, could be undermined.
Technical Analysis:
Today's Buy/Sell Levels:
62.47
Support and Resistance Levels:
63.64
63.21
62.92
62.02
61.74
61.30
Trading Strategy:
On the upside, consider buying on a breakout above 62.92, with the first target at 63.21.
On the downside, consider selling on a breakout above 62.47, with the first target at 62.02.

Crude Oil Bearish and Bullish scenarios for the weekCrude Oil can go both directions this week depending on the price we hit in the start of the week.
Patience Patience Patience!!!!

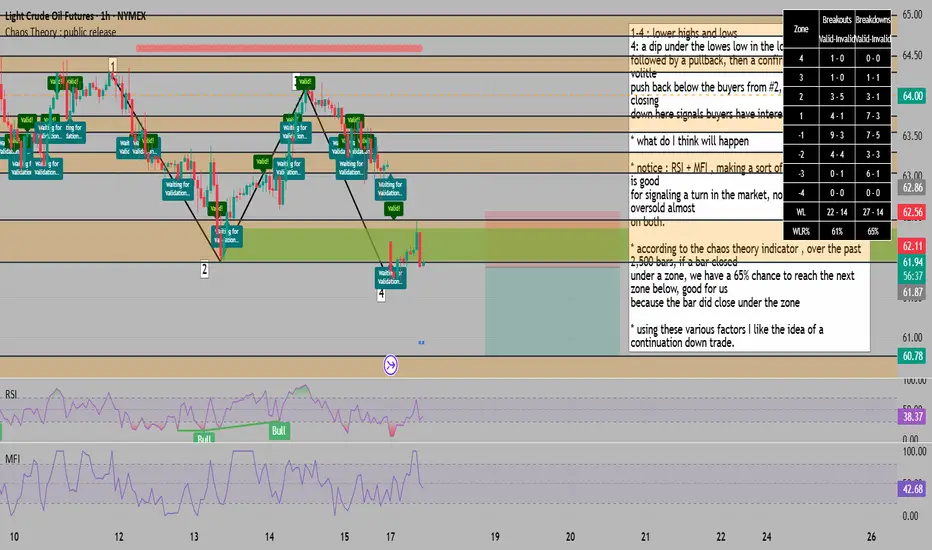
downtrend continuation confirmed on the hourly for the next leg1-4 : lower highs and lows
4: a dip under the lowes low in the local structure ,
followed by a pullback, then a confirmation STRONG volitle
push back below the buyers from #2, for me the candle closing
down here signals buyers have interest
* what do I think will happen
* notice : RSI + MFI , making a sort of triangle shape, this is good
for signaling a turn in the market, not to mention oversold almost
on both.
* according to the chaos theory indicator , over the past 2,500 bars, if a bar closed
under a zone, we have a 65% chance to reach the next zone below, good for us
because the bar did close under the zone
* using these various factors I like the idea of a continuation down trade.
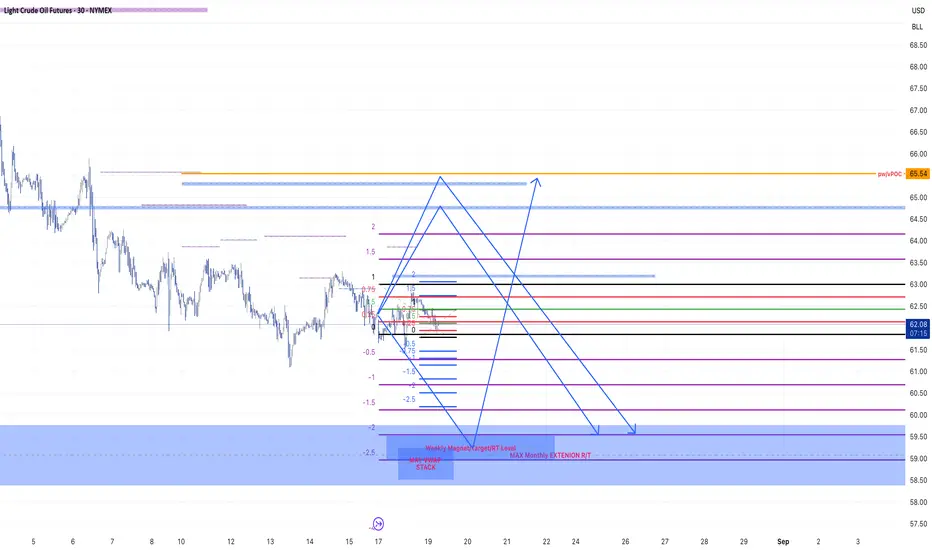
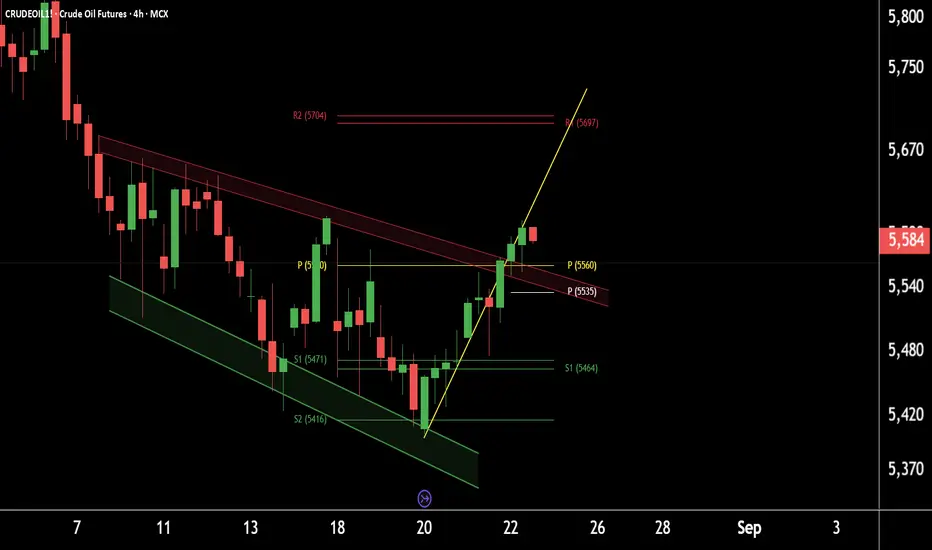
Crude Oil breaks out of falling channel –Watch for higher level.This is the 4-hour timeframe chart of CrudeOil1!.
The price has been moving within a well-defined falling channel and has now given a breakout. A possible retest of the breakout level around 5560 may occur, after which CrudeOil could move towards the falling channel completion target near 5700.
Weekly pivot support is also placed around the 5400–5450 zone and resistance around 5700.
If this level is sustained, we may see higher prices in CrudeOil1!
Thank You !!
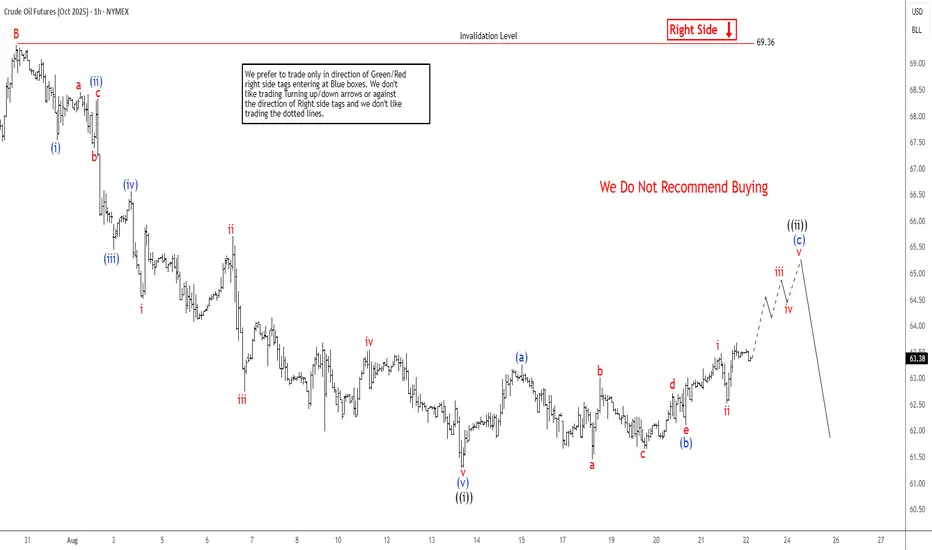
Oil (CL) Anticipating a Decline from $64.7 LevelCrude oil (CL) exhibits a bearish trend following its June 23, 2025, peak, signaling further declines. The ongoing descent forms a zigzag Elliott Wave pattern. From the June high, wave A dropped to $64, while wave B rebounded to $70.58, as depicted in the accompanying one-hour chart. Wave C, now unfolding, breaks into a five-wave impulse structure. From wave B’s peak, wave (i) concluded at $68.56, followed by a wave (ii) rally to $69.58. The commodity then fell in wave (iii) to $66.56, with wave (iv) recovering to $67.74.
Currently, oil continues its decline in wave (v), reaching $61.94, completing wave ((i)) in a higher degree. A corrective rally in wave ((ii)) is underway, structured as a lesser-degree zigzag. From wave ((i)), wave (a) climbed to $64.15, followed by a wave (b) pullback forming a triangle, ending at $62.52. Wave (c) is now advancing toward the $64.68–$66.01 range, corresponding to a 100%–161.8% Fibonacci extension of wave (a), to complete wave ((ii)) before resuming the downtrend. In the near term, as long as the $70.58 pivot holds, expect corrective rallies to falter in a 3, 7, or 11-swing pattern, paving the way for further declines.
Crude Oil Retesting Key Support: Is a Reversal Imminent? Current Price: $62.8
Direction: LONG
Targets:
- T1 = $65.2
- T2 = $68.5
Stop Levels:
- S1 = $60.5
- S2 = $58.9
**Wisdom of Professional Traders:**
This analysis synthesizes insights from thousands of professional traders and market experts, leveraging collective intelligence to identify high-probability trade setups. Traders with years of experience in commodity markets have noted that Crude Oil often displays predictable price behavior around key technical levels, providing opportunities for well-timed entries. The collective opinion focuses on the importance of geopolitical events, inventory data, and technical demand zones that could shape the next move for Crude Oil.
**Key Insights:**
Recent market action suggests that Crude Oil is testing historical support levels near $62.0-$63.0, widely considered a demand zone by traders familiar with long-term price patterns. These levels have coincided with prior reversals, where bullish momentum emerged after extended corrections. With Brent and WTI futures aligning on a moderate bullish outlook, traders are capitalizing on divergences in the Relative Strength Index (RSI) and oversold conditions.
The market fundamentals remain in focus, with supply constraints from production cuts in major OPEC countries and tightening reserves due to export bans. On the demand side, a pickup in industrial activity in China, combined with steady global aviation fuel consumption, has recently supported crude oil prices. Additionally, the U.S. dollar has shown minor declines, easing pressure on dollar-denominated commodities like oil.
**Recent Performance:**
Crude Oil has witnessed a multi-week correction from highs in the $70 range, reflecting a pullback in anticipation of rising global interest rates. Over the last two weeks, however, prices have stabilized between $62.0 and $64.0 levels, with intraday volatility driven by inventory releases and remarks from OPEC officials. While the downward trajectory has dampened investor sentiment, price consolidation hints at strengthening support capable of generating a rebound.
**Expert Analysis:**
Technical analysis highlights the importance of a bullish crossover observed in the MACD histogram, suggesting growing upward momentum as bearish volumes taper out. Crude Oil also shows signs of a near-perfect Fibonacci retracement to the 61.8% level from its recent uptrend, reinforcing probabilities for a reversal. Experts stress that maintaining above $62.0 is critical, and a breakout above $65.0 could re-establish broader bullish sentiment as near-term resistance weakens.
From fundamental perspectives, analysts underline upcoming geopolitical developments like the Russia-Ukraine conflict, Middle East tensions, and U.S. reserve release strategies as potential catalysts for price movement. A tighter global crude inventory balance supports long positions as energy demand grows in the coming quarter.
**News Impact:**
Recent headlines reporting OPEC's continued adherence to production cuts, combined with rumors of extended strategic petroleum reserve releases from the U.S., create a mixed trading backdrop. However, China's recovery post-pandemic lockdowns fuels strong optimism for Crude Oil as key demand expectations rise in Q4. Any renewed supply disruptions from geopolitical events could inject volatility, emphasizing the importance of strategic stop levels for traders taking new positions.
**Trading Recommendation:**
Based on combined technical, fundamental, and sentiment analysis, initiating a LONG position on Crude Oil at current levels ($62.8) aligns with a high-probability scenario for reversal. Tight stop losses below $60.5 provide controlled risk exposure while targeting resistance at $65.2 and potentially $68.5. Traders should monitor inventory data and OPEC announcements for further clarity. Crude Oil's rebound potential makes this an opportunistic setup for bullish positions in the short-to-medium term.
Do you want to save hours every week?
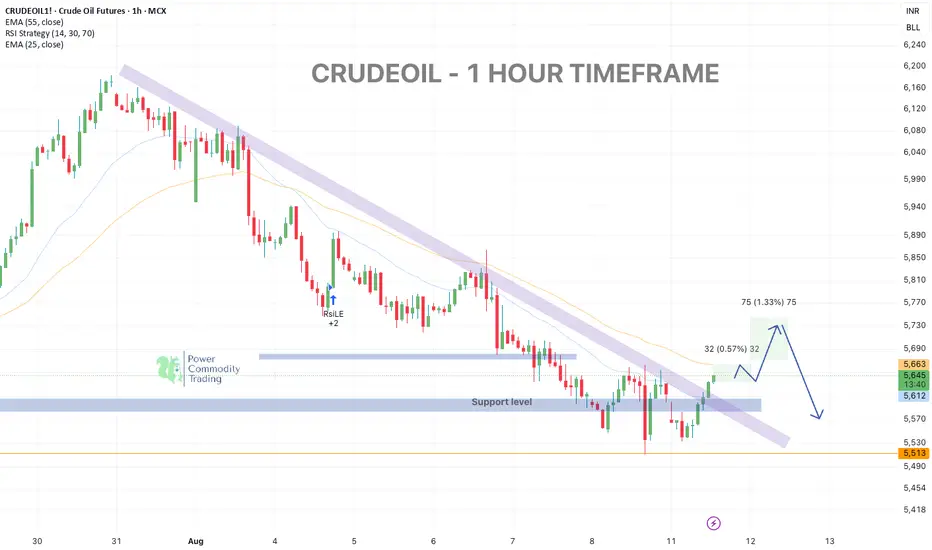
Crude Oil – Retesting Resistance | Possible Pullback Trade Setu
Crude Oil (1H timeframe)
broken out from its short-term downtrend channel and is now retesting key resistance near 5740.
Price is holding above the 5610 support, but upside is likely capped unless bulls sustain momentum.
🔹 Key Levels:
• Resistance: 5740 – 5770
• Support: 5610 → 5513
📊 Technical View & Trade Plan:
• Sell Zone: 5730 – 5770 (near trendline resistance)
• Stop Loss: Above 5800
• Target 1: 5610
• Target 2: 5513
💡 Next Scenario:
• If price breaks & sustains above 5800, bullish momentum could extend toward 5860 – 5900.
• If rejection happens at resistance, expect a pullback toward 5610 and possibly 5513.
Bias: Neutral to Bearish — waiting for price reaction at resistance to confirm the next move.
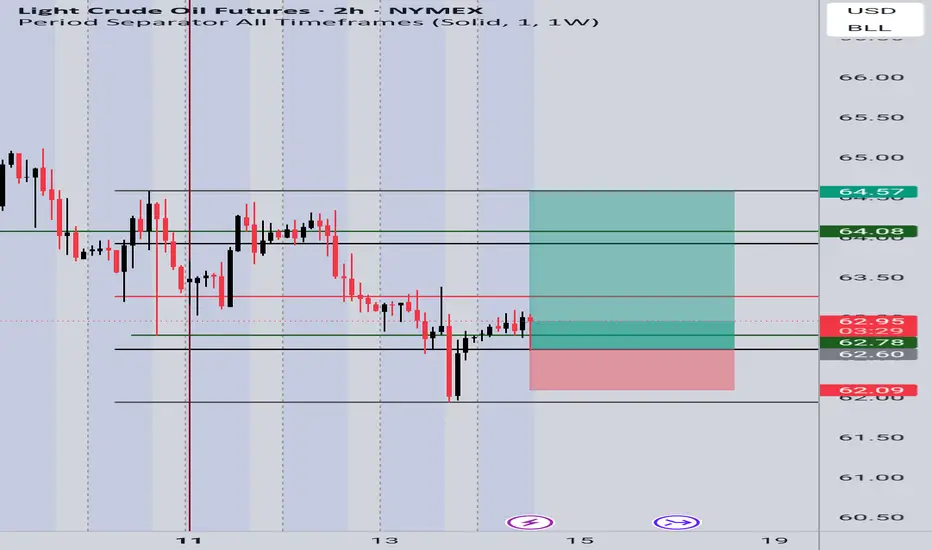
CL1! Long Setup – Recovery BounceBias: Bullish
Reasoning:
Demand zone respected – Price reacted strongly from the 62.00 – 62.20 support zone, forming a bullish rejection wick.
Liquidity sweep – The recent dip below support grabbed liquidity before reversing upward, signaling possible continuation.
Higher timeframe confluence – On the daily, crude oil remains in a broader accumulation phase with buyers stepping in at key support.
Risk-to-Reward setup – Entry near 62.70 – 62.90, targeting higher resistance zones, gives a favorable R:R.
Entry: 62.70 – 62.90
Stop Loss (SL): 62.00 (below liquidity sweep)
Target 1 (TP1): 64.08
Target 2 (TP2): 64.57
📈 Plan: Looking for price to push higher as long as it holds above 62.00 support.
crude long ideacrudeoil futures india mcx to take a support at 4 th wave base correction , should be a good buy setup , as this levels hold premiums as per price levels are.
to continue upside, always first attempt at major levels respects

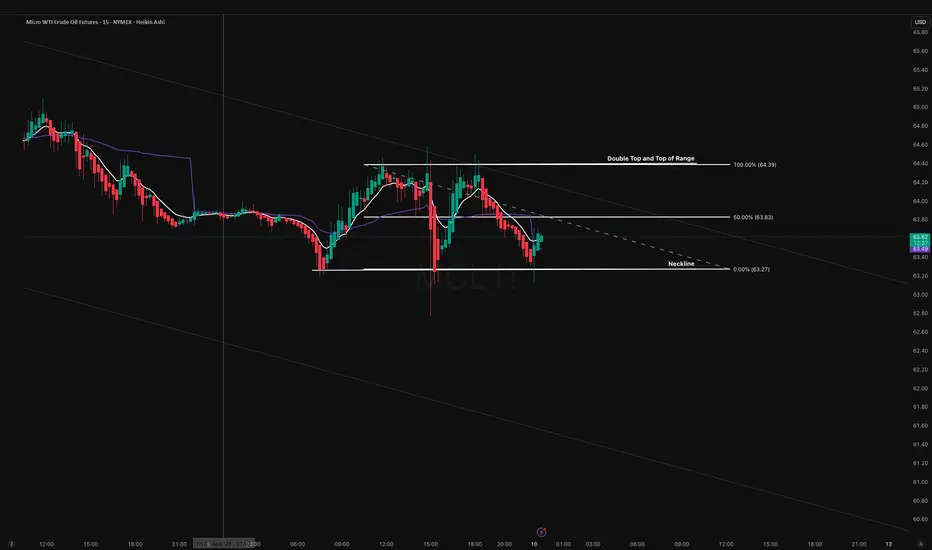
MCL About to Take the Express Elevator DownOn the 15-min chart, MCL has completed a clean double top at 64.50, with neckline support broken at 63.00. This pattern is forming within a broader descending channel, adding higher-timeframe confluence for further downside.
Bearish Scenario (Primary Bias – 70% Probability)
- Entry Zone: 63.80–64.00 retest of broken neckline
- Stop Loss: 64.20 (above retest high)
- Target 1: 62.50 (recent swing low / intraday liquidity pocket)
- Target 2: 61.50 (lower channel boundary)
- Target 3: 60.80 (HTF measured move from double top)
Technical confluence:
Pattern completion, retest rejection, descending channel structure, macro trend alignment.
Bullish Invalidator (30% Probability)
A sustained reclaim of 64.20 with volume would invalidate the breakdown, likely triggering a short squeeze back into 64.50–64.70. This scenario is less likely without a macro catalyst during Tokyo liquidity, but remains a risk consideration.
The Tokyo open often sees thin liquidity in oil futures, meaning stop hunts above retest zones are common. Patience is key wait for rejection confirmation before entering short.
Bearish unless we see a confirmed reclaim and hold above 64.20. Short from 63.80–64.00 offers a high R:R toward the 62.50–60.80 range.
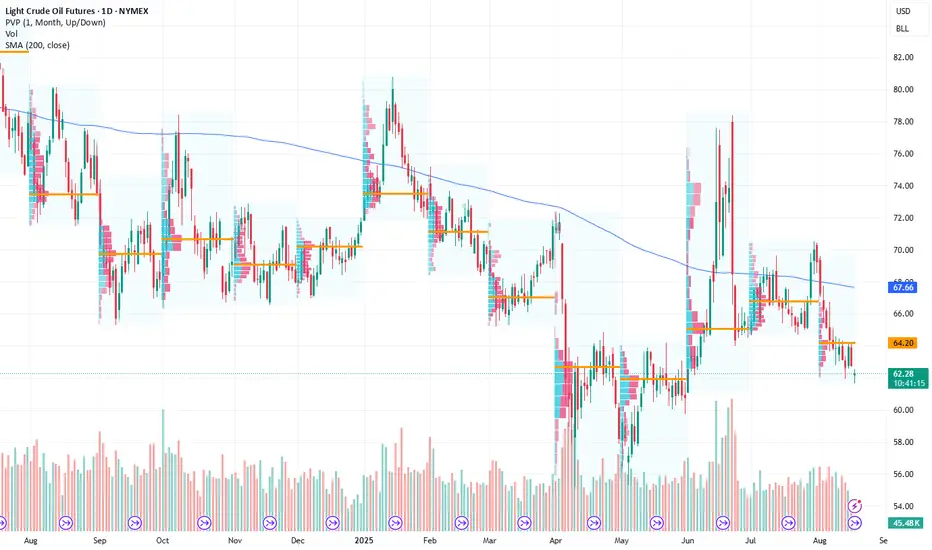
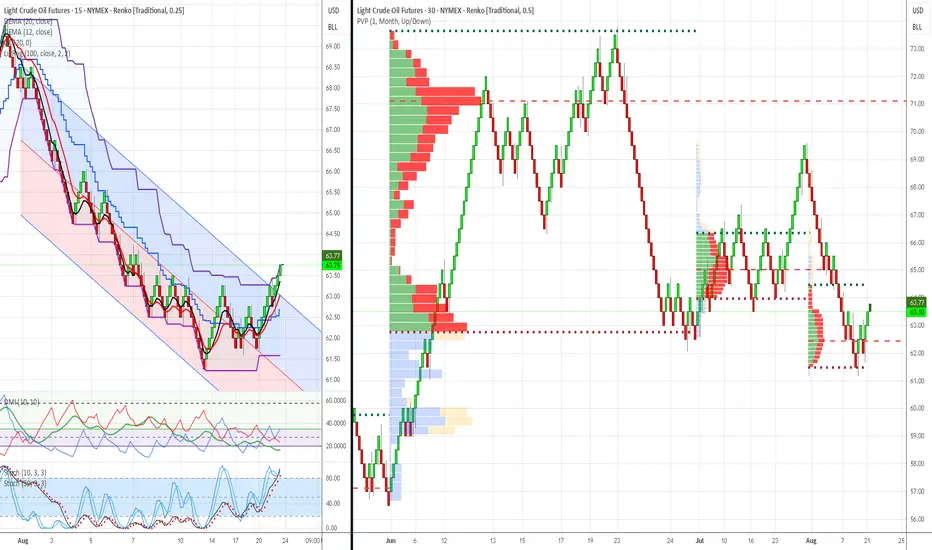
WTI Crude Oil Trading Analysis: June-August 2025 - 25-AugustWTI Crude Oil Trading Analysis: June-August 2025 Review & Week of August 25th Recommendations
Analysis Date : August 23, 2025
Market : WTI Crude Oil Futures (CL1!)
Methodology : Dual Renko Chart System ($0.25/15min + $0.50/30min)
Volume Profile : 3-Month Monthly Analysis (June-August 2025)
Executive Summary
Market Regime: Oil has completed a major corrective phase from $72 highs to $61 lows, establishing a clear bottoming pattern with strong institutional accumulation. Current setup presents high-probability bullish swing opportunity with excellent risk/reward characteristics.
Current Status : Bullish reversal confirmed with multiple technical confluences at critical support zone. Recommended positioning for upside targets with systematic risk management protocols.
3-Month Market Structure Analysis (June-August 2025)
Phase 1: Distribution & Breakdown (June-July)
Price Action: $72 → $61 (-15% decline)
June Peak: Heavy red volume distribution at $71-72 level indicated institutional selling
July Decline: Clean Renko downtrend with sustained selling pressure
Volume Profile: Minimal volume during decline, suggesting limited buying interest until $63-64 zone
Phase 2: Accumulation & Reversal Setup (Late July-August)
Price Action: $61 → $63.50 (+4% recovery)
Institutional Buying: Massive green volume accumulation at $63-65 level
Support Establishment: $62-63 zone showing strong buying interest
Technical Reversal: DEMA crossover confirmed bullish momentum shift
Volume Profile Key Levels (3-Month Analysis)
Major Support Zones :
$62-63: Primary institutional accumulation (heaviest green volume)
$60-61: Secondary support with moderate green volume
$58-59: Ultimate support level (limited historical volume)
Resistance Zones:
$66-67: First institutional resistance (mixed volume)
$69-70: Major distribution zone (heavy red volume from June)
$71-72: Ultimate resistance (peak selling pressure)
Current Technical Analysis (August 23, 2025)
Dual Chart Assessment
$0.50 Chart (Structure Analysis):
Trend: Clear bottoming pattern completed at $61 low
Current Position: Testing above major institutional accumulation zone
Volume Confirmation: Trading within heaviest 3-month green volume cluster
Structure: Higher lows pattern emerging since $61 bottom
$0.25 Chart (Execution Analysis):
DEMA Status: Bullish crossover confirmed (Black above Red at $63.00)
DMI/ADX: +DI gaining momentum, ADX rising through 25 level
Donchian Position: Price above basis, testing toward upper band
Recent Action: 3 consecutive green bricks confirming upward momentum
Technical Confluences Supporting Bull Case
Volume Profile: Massive institutional support at current levels
DEMA Crossover: Clear trend reversal signal confirmed
Momentum: DMI showing bullish shift with strengthening ADX
Structure: Higher low pattern vs. $61 bottom
Risk/Reward: Excellent positioning near major support zone
Market Context & Macro Considerations
Current Oil Market Dynamics
Supply: OPEC+ spare capacity at 5.9 million b/d (bearish)
Demand: China slowdown offset by US resilience (neutral)
Inventories: Below 5-year average (bullish)
Refining: Margins supporting crude demand (bullish)
Federal Reserve Impact
Policy Stance: Potential September rate cut (bullish for commodities)
Dollar Weakness: Could support oil prices
Inflation Expectations: Rising energy costs could influence policy
Seasonal Factors
Driving Season: Peak summer demand ending (bearish)
Hurricane Season: Atlantic activity potential (bullish)
Refinery Maintenance: September turnaround season (mixed)
Conclusion & Strategic Outlook
Near-Term Assessment (1-2 weeks): The current setup represents a high-probability swing trading opportunity with exceptional risk/reward characteristics. The combination of institutional volume support, technical reversal signals, and favorable market structure creates optimal conditions for bullish positioning.
Medium-Term Outlook (1-3 months): Successful navigation through the $66-68 resistance zone could establish a broader recovery toward $70-72 levels. However, macroeconomic headwinds and seasonal factors require careful position management and profit-taking discipline.
Risk Assessment: While the setup is compelling, traders must respect the institutional accumulation levels as ultimate support. Any violation of the $62 zone would invalidate the bullish thesis and require immediate position liquidation.
Strategic Advantage: The dual Renko chart system provides both structural clarity and tactical precision, enabling confident position sizing and systematic risk management. The monthly volume profile offers institutional-level insight typically unavailable to retail traders.
Document Classification: Trading Analysis & Recommendations
Risk Disclaimer: Past performance does not guarantee future results. All trading involves risk of loss.
return to solid sellers inspires immediate =SELL market order
**1→3 Movement:** We've carved out a spicy lower low that absolutely demolished the buyers from that 2→3 upswing 💀. This makes the sellers from numero uno the absolute CHAD entity in this local structure 💪
**4→5 Action:** Sellers came back virtually unchecked (like they owned the place 😎) until they hit that overlapping resistance zone where both highs 1 and 3 are chilling together like old friends 🤝
### What's the Vibe? 🔮
* **Continuation Theory:** We're probably heading down faster than my portfolio in 2022 📉. Those previous upswings (2→3 and that tiny pump before high 1) were equally one-sided and still got absolutely rekt. No reason to think this time hits different 🎯
* **Elliott Wave Gang:** This could be that legendary 5th wave finale 🌊, setting us up for a classic 3-wave correction. (Counting that pre-number-1 uptrend as wave 1 because we're sophisticated like that 🧐)
* **Dow Theory Confirmation:** We're surfing a downtrend with a potential kiss goodbye at resistance 💋. Higher timeframes are aligned like planets in retrograde ✨
* **Divergence Party:** Hidden bearish divergence across RSI, MFI, and A/D indicators 📊 - the triple threat confirmation we love to see 🎪
### Chaos Theory Stats (Because We're Built Different) 🌪️
* **64% Probability:** If price closes below a zone, there's a 64% chance it'll hit the next zone down. That's better than a coinflip, and we'll take those odds all day 🎲
* **Breakeven Placement:** Strategically positioned because if price returns to the zone above after hitting BE, we've got a 75% chance of revisiting entry (and nobody likes giving back profits) 💸
* **Zone Selection:** Next orange zone below is the target because we're methodical like that 🎯
* **Data Backing:** These stats are from the last 2,500 bars - not some random hopium, actual backtested edge 📈
**Trade Invalid:** If price closes above that orange zone lurking below this text ⚠️
---
*Not financial advice, just one trader's vibe check on the markets* 🚀💀
Crude oil: Sell around 64.00, target 62.00-60.00.Crude Oil Market Analysis:
Crude oil has rebounded over the past two days, with the daily chart closing in a doji pattern for two consecutive days. This rebound presents another opportunity to sell. Our outlook for crude oil remains bearish, and we continue to monitor resistance at 64.00 and 65.00. Both levels present selling opportunities, and the daily chart is unlikely to change its selling pattern in the short term.
Fundamental Analysis:
The recent positive developments in the Russia-Ukraine situation are weighing on gold. The Federal Reserve's monetary policy, in line with market expectations, is also weighing on gold. Fundamentals suggest that neither is very bullish for gold.
Trading Recommendations:
Crude oil: Sell around 64.00, target 62.00-60.00.

WTI Crude Oil – India Keeps Buying Russian Oil Despite U.S. SancSymbol: USCRUDE
Timeframe: Weekly
Current price: 63.53
⸻
Bearish scenario
• Entry: SELL STOP 62.50
• Targets: 59.38, 56.25, 53.12
• Stop: 64.50
Alternative bearish scenario
• Entry: SELL LIMIT 65.62
• Targets: 59.38, 56.25, 53.12
• Stop: 68.00
⸻
Key levels
Resistance: 65.62, 68.75, 71.88
Support: 62.50, 59.38, 56.25, 53.12
Indicators
• Bollinger Bands → pointing down, resistance at 65.62.
• MACD → negative zone, trend still bearish.
• Stochastic → overbought, risk of reversal.
⸻
📌 WTI is testing 62.50 support. Break lower → downside to 59.38–53.12. If price rebounds near 65.62, sellers could re-enter with tight stops.

Crude oil - Potential UPThe break of breakeven must be give a push UP of price until next resistence area

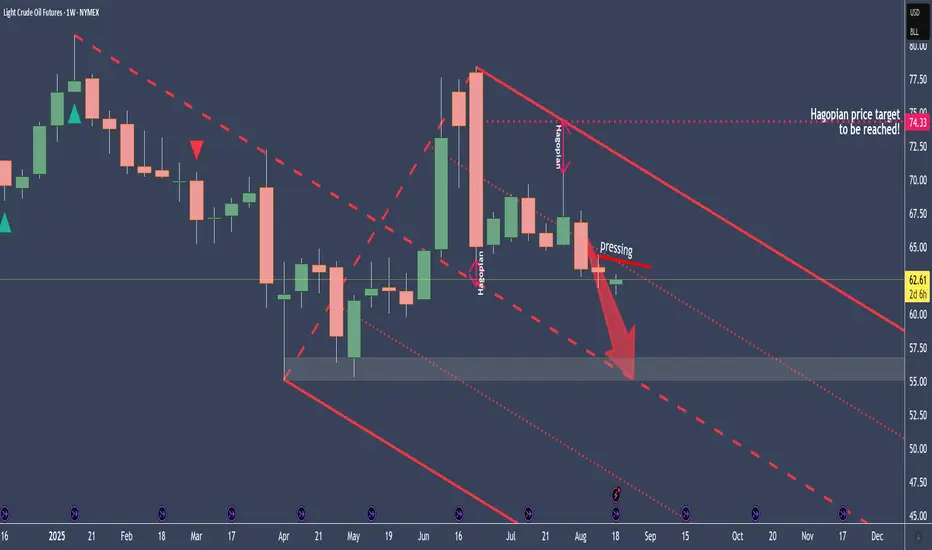
Crude Oil - Why I see it at $56 in the coming weeksCrude is trading below the centerline.
The pressing shows that the “election whales” don’t want higher prices at the moment.
Why?
No idea, and it doesn’t matter either.
All I’m interested in is where I can find a good entry to short crude. For example, a pullback to the pressure line, with a money management stop, or behind one of the weekly candles. It’s all a question of how much risk you’re allowed to take according to risk management.
Let’s see if we get an entry to join the sleigh ride down to the centerline.
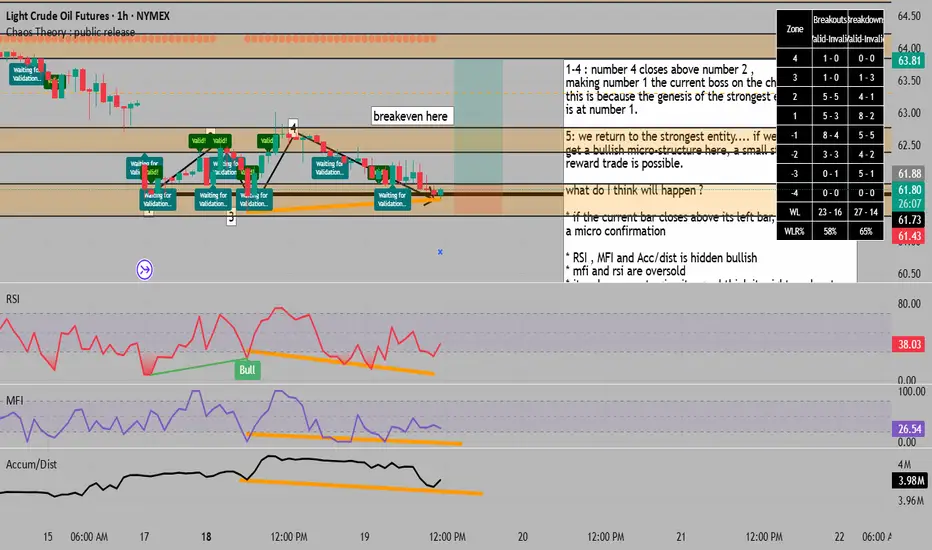
return to solid structure + prev volitility = high RR buy = BUY1-4 : number 4 closes above number 2 ,
making number 1 the current boss on the chart,
this is because the genesis of the strongest entity
is at number 1.
5: we return to the strongest entity.... if we can
get a bullish micro-structure here, a small stop big
reward trade is possible.
what do I think will happen ?
* if the current bar closes above its left bar, we have
a micro confirmation
* RSI , MFI and Acc/dist is hidden bullish
* mfi and rsi are oversold
* it makes sense to give it a go, I think it might work out
* over the past 2,500 bars we have a 58% chance that if
price closes above a zone it will travel to the next zone,
this is a better than random chance, a stop loss above the
next zone is appropriate, because if price travels back then
there is a 65% chance it will come to the start
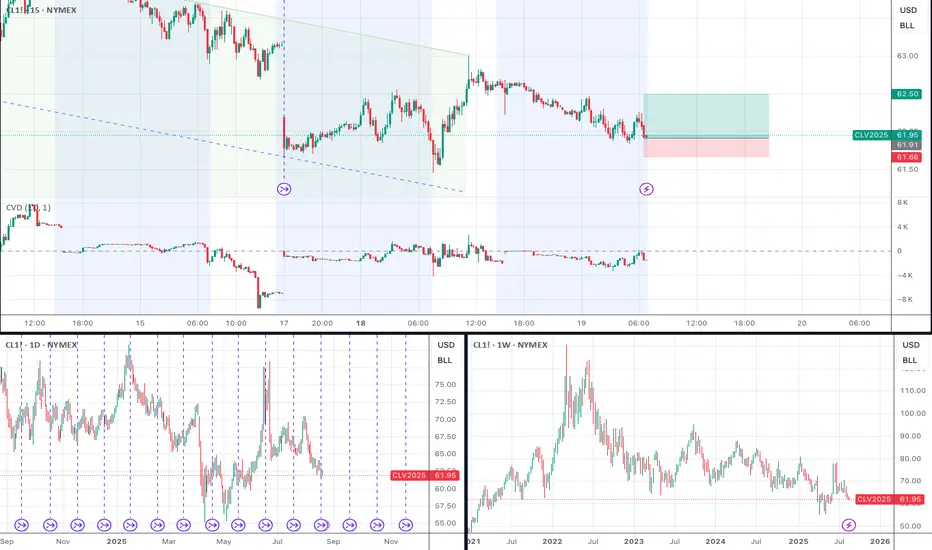
Long CL on Support and CVD DivergenceI live the CVD divergence I'm seeing at this level, and also the liquidity at the order book levels in the 62.40-62.60 range. I think this is worth a small trade to see if this support holds.