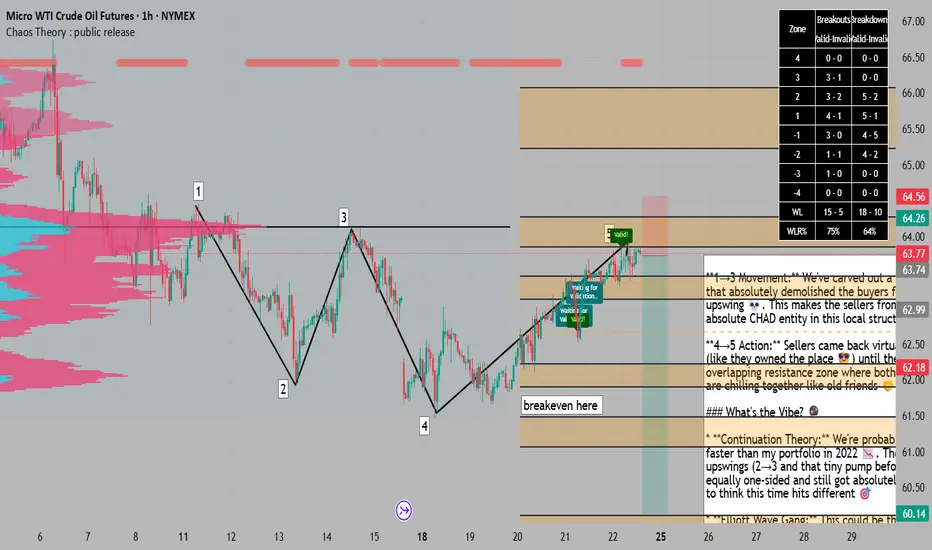
A return to solid sellers in a downtrend paves the way for =SELL
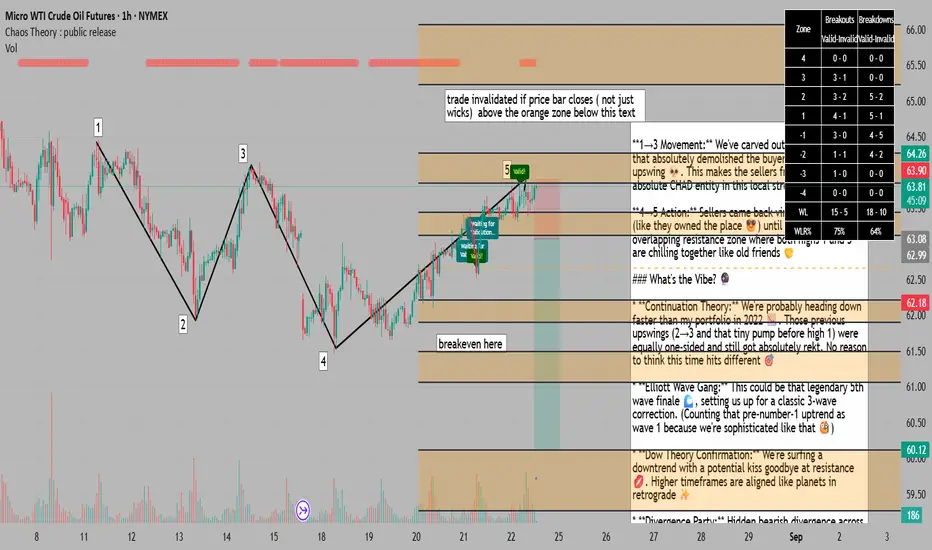
**1→3 Movement:** We've carved out a spicy lower low that absolutely demolished the buyers from that 2→3 upswing 💀. This makes the sellers from numero uno the absolute CHAD entity in this local structure 💪
**4→5 Action:** Sellers came back virtually unchecked (like they owned the place 😎) until they hit that overlapping resistance zone where both highs 1 and 3 are chilling together like old friends 🤝
### What's the Vibe? 🔮
* **Continuation Theory:** We're probably heading down faster than my portfolio in 2022 📉. Those previous upswings (2→3 and that tiny pump before high 1) were equally one-sided and still got absolutely rekt. No reason to think this time hits different 🎯
* **Elliott Wave Gang:** This could be that legendary 5th wave finale 🌊, setting us up for a classic 3-wave correction. (Counting that pre-number-1 uptrend as wave 1 because we're sophisticated like that 🧐)
* **Dow Theory Confirmation:** We're surfing a downtrend with a potential kiss goodbye at resistance 💋. Higher timeframes are aligned like planets in retrograde ✨
* **Divergence Party:** Hidden bearish divergence across RSI, MFI, and A/D indicators 📊 - the triple threat confirmation we love to see 🎪
### Chaos Theory Stats (Because We're Built Different) 🌪️
* **64% Probability:** If price closes below a zone, there's a 64% chance it'll hit the next zone down. That's better than a coinflip, and we'll take those odds all day 🎲
* **Breakeven Placement:** Strategically positioned because if price returns to the zone above after hitting BE, we've got a 75% chance of revisiting entry (and nobody likes giving back profits) 💸
* **Zone Selection:** Next orange zone below is the target because we're methodical like that 🎯
* **Data Backing:** These stats are from the last 2,500 bars - not some random hopium, actual backtested edge 📈
**Trade Invalid:** If price closes above that orange zone lurking below this text ⚠️
---
*Not financial advice, just one trader's vibe check on the markets* 🚀💀
CLV2023 trade ideas
This is part two of a monthly reviewThis is the 21st of August.. It's important to go back and look at a previous video since I'm trying to make decisions as to the direction of the market and this will give you a chance to see whether or not price action and patterns can find you good trade location which includes small stops and reasonable Rewards.

Crude oil - Sell around 64.00, target 60.00-58.00Crude Oil Market Analysis:
Has crude oil fallen again? We've maintained a bearish outlook for a reason. Crude oil is currently moving relatively downward, so take any sell orders you've entered. Today's strategy remains bearish, focusing on selling opportunities around 64.00. Crude oil has been fluctuating for a long time, and every rebound presents a selling opportunity. Recent fundamentals and data don't support buying crude oil.
Fundamental Analysis:
There are no major data releases this week. A few unexpected events may have a certain impact on gold fundamentals. The Federal Reserve's monetary policy remains stable, and the record highs in Treasury bonds support buying in gold.
Trading Recommendations:
Crude oil - Sell around 64.00, target 60.00-58.00

WTI(20250821)Today's AnalysisMarket Update:
This week, central bankers from around the world gathered in Jackson Hole, Wyoming, for the annual global central bank meeting. They planned not only to exchange research and enjoy the beautiful mountain scenery, but also to defend Federal Reserve Chairman Jerome Powell. Powell has come under sustained attack from US President Trump for his refusal to cut interest rates. Trump has also promised to replace Powell with a more compliant candidate after his term ends next year. This offensive has unnerved global policymakers, who worry that central bank independence, seen as key to controlling inflation, could be undermined.
Technical Analysis:
Today's Buy/Sell Levels:
62.47
Support and Resistance Levels:
63.64
63.21
62.92
62.02
61.74
61.30
Trading Strategy:
On the upside, consider buying on a breakout above 62.92, with the first target at 63.21.
On the downside, consider selling on a breakout above 62.47, with the first target at 62.02.

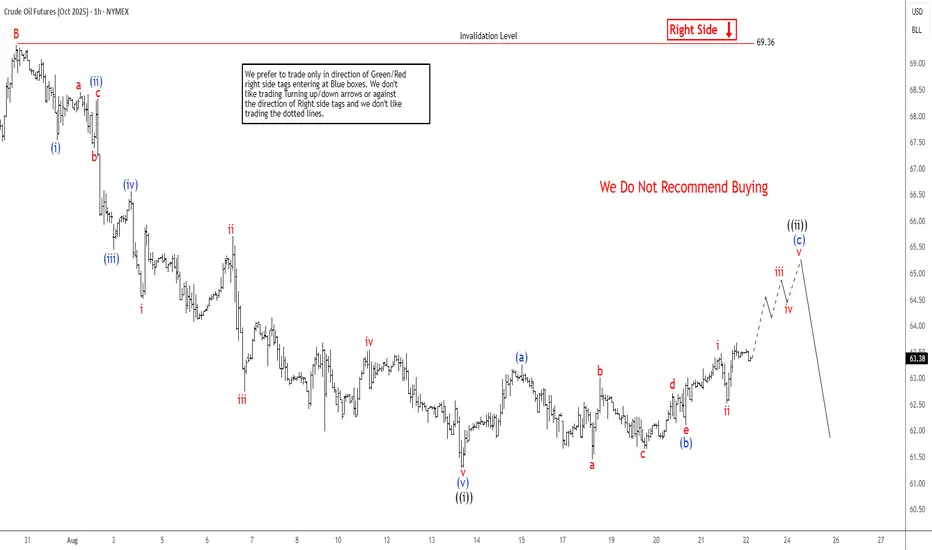
Oil (CL) Anticipating a Decline from $64.7 LevelCrude oil (CL) exhibits a bearish trend following its June 23, 2025, peak, signaling further declines. The ongoing descent forms a zigzag Elliott Wave pattern. From the June high, wave A dropped to $64, while wave B rebounded to $70.58, as depicted in the accompanying one-hour chart. Wave C, now unfolding, breaks into a five-wave impulse structure. From wave B’s peak, wave (i) concluded at $68.56, followed by a wave (ii) rally to $69.58. The commodity then fell in wave (iii) to $66.56, with wave (iv) recovering to $67.74.
Currently, oil continues its decline in wave (v), reaching $61.94, completing wave ((i)) in a higher degree. A corrective rally in wave ((ii)) is underway, structured as a lesser-degree zigzag. From wave ((i)), wave (a) climbed to $64.15, followed by a wave (b) pullback forming a triangle, ending at $62.52. Wave (c) is now advancing toward the $64.68–$66.01 range, corresponding to a 100%–161.8% Fibonacci extension of wave (a), to complete wave ((ii)) before resuming the downtrend. In the near term, as long as the $70.58 pivot holds, expect corrective rallies to falter in a 3, 7, or 11-swing pattern, paving the way for further declines.
Crude Oil Warning $66.40 Flip Signals $63.86 TargetWTI rolled over after failing near $68.66096 (top red dashed line). The breakdown through $66.40002 turned that level into resistance 🚧. After a sharp selloff, price is now hovering around the $65.54 area (thin entry line labeled 65.54232), just beneath the minor pivot band at 65.54 / 65.52 / 65.21 (green dashed cluster labeled 65.54232 • 65.52347 • 65.20824). The structure is lower-high → lower-low, which keeps momentum bearish while price holds below $66.40. If sellers keep control, the next magnet is the confluence support around $63.86661 (first lower green dashed line), with extension into $63.51000–$63.46746 if momentum accelerates.
You can also see repeated “S” tags on the push down from the high and into the mid-range, while the “B” tags cluster only at pullback lows—classic distribution behavior. Any spikes toward $66.07 (label 66.07275) and especially $66.40 should attract supply unless bulls reclaim and hold above that zone.
Trade setup 🎯 (from the chart):
• Entry: $65.54232 (≈ $65.54)
• Stop-loss: $66.07275 (≈ $66.07), conservative SL above $66.40002 if you prefer more room
• Targets: $63.86661 first take-profit; stretch targets $63.51000 → $63.46746
This offers a solid bearish R:R while price stays capped beneath $66.40. As it moves your way, book small profits 💰 at each objective, trail stops 🔒 (e.g., to $65.52 once under $65.21), and size the position to your own risk tolerance—WTI can spike on headlines.
Invalidation: A sustained reclaim and hold above $66.40 would neutralize the immediate bearish bias and open room back toward $68.66. Until then, the path of least resistance remains down 📉.

WTI(20250826)Today's AnalysisMarket News:
Intel: The Trump administration's stake poses risks to the business and could rise to 15%. Trump: We will continue to work on deals similar to Intel's.
Technical Analysis:
Today's Bullish/Bearish Divide:
64.30
Support and Resistance Levels:
65.83
65.26
64.89
63.71
63.34
62.77
Trading Strategy:
If the stock breaks above 64.89, consider a buy entry, with the first target at 65.26.
If the stock breaks below 64.30, consider a sell entry, with the first target at 63.71.

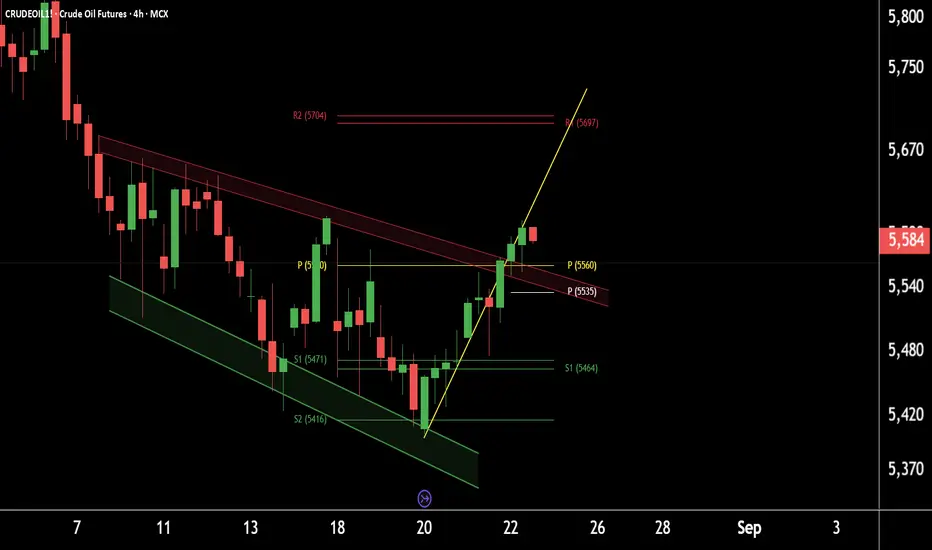
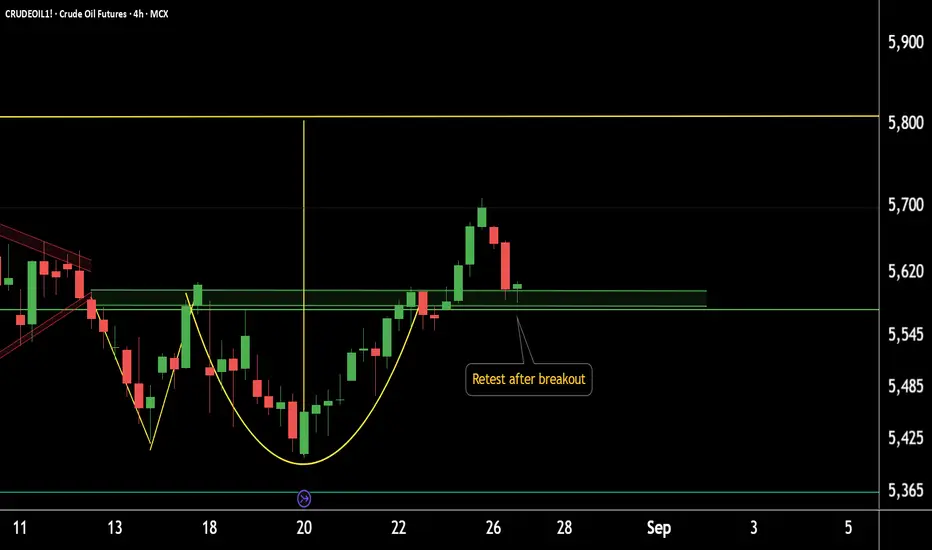
Crude Oil breaks out of falling channel –Watch for higher level.This is the 4-hour timeframe chart of CrudeOil1!.
The price has been moving within a well-defined falling channel and has now given a breakout. A possible retest of the breakout level around 5560 may occur, after which CrudeOil could move towards the falling channel completion target near 5700.
Weekly pivot support is also placed around the 5400–5450 zone and resistance around 5700.
If this level is sustained, we may see higher prices in CrudeOil1!
Thank You !!
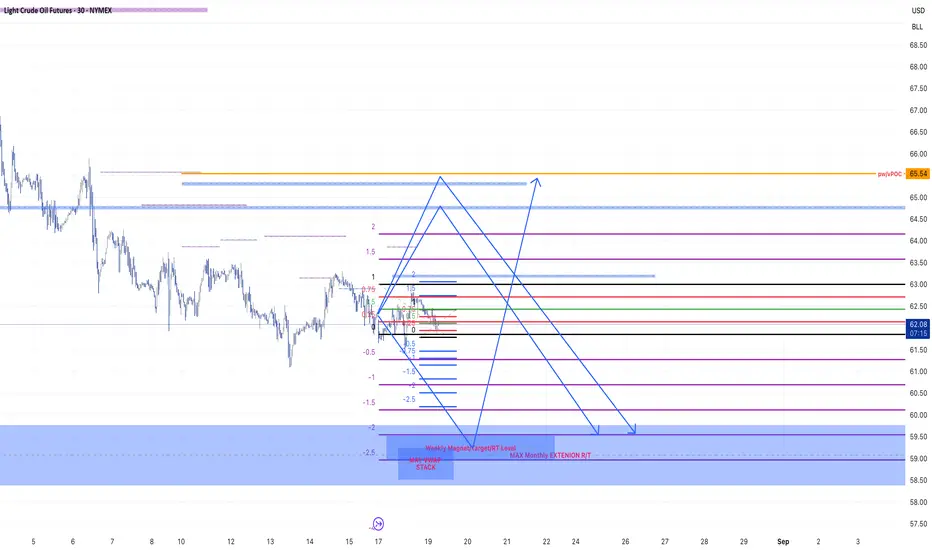
Crude Oil Bearish and Bullish scenarios for the week (UPDATE!!!)Crude Oil can go both directions this week depending on the price we hit in the start of the week.
Patience Patience Patience!!!!
PS: Previous Idea had some wrong measurements. It is fixed now!
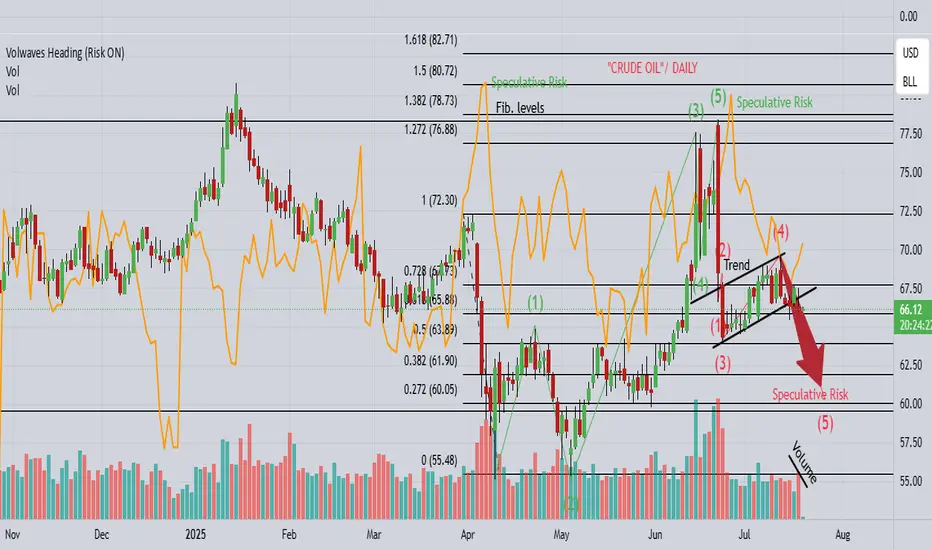
CL "OIL" continues the drop towards $60!1). Wave 5 drop needs a completion lower! 2). Risk is selling off! 3). Volume is falling! 4). Price appears to be heading towards lower market sentiment! 5). Trump is imposing more Tariffs, which is likely causing deeper corrections!
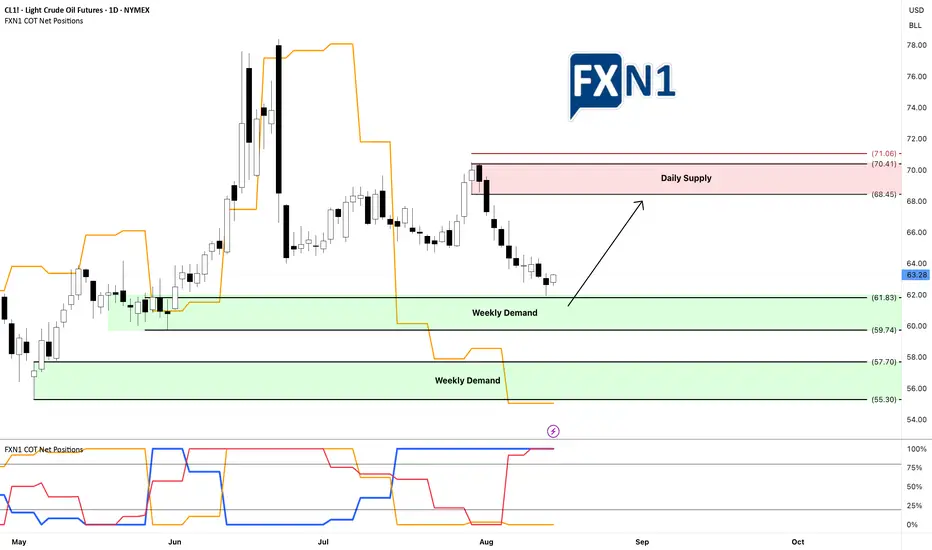
Oil Market Insights: Demand Zones and Future FundamentalsYesterday, CL1! oil tested and rebounded from my weekly demand zone without triggering my entry, resulting in a missed opportunity for several points. This suggests to me that there is buying interest at this level, regardless of the fact that non-commercial traders are short. I am now looking for a retest of this area—if I'm fortunate—to enter a long position. I am also awaiting the new COT data tomorrow to assess any potential shifts in fundamentals. Additionally, I am considering the presence of a stronger demand zone below, which appears even more promising. We'll see how it unfolds.
✅ Please share your thoughts about CL1! in the comments section below and HIT LIKE if you appreciate my analysis. Don't forget to FOLLOW ME; you will help us a lot with this small contribution.
Crude Oil Retesting Key Support: Is a Reversal Imminent? Current Price: $62.8
Direction: LONG
Targets:
- T1 = $65.2
- T2 = $68.5
Stop Levels:
- S1 = $60.5
- S2 = $58.9
**Wisdom of Professional Traders:**
This analysis synthesizes insights from thousands of professional traders and market experts, leveraging collective intelligence to identify high-probability trade setups. Traders with years of experience in commodity markets have noted that Crude Oil often displays predictable price behavior around key technical levels, providing opportunities for well-timed entries. The collective opinion focuses on the importance of geopolitical events, inventory data, and technical demand zones that could shape the next move for Crude Oil.
**Key Insights:**
Recent market action suggests that Crude Oil is testing historical support levels near $62.0-$63.0, widely considered a demand zone by traders familiar with long-term price patterns. These levels have coincided with prior reversals, where bullish momentum emerged after extended corrections. With Brent and WTI futures aligning on a moderate bullish outlook, traders are capitalizing on divergences in the Relative Strength Index (RSI) and oversold conditions.
The market fundamentals remain in focus, with supply constraints from production cuts in major OPEC countries and tightening reserves due to export bans. On the demand side, a pickup in industrial activity in China, combined with steady global aviation fuel consumption, has recently supported crude oil prices. Additionally, the U.S. dollar has shown minor declines, easing pressure on dollar-denominated commodities like oil.
**Recent Performance:**
Crude Oil has witnessed a multi-week correction from highs in the $70 range, reflecting a pullback in anticipation of rising global interest rates. Over the last two weeks, however, prices have stabilized between $62.0 and $64.0 levels, with intraday volatility driven by inventory releases and remarks from OPEC officials. While the downward trajectory has dampened investor sentiment, price consolidation hints at strengthening support capable of generating a rebound.
**Expert Analysis:**
Technical analysis highlights the importance of a bullish crossover observed in the MACD histogram, suggesting growing upward momentum as bearish volumes taper out. Crude Oil also shows signs of a near-perfect Fibonacci retracement to the 61.8% level from its recent uptrend, reinforcing probabilities for a reversal. Experts stress that maintaining above $62.0 is critical, and a breakout above $65.0 could re-establish broader bullish sentiment as near-term resistance weakens.
From fundamental perspectives, analysts underline upcoming geopolitical developments like the Russia-Ukraine conflict, Middle East tensions, and U.S. reserve release strategies as potential catalysts for price movement. A tighter global crude inventory balance supports long positions as energy demand grows in the coming quarter.
**News Impact:**
Recent headlines reporting OPEC's continued adherence to production cuts, combined with rumors of extended strategic petroleum reserve releases from the U.S., create a mixed trading backdrop. However, China's recovery post-pandemic lockdowns fuels strong optimism for Crude Oil as key demand expectations rise in Q4. Any renewed supply disruptions from geopolitical events could inject volatility, emphasizing the importance of strategic stop levels for traders taking new positions.
**Trading Recommendation:**
Based on combined technical, fundamental, and sentiment analysis, initiating a LONG position on Crude Oil at current levels ($62.8) aligns with a high-probability scenario for reversal. Tight stop losses below $60.5 provide controlled risk exposure while targeting resistance at $65.2 and potentially $68.5. Traders should monitor inventory data and OPEC announcements for further clarity. Crude Oil's rebound potential makes this an opportunistic setup for bullish positions in the short-to-medium term.
Do you want to save hours every week?
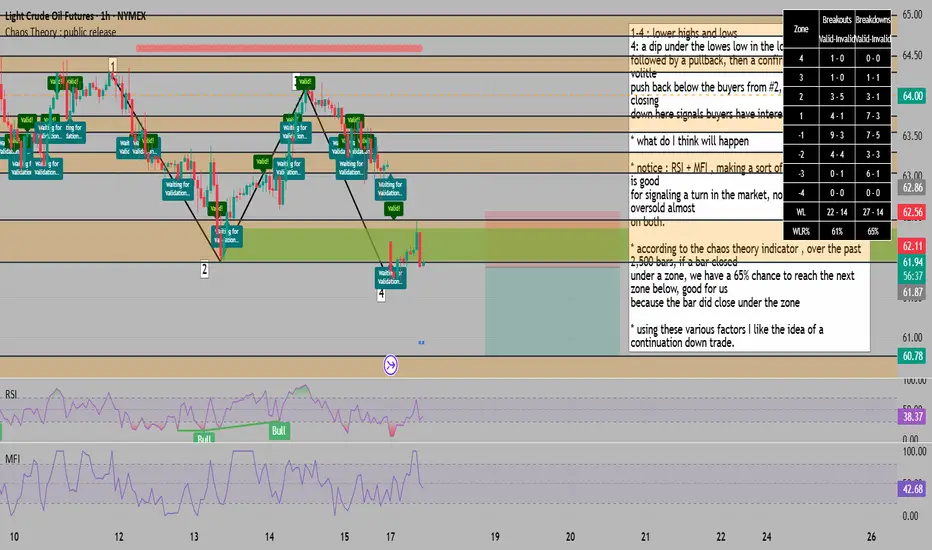
downtrend continuation confirmed on the hourly for the next leg1-4 : lower highs and lows
4: a dip under the lowes low in the local structure ,
followed by a pullback, then a confirmation STRONG volitle
push back below the buyers from #2, for me the candle closing
down here signals buyers have interest
* what do I think will happen
* notice : RSI + MFI , making a sort of triangle shape, this is good
for signaling a turn in the market, not to mention oversold almost
on both.
* according to the chaos theory indicator , over the past 2,500 bars, if a bar closed
under a zone, we have a 65% chance to reach the next zone below, good for us
because the bar did close under the zone
* using these various factors I like the idea of a continuation down trade.
Crude Oil Bearish and Bullish scenarios for the weekCrude Oil can go both directions this week depending on the price we hit in the start of the week.
Patience Patience Patience!!!!

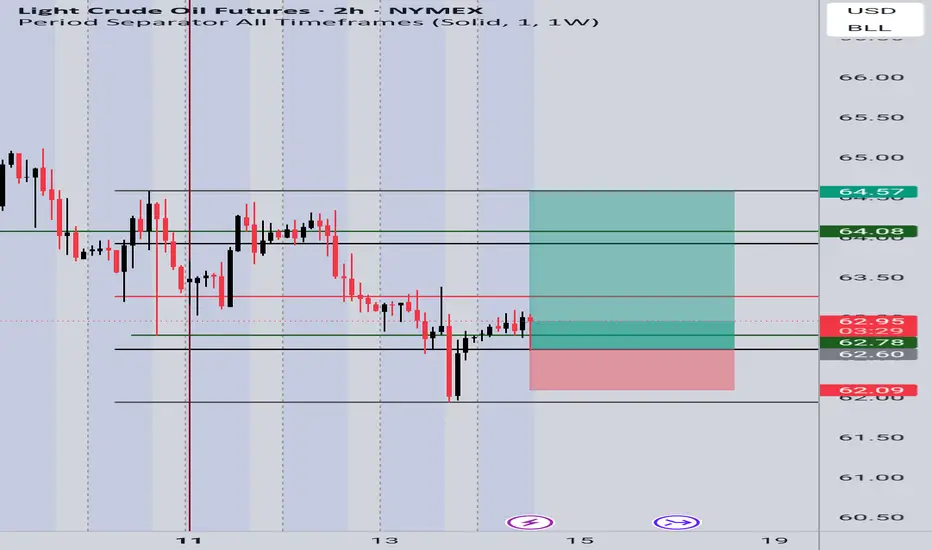
CL1! Long Setup – Recovery BounceBias: Bullish
Reasoning:
Demand zone respected – Price reacted strongly from the 62.00 – 62.20 support zone, forming a bullish rejection wick.
Liquidity sweep – The recent dip below support grabbed liquidity before reversing upward, signaling possible continuation.
Higher timeframe confluence – On the daily, crude oil remains in a broader accumulation phase with buyers stepping in at key support.
Risk-to-Reward setup – Entry near 62.70 – 62.90, targeting higher resistance zones, gives a favorable R:R.
Entry: 62.70 – 62.90
Stop Loss (SL): 62.00 (below liquidity sweep)
Target 1 (TP1): 64.08
Target 2 (TP2): 64.57
📈 Plan: Looking for price to push higher as long as it holds above 62.00 support.
return to solid sellers inspires immediate =SELL market order
**1→3 Movement:** We've carved out a spicy lower low that absolutely demolished the buyers from that 2→3 upswing 💀. This makes the sellers from numero uno the absolute CHAD entity in this local structure 💪
**4→5 Action:** Sellers came back virtually unchecked (like they owned the place 😎) until they hit that overlapping resistance zone where both highs 1 and 3 are chilling together like old friends 🤝
### What's the Vibe? 🔮
* **Continuation Theory:** We're probably heading down faster than my portfolio in 2022 📉. Those previous upswings (2→3 and that tiny pump before high 1) were equally one-sided and still got absolutely rekt. No reason to think this time hits different 🎯
* **Elliott Wave Gang:** This could be that legendary 5th wave finale 🌊, setting us up for a classic 3-wave correction. (Counting that pre-number-1 uptrend as wave 1 because we're sophisticated like that 🧐)
* **Dow Theory Confirmation:** We're surfing a downtrend with a potential kiss goodbye at resistance 💋. Higher timeframes are aligned like planets in retrograde ✨
* **Divergence Party:** Hidden bearish divergence across RSI, MFI, and A/D indicators 📊 - the triple threat confirmation we love to see 🎪
### Chaos Theory Stats (Because We're Built Different) 🌪️
* **64% Probability:** If price closes below a zone, there's a 64% chance it'll hit the next zone down. That's better than a coinflip, and we'll take those odds all day 🎲
* **Breakeven Placement:** Strategically positioned because if price returns to the zone above after hitting BE, we've got a 75% chance of revisiting entry (and nobody likes giving back profits) 💸
* **Zone Selection:** Next orange zone below is the target because we're methodical like that 🎯
* **Data Backing:** These stats are from the last 2,500 bars - not some random hopium, actual backtested edge 📈
**Trade Invalid:** If price closes above that orange zone lurking below this text ⚠️
---
*Not financial advice, just one trader's vibe check on the markets* 🚀💀
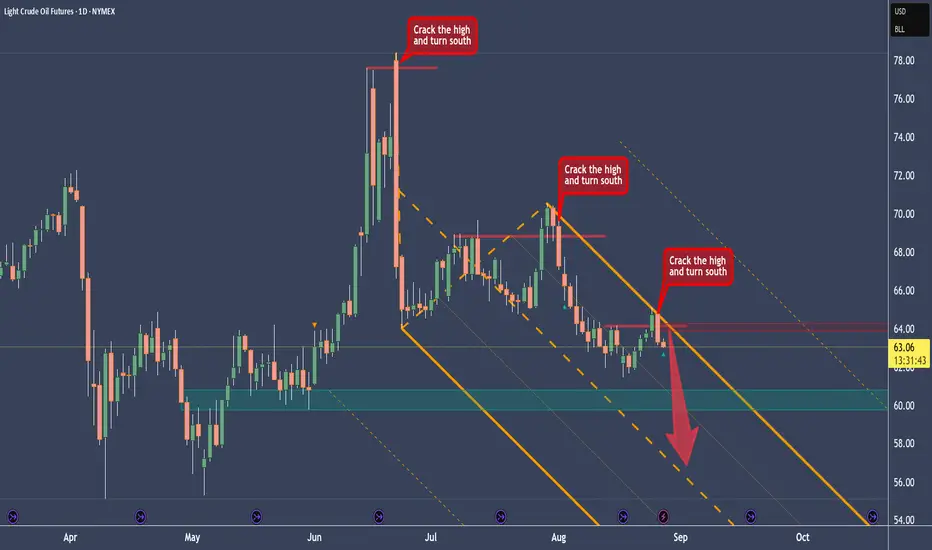
Crude Oil Short After Finding A Recurring BehaviorAfter I cleared the CL chart, I immediately saw a behavior that we can use for a setup right now.
You see that the highs got cracked, and then immediately price turns to the south. And since we are in a downtrend on Crude, we have a legit Short-Trade at hand.
With the modified Shiff-Fork you see how nice CL is reacting at the U-MLH, where it get's rejected. This level also coincides with the crack level.
I personally would love a pullback up to the crack-zone before shorting it. Maybe the trading Gods give us a gift on this Wednesday.
Talking about Wednesday: today we get the Crude Oil EIA numbers, which will probably move the markets.
However you plan is if you trade it, don't have FOMO. There are many more trades to come in your trading career.
Have a happy hump day §8-)
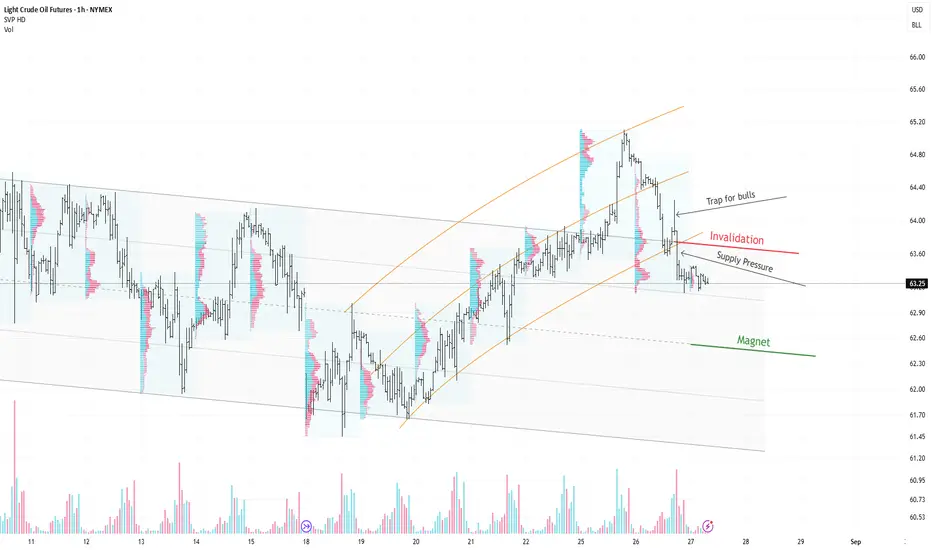
CL1! — Bearish: back inside the descending channel, watching theThesis (1h):
Price had been sliding within a broad descending channel (grey). The counter-trend recovery shaped a rising channel (orange). Yesterday’s attempt to resume the advance from the lower orange boundary failed and turned into a bull trap; sellers pushed price back inside the grey channel. Bears confirmed control at the red line (resistance/retest).
Map:
Clear supply pressure after the failed bounce.
While price stays below the red line, the base case is a drift toward the channel median (the “magnet”).
A momentum extension could target the lower band later; not the main case yet.
Invalidation:
Sustained acceptance back above the red line and into the orange channel would neutralize the bearish read.
Educational only. Not financial advice.
Lower Highs Signal Weakness: Crude Oil Bears Eye $61 Support
The recent attempt to rally stalled around $65–66, failing to break above the mid-Bollinger band resistance.
Multiple long upper wicks show selling pressure on rallies.
Price is moving closer to the lower band after failing to hold above the middle band.
The market shows weak upside momentum and dominant selling pressure.
As long as price stays below $65.50, bears maintain control.
If $61.00 support breaks, downside targets are $59.00, then $57.00.

WTI Crude Oil Price Weekly Forecast: Recovery Above $63 SupporteTrend: Upward correction within long-term channel
Current Price: 63.53
⸻
Bullish Scenario
• Entry: BUY STOP 65.70
• Targets: 69.80
• Stop-Loss: 64.00
Bearish Scenario
• Entry: SELL STOP 63.00
• Targets: 57.80
• Stop-Loss: 65.00
⸻
Key Levels
• Resistance: 65.70, 69.80
• Support: 63.00, 57.80
⸻
Indicators
• Alligator: fast EMAs below signal line, sell signal weakens
• AO Histogram: corrective growth, still negative zone
• Trend: testing support of ascending channel (82.00–66.00), recovery potential above $63
⸻
📌 Holding above $63 keeps bullish momentum alive toward $65.70–69.80. A break below $63 opens deeper correction to $57.80.

Crude oil: Sell around 65.00, target 63.00-60.00Crude Oil Market Analysis:
Investors have been confused over the past two days. Why has the price started to rise, if not bearish? The daily chart shows it's not rising, but merely a technical rebound. Today, short positions around 65.00 are acceptable. Crude oil's short-term selling trend is unlikely to change, and rebounds are selling opportunities. Crude oil faces resistance at 65.00 and 67.00, and the 30-day moving average on the daily chart is also holding near 65.00.
Fundamental Analysis:
Market fundamentals are ever-changing. While we can manage large fluctuations during data releases, we cannot avoid sudden fundamental fluctuations. Therefore, every trade should be executed with a strict stop-loss.
Trading Recommendations:
Crude oil: Sell around 65.00, target 63.00-60.00

CRUDEOIL1! breakout + support confirmation=potential upside move4-Hour Chart Update: CRUDEOIL1!
CRUDEOIL1! has retested the breakout zone at 5580–5600.
If this level sustains, we may see higher prices ahead in CRUDEOIL1!.
Thank you!
Oil bearish below 70.00Oil is bearish below 70.00; it trades below its falling trendline, 200, 50, and 20 SMA.
The price recently recovered from the 61.50 low but ran into resistance at 64.50, the 20 SMA.
Sellers will look to take out support at 61.50 and 60.00 to extend losses towards 55.50, the 2025 low.
Should bulls break above the 20 SMA and 65.00 round number, this opens the door to 67.50 the 200 SMA. A rise above 70.00 creates a higher high.
FC
