Gold | Oil | Dollar | Silver | Natural Gas Price ForecastGold | Oil | Dollar | Silver | Natural Gas Price Forecast
COMEX:GC1! COMEX:SI1! AMEX:UNG NYMEX:CL1!
NGF2032 trade ideas

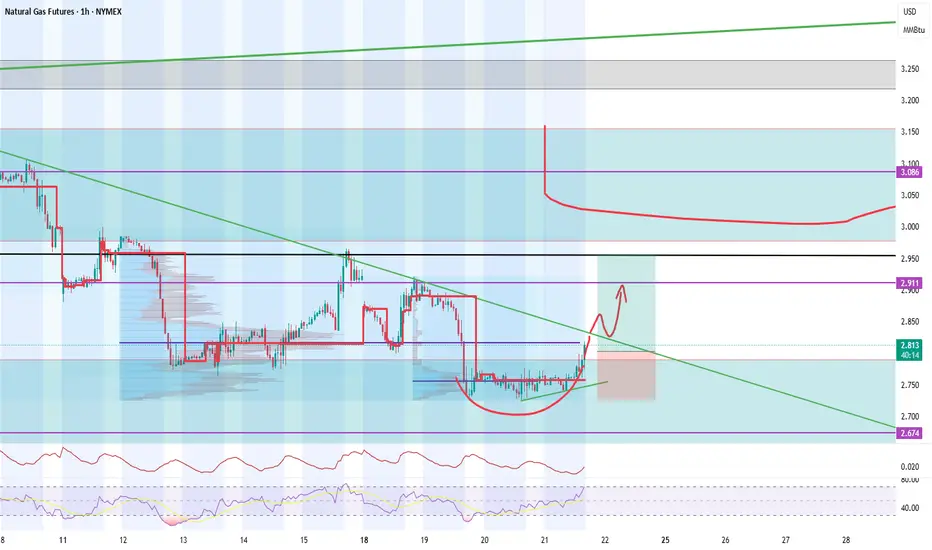
NATGAS - Potential UPI notice a support with a potential accumulation patter for a new phase UP until 3$
NATGAS Trading Opportunity! SELL!
My dear subscribers,
My technical analysis for NATGASis below:
The price is coiling around a solid key level - 2.923
Bias - Bearish
Technical Indicators: Pivot Points Low anticipates a potential price reversal.
Super trend shows a clear sell, giving a perfect indicators' convergence.
Goal - 2.845
About Used Indicators:
By the very nature of the supertrend indicator, it offers firm support and resistance levels for traders to enter and exit trades. Additionally, it also provides signals for setting stop losses
Disclosure: I am part of Trade Nation's Influencer program and receive a monthly fee for using their TradingView charts in my analysis.
———————————
WISH YOU ALL LUCK

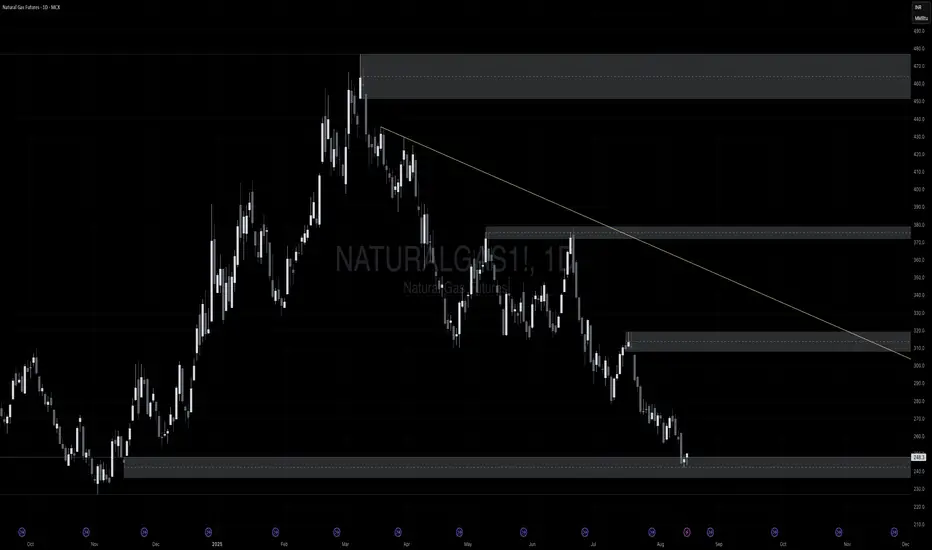
2.20 or 2.24This channel is not providing individualized trading or investment advice, nor is it a banking service, brokerage service, trading service, investment service or money management service

NATGAS: Expecting Bullish Movement! Here is Why:
The charts are full of distraction, disturbance and are a graveyard of fear and greed which shall not cloud our judgement on the current state of affairs in the NATGAS pair price action which suggests a high likelihood of a coming move up.
Disclosure: I am part of Trade Nation's Influencer program and receive a monthly fee for using their TradingView charts in my analysis.
❤️ Please, support our work with like & comment! ❤️
NG1!: Target Is Down! Short!
My dear friends,
Today we will analyse NG1! together☺️
The in-trend continuation seems likely as the current long-term trend appears to be strong, and price is holding below a key level of 2.924 So a bearish continuation seems plausible, targeting the next low. We should enter on confirmation, and place a stop-loss beyond the recent swing level.
❤️Sending you lots of Love and Hugs❤️
NG NG looks promising for the ride to 0.786 and then to turn back with much more promising long setup.
NATGAS Swing Short! Sell!
Hello,Traders!
NATGAS made a bearish
Breakout of the key horizontal
Level of 2.895$ while trading
In a downtrend so we are
Bearish biased and we will
Be expecting a further
Bearish continuation
Sell!
Comment and subscribe to help us grow!
Check out other forecasts below too!
Disclosure: I am part of Trade Nation's Influencer program and receive a monthly fee for using their TradingView charts in my analysis.

Gold | Oil | Dollar | Silver | Natural Gas Price ForecastGold | Oil | Dollar | Silver | Natural Gas Price Forecast
NYMEX:NG1! NYMEX:CL1! COMEX:GC1! COMEX:SI1!

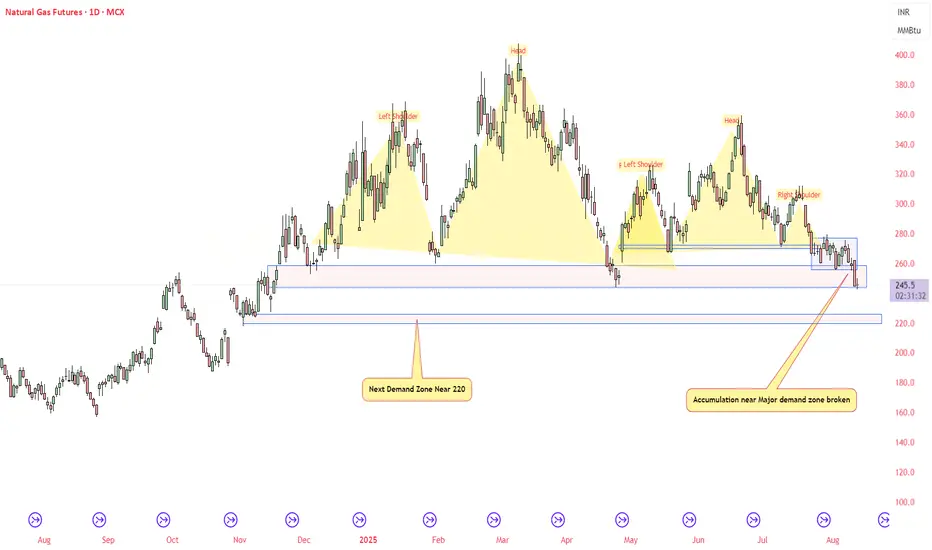
NATURAL GAS - Head and Shoulder PatternNatural Gas being in slow demand may see more bearishness near 220, fresh accumulation near major demand zone broken.
Do your own study before taking any trades
NATGAS BEARISH BREAKOUT|SHORT|
✅NATGAS is going down currently
As the price broke the key structure level of 2.90$
Which is now a resistance, and after the pullback
And retest, I think the price will go further down
SHORT🔥
✅Like and subscribe to never miss a new idea!✅

NATGAS The Target Is UP! BUY!
My dear friends,
Please, find my technical outlook for NATGAS below:
The price is coiling around a solid key level - 2.996
Bias - Bullish
Technical Indicators: Pivot Points Low anticipates a potential price reversal.
Super trend shows a clear buy, giving a perfect indicators' convergence.
Goal - 3.032
Safe Stop Loss - 2.978
About Used Indicators:
The pivot point itself is simply the average of the high, low and closing prices from the previous trading day.
Disclosure: I am part of Trade Nation's Influencer program and receive a monthly fee for using their TradingView charts in my analysis.
———————————
WISH YOU ALL LUCK
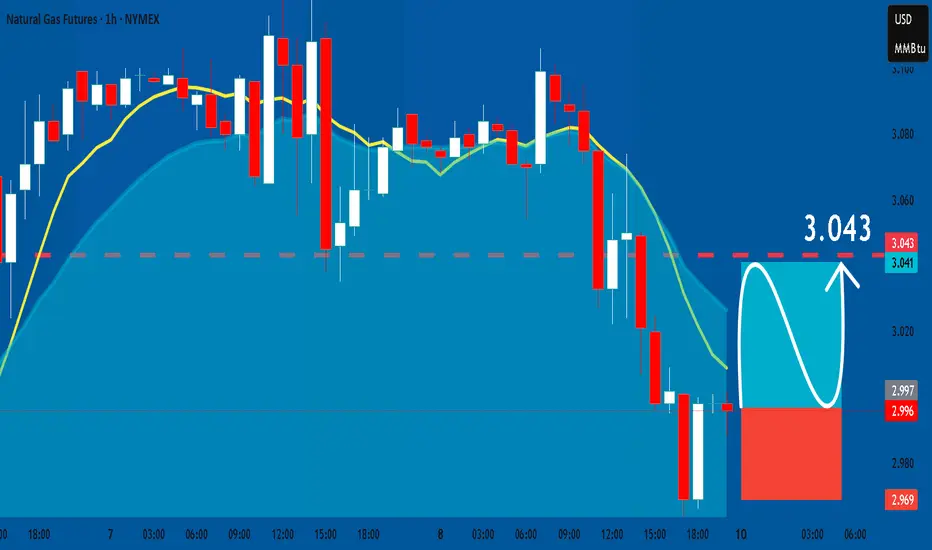
NG1! BUYERS WILL DOMINATE THE MARKET|LONG
NG1! SIGNAL
Trade Direction: long
Entry Level: 2.996
Target Level: 3.043
Stop Loss: 2.964
RISK PROFILE
Risk level: medium
Suggested risk: 1%
Timeframe: 1h
Disclosure: I am part of Trade Nation's Influencer program and receive a monthly fee for using their TradingView charts in my analysis.
✅LIKE AND COMMENT MY IDEAS✅

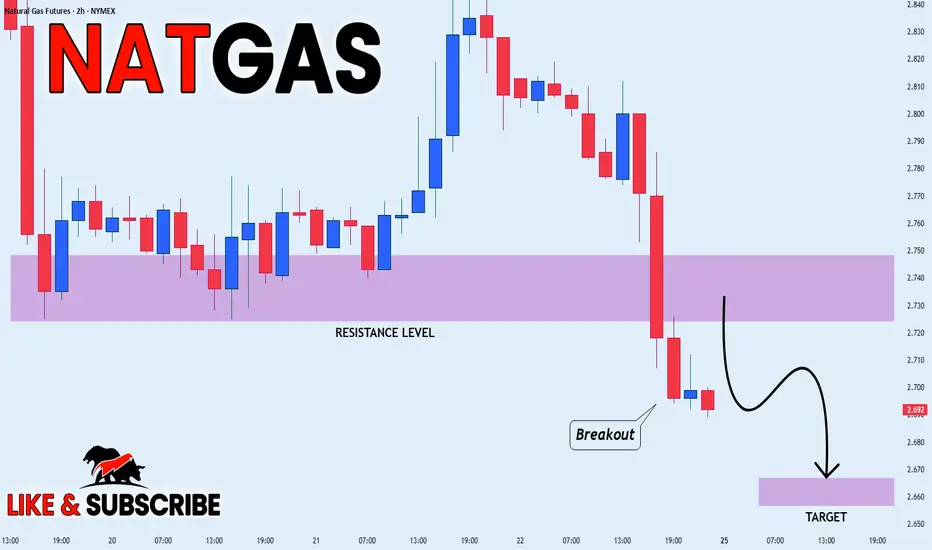
NATGAS WILL KEEP FALLING|SHORT|
✅NATGAS is going down currently
As the Gas broke the key structure level of 2.73$
Which is now a resistance, and after the pullback
And retest, I think the price will go further down
SHORT🔥
✅Like and subscribe to never miss a new idea!✅
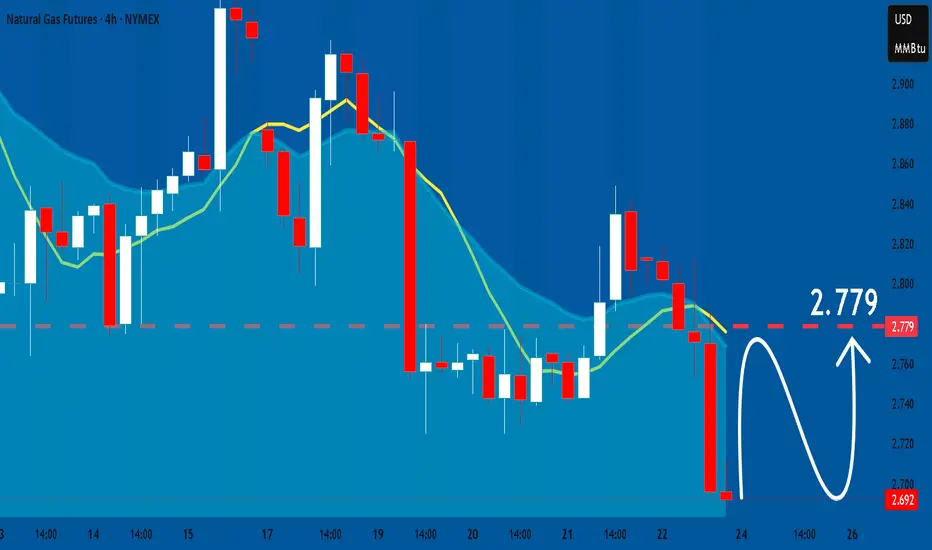
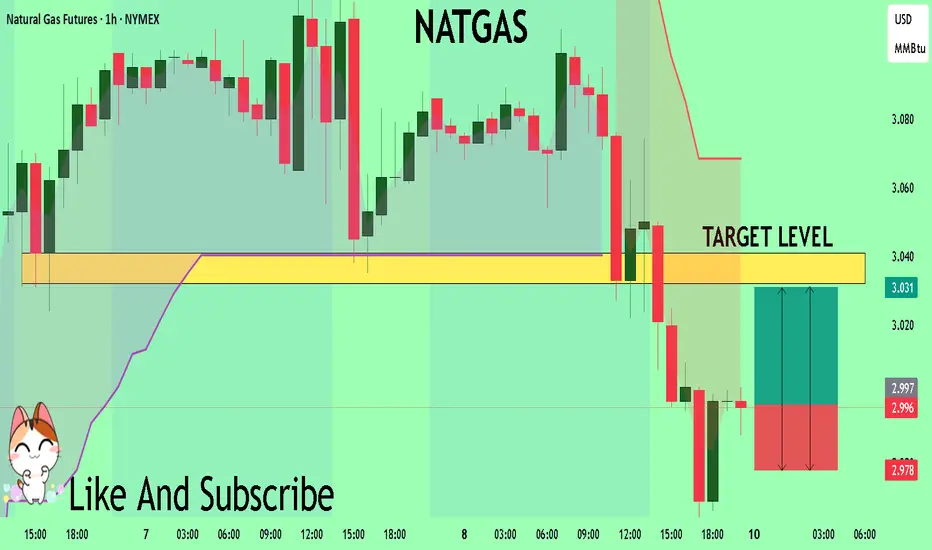
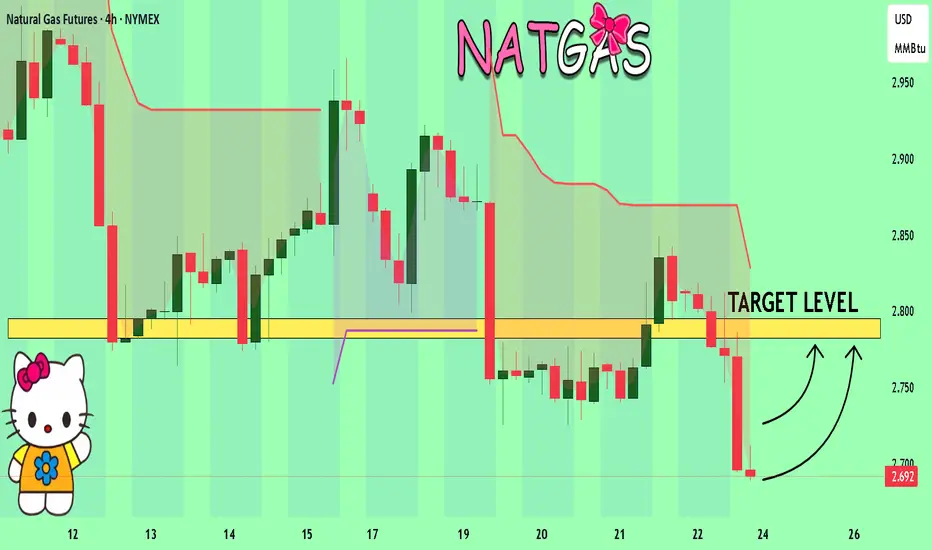
NATGAS What Next? BUY!
My dear friends,
Please, find my technical outlook for NATGAS below:
The price is coiling around a solid key level - 2.692
Bias - Bullish
Technical Indicators: Pivot Points Low anticipates a potential price reversal.
Super trend shows a clear buy, giving a perfect indicators' convergence.
Goal -2.782
About Used Indicators:
The pivot point itself is simply the average of the high, low and closing prices from the previous trading day.
Disclosure: I am part of Trade Nation's Influencer program and receive a monthly fee for using their TradingView charts in my analysis.
———————————
WISH YOU ALL LUCK
NG1!: Bulls Are Winning! Long!
My dear friends,
Today we will analyse NG1! together☺️
The in-trend continuation seems likely as the current long-term trend appears to be strong, and price is holding above a key level of 2.696 So a bullish continuation seems plausible, targeting the next high. We should enter on confirmation, and place a stop-loss beyond the recent swing level.
❤️Sending you lots of Love and Hugs❤️

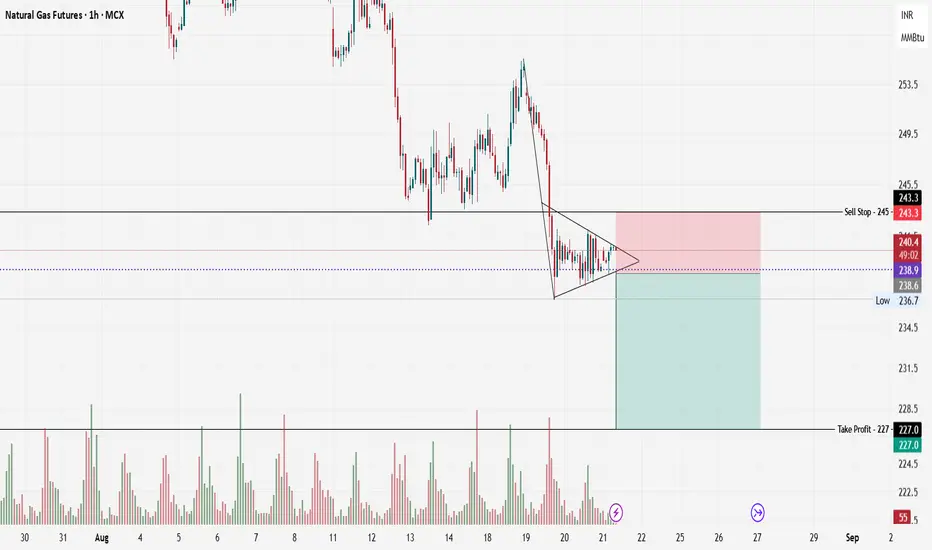
Natural Gas Pattern Trade - 21st Aug., 2025
Here is my Natural Gas Futures (MCX, 1H) chart classic—candlesticks analysis.
Pattern Identification: The Bearish Pennant
I’ve spotted a textbook bearish pennant. Here’s how it forms and functions:
The pattern starts with a pronounced downward thrust (the flagpole), reflecting strong selling momentum.
Price action then contracts into a symmetrical triangle, as shown by the converging trend lines.
This pennant shape is a market’s “pause”: sellers digest gains, buyers offer token support, but neither side has control—for now.
The expectation “by the book” is that this pattern serves as a continuation formation, where a breakout (typically downward, in line with the preceding move) resumes the established trend.
Pattern Validation & Invalidation
Validation Criteria
Clear Downtrend: The initial flagpole is rapid and steep, matching textbook requirements.
Symmetrical Contraction: Multiple touches on both trendlines without breaking out show healthy consolidation.
Volume Confirmation: Notice how volume spikes before the consolidation, then diminishes as the pennant forms—a classic and critical signal. Lower volume during consolidation signifies indecision; a surge in volume on breakout validates the move.
Defined Risk/Reward: Levels for stop loss and target are clear and logical, anchored to visible support/resistance.
Invalidation Criteria
False Breakouts: If price breaks above the pennant’s upper boundary and sustains, the pattern is invalid.
Volume Anomaly: A breakout without accompanying volume suggests the move may not be trustworthy.
Failure to Breakout: Prolonged sideways action beyond the pennant’s apex reduces the pattern’s predictive value.
Capitalizing on the Analysis
If I want to turn this analytical insight into a trading opportunity, I’ll approach it methodically:
Wait for Confirmation: Act on the trade only when price closes below the lower trendline, and I’d like to see a volume spike to validate the breakout.
Set Entry and Risk: I position an entry order (sell stop) just below the pattern, around ₹238.6–₹240.
Define Stop Loss: I place my stop loss slightly above the upper pennant boundary—just above ₹243.3—to safeguard against failed breakdowns.
Calculate Target: My target is derived from the measured move principle—project the flagpole’s length from the breakout point, which centres the take profit around ₹227.
Size the Trade: I ensure my trade size aligns with my risk tolerance, strictly following capital management principles.
By systematically applying these rules, I aim to capitalize on the high-probability move that often follows a valid bearish pennant pattern.
NG1!: Strong Bullish Sentiment! Long!
My dear friends,
Today we will analyse NG1!together☺️
The price is near a wide key level
and the pair is approaching a significant decision level of 3.016 Therefore, a strong bullish reaction here could determine the next move up.We will watch for a confirmation candle, and then target the next key level of 3.051.Recommend Stop-loss is beyond the current level.
❤️Sending you lots of Love and Hugs❤️
NATGAS: Bullish Continuation & Long Signal
NATGAS
- Classic bullish pattern
- Our team expects retracement
SUGGESTED TRADE:
Swing Trade
Buy NATGAS
Entry - 2.996
Stop - 2.969
Take - 3.043
Our Risk - 1%
Start protection of your profits from lower levels
Disclosure: I am part of Trade Nation's Influencer program and receive a monthly fee for using their TradingView charts in my analysis.
❤️ Please, support our work with like & comment! ❤️
NATURALGAS TRENDLINE BREAKOUT OR FAKEOUT?Timeframe: 1H Breakout Watch 🚀
Technical Overview:
Natural Gas is testing key horizontal resistance around 272 after multiple rejections. Price is holding above 25 EMA and 55 EMA, showing short-term bullish momentum.
Key Levels to Watch:
• Resistance: 272 – 274
• Breakout Target: 278 – 280 (if sustained above 274)
• Support: 266 – 264 zone
Trade Idea:
• Bullish Scenario: Break and hold above 274 → Upside potential toward 278 – 280.
• Bearish Scenario: Rejection at resistance → Pullback toward 266.
Bias: Bullish if 272 holds as support post-breakout.
📊 Pattern: Range breakout attempt with potential 2.7% upside.
#NaturalGas #MCX #Commodities #PriceAction #Breakout #PowerCommodityTrading

Natural Gas Slips Below Support – More Downside Ahead ?
Recent candles are large-bodied bearish candles, indicating strong selling pressure.
Bollinger Basis is sloping downward, showing short-term bearish momentum.
Price is currently below both the 20-day and 50-day moving averages, reinforcing the bearish outlook.

Natural Gas Futures Signal Breakdown Below Mid-Band Support
The most recent candle closed below the middle Bollinger Band (20 SMA), indicating potential downside momentum.
The price recently spiked toward the upper band (~$4.20) but was strongly rejected, creating a bearish reversal pattern.
Volume has been increasing on down days, especially the last few sessions, suggesting institutional selling pressure.
