BE Sell SignalHead and Shoulders structure complete, probably signaling a top. Good opportunity to enter a short position at this level.
Market insights

Bloom Energy. Is it a memestock and is it about to blow up in spectacular fashion?!
Granted it's not a pure meme with no real Business; it has real tech, revenue and a credible long term-value theme.
But the stock is trading with meme like valuation, with flow driven volatility, and sentiment.
That is why this Head and shoulders demands respecting (until invalidated ofc)
I believe risk/reward is more speculative than fundamental.

BE Weekly Put Play: Capitalizing on Bearish Momentum BE Weekly Signal Summary
Instrument: BE
Direction: BUY PUTS
Confidence: 65%
Expiry: 2025-12-19 (7 days)
Strike Focus: $90.00
Entry Range: $4.80–$5.50 (mid: $5.15)
Target 1: $7.73 (50% gain)
Target 2: $10.30 (100% gain)
Stop Loss: $3.09 (40% loss)
Position Size: 2% of portfolio (moderate risk due to Katy conflict and Friday expiration)
Weekly Momentum: BEARISH (-8.80% 1W)
Options Flow: Bearish (PCR 1.31, institutional put accumulation)
Analysis Summary
Katy AI Signal: NEUTRAL (50% confidence) with upward trajectory to $103.61 — conflict detected.
Technical Analysis:
Strong daily decline (-14.25%), below VWAP $103.73
Resistance: $112.63, support: $94.24
Multi-week downtrend confirms bearish bias
News Sentiment: Light, neutral; no major catalysts
Options Flow: Institutional put-heavy positioning; unusual activity at $83 put
Risk Level: HIGH — Friday expiration, gamma risk, and conflict with Katy AI prediction
Trade Rationale
Why PUTS:
Strong technical downtrend and bearish weekly momentum
Institutional options flow (PCR 1.31) supports downside
Risk/reward favorable vs key resistance levels despite AI bullish trajectory
Risk Management:
Conservative strike selection ($90 put, delta -0.342)
Tight stop at $3.09
Position size reduced to 2%
Key Notes
Friday expiration adds gamma risk — consider early exit if targets hit
Monitor for bullish reversal signals due to Katy AI predicted move to $103.61
Scaling out at Target 1 is recommended given conflicting signals

BE Eyes Bullish Momentum: Katy AI Signals Upward TrajectoryInstrument: BE
Signal Type: CALL (LONG)
Direction: BUY CALLS
Confidence: 65% / 60% depending on strike
Conviction Level: MEDIUM
Expiry Date: 2025-12-19 (8 days)
Recommended Strike & Entry:
Strike 104.00 → Entry Price: 7.85
Strike 95.00 → Entry Price: 11.65
Profit Targets:
Strike 104.00 → Target 1: 12.30 | Target 2: 15.10
Strike 95.00 → Target 1: 18.64 | Target 2: 23.30
Stop Loss:
Strike 104.00 → 5.50
Strike 95.00 → 8.16
Position Size:
Strike 104.00 → 2.5% of portfolio
Strike 95.00 → 2% of portfolio
Weekly Momentum:
Strike 104.00 → NEUTRAL (+0.15% 1W)
Strike 95.00 → BULLISH (+2.10% 1W)
Flow Intel / Options Flow:
Strike 104.00 → Bullish (Low P/C Ratio 0.25)
Strike 95.00 → Bearish (High P/C Ratio 1.53), contrarian opportunity
Technical Highlights:
Entry levels below VWAP provide mean reversion upside
Oversold or bounce setups for both strikes
Elevated volume indicates institutional interest
Low gamma environment for directional play
Risk Level: MODERATE – manage position size carefully due to Katy AI’s 50% confidence in neutral trend classification.
Key Notes:
Strike 104.00 aligns with Katy AI upward trajectory and bullish flow
Strike 95.00 is a contrarian play against bearish options flow, but AI predicts clear upward trajectory
Monitor VWAP resistance, intraday price movements, and weekly expiration gamma effects


QuantSignalsV3 BE Bullish Reversal Call: Quick Swing OpportunityInstrument: BE
Trade Type: Weekly Call (BUY)
Strike Price: $94.00
Entry Range: $11.20 – $12.70 (current example: $11.95)
Target 1: $16.80 (≈50% gain)
Target 2: $19.60 (≈75% gain)
Stop Loss: $8.40 (≈25% risk)
Expiry / Horizon: 2 days (to 2025-12-12)
Confidence: 56%
Conviction Level: Low
Risk Level: High – short expiry, volatile, conflicting signals
Momentum / Technical: Oversold after 11% drop, support at $101.88, VWAP resistance at $110.91
Options / Flow: Bearish P/C ratio 1.29, unusual volume at $94 put
News / Sentiment: No major catalysts; industrials sector mixed
Katy Conflict: Weekly guidance recommends PUTS, but Katy AI predicts +10.7% upside to $114.48
Notes:
Very short expiry: time decay is fast.
Conflicting signals reduce conviction: monitor price action closely.
Use only small position size (≈2% of portfolio).

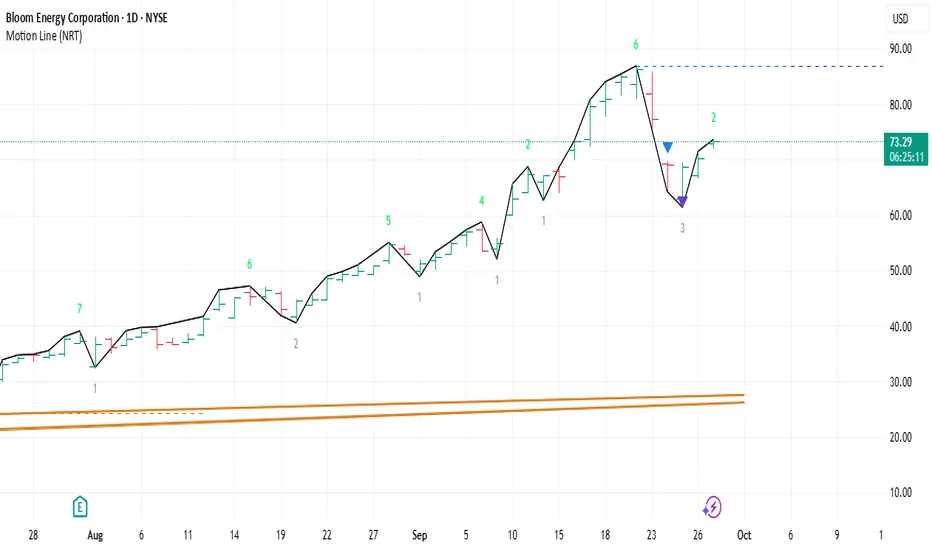
TradeUSAsignals RecommendationsBE - Long (5% of your portfolio) - Order filled @ 72.53
An up trend controlled by Time traders with Bias and Price traders both against the trend witch gives a signal to go long.
Bloom Energy Corporation ($BE) Spike 14% Amidst Earnings Beat The price of Bloom Energy Corporation (NYSE: NYSE:BE ) saw a noteworthy uptick of 14% in early market trading as the asset reported earnings result yesternight after market close.
The stock is gearing a move to the $140 resistant point albeit present market conditions. With the last recorded RSI at 63 NYSE:BE might spike 50% to claim to the $140 resistant
Third Quarter Highlights
Revenue of $519.0 million in the third quarter of 2025, an increase of 57.1% compared to $330.4 million in the third quarter of 2024. Product and service revenue of $442.9 million in the third quarter of 2025, an increase of 55.7% compared to $284.5 million in the third quarter of 2024.
Gross margin of 29.2% in the third quarter of 2025, an increase of 5.4 percentage points compared to 23.8% in the third quarter of 2024; non-GAAP gross margin of 30.4% in the third quarter of 2025, an increase of 5.1 percentage points compared to 25.2% in the third quarter of 2024.
Operating income of $7.8 million in the third quarter of 2025, an improvement of $17.5 million compared to operating loss of $9.7 million in the third quarter of 2024; non-GAAP operating income of $46.2 million in the third quarter of 2025, an increase of $38.1 million compared to $8.1 million in the third quarter of 2024.
$5 billion strategic AI infrastructure partnership with Brookfield Asset Management.

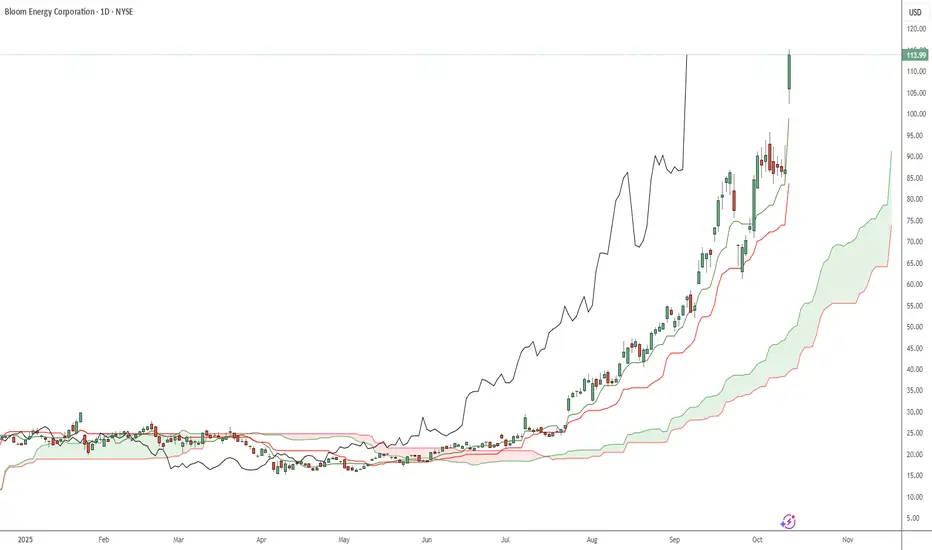
BE: price in important resistance zoneNYSE:BE price is currently trading within an important resistance zone, where a mid-term top formation is likely.
From here, I expect a pullback and consolidation within the 76–56 macro support area before the next potential upside leg toward the 160–190 / 255–310 macro resistance extensions.
Chart (Weekly):
Chart (Macro):

BEBE moves today strongly with +30% . . Luckily, I've been in this trade since 50s so nice profit in percentages- not too much in money terms, but today's volume and trend structure allow me to sit on my hands and wait....
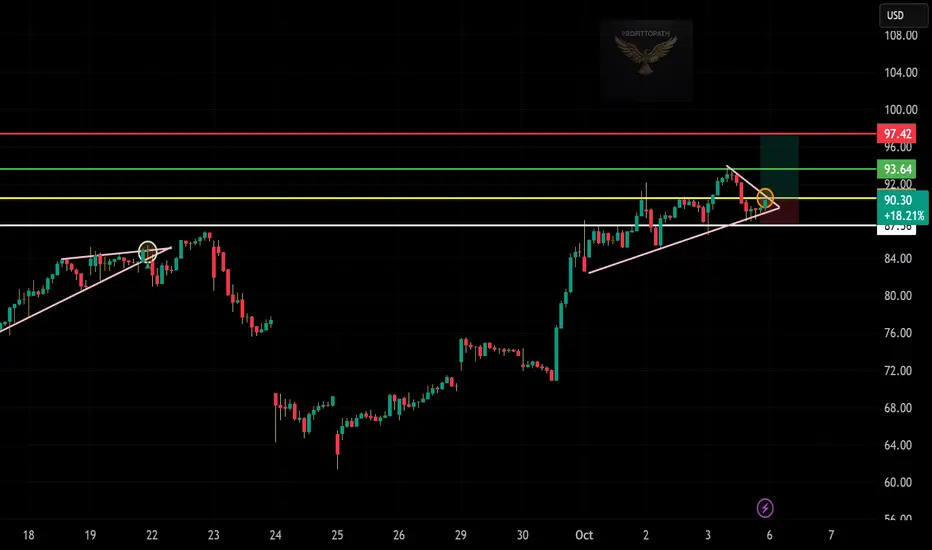
BE – 30M Chart Analysis! 🟢
Price respecting ascending trendline support.
Forming a bullish wedge pattern — possible breakout setup.
Entry zone: around 90.0–90.3 (near wedge support).
Breakout confirmation: above 92.0–93.6 zone.
Target: 97.42
Stop-loss: below 87.56
Risk-Reward Ratio: around 1:2
Bias: Bullish while above the trendline — watch for breakout candle.
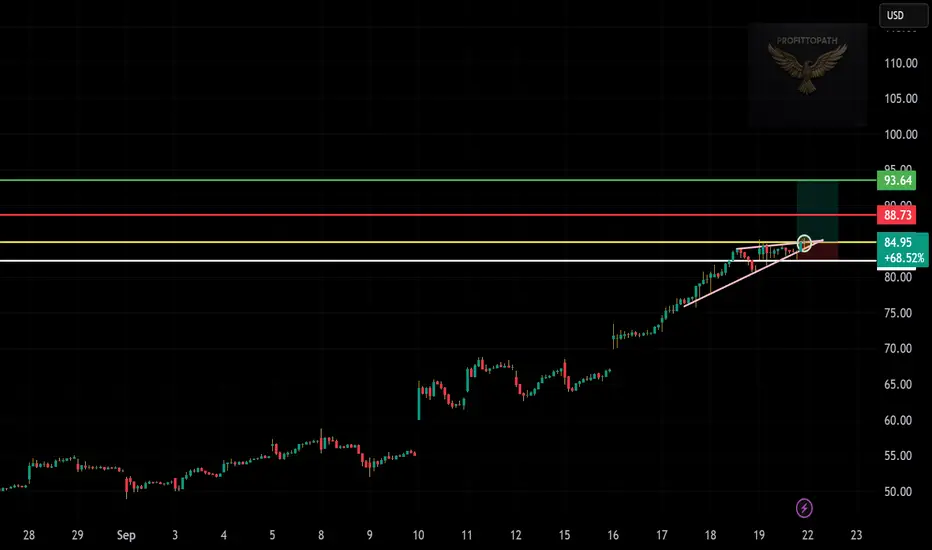
BE – Bullish Continuation Setup Above Support📝 Analysis:
Trend: Strong uptrend, price forming higher highs.
Support: $84.95 (near-term), $80 (trendline zone).
Resistance: $88.73 (first target), $93.64 (second target).
Plan: Stay bullish while above $84.95. If price breaks below, watch $80 as next support.
🎯 Target Zone: $88.73 – $93.64
🛑 Stop Loss: $80
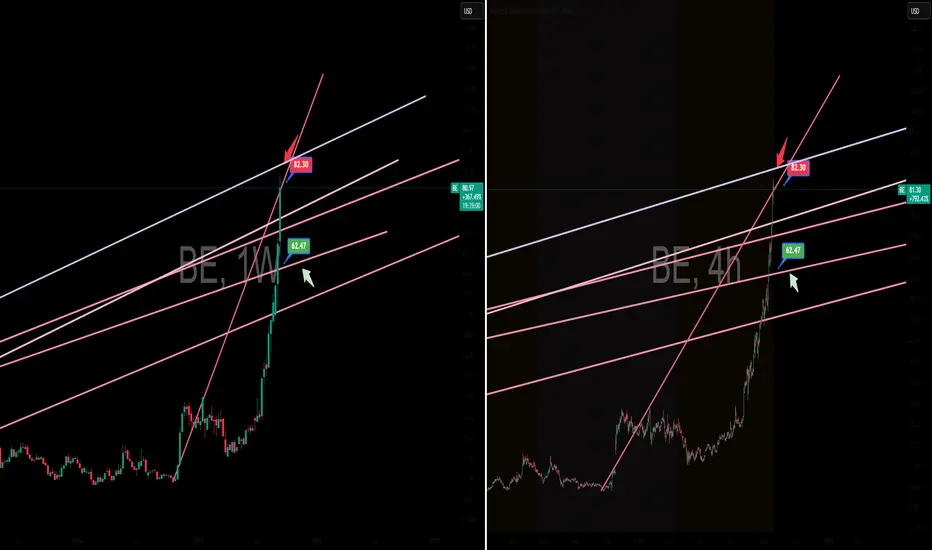
To BE or Not to BE... Short!Rationale & Thesis
This is a technical short trade on Bloom Energy (BE), based on a clear rejection of a key resistance level. The thesis is that the upward momentum has exhausted itself, and the price is now positioned to move toward a significant support zone. This trade aims to capture the downward movement from this confirmed high, following the path of a new downward trend.
he recent price action of BE shows that the stock's rally has met a critical barrier. The price has surged to a major resistance trendline and has been firmly rejected. This rejection is clearly marked by the red arrow on the chart, indicating a high-probability reversal as sellers regain control.
Trade Idea:
Entry Signal: The short position is initiated at the price level of the red arrow, following the validation of resistance.
Exit Strategy: The primary profit target is set at the green support line, located at approximately $56.37.
4-Dimensional Investing: Evolving Beyond News, Charts, and Math 📚 4-Dimensional Investing: Evolving Beyond News, Charts, and Math
Most people start learning about stocks in a 1-dimensional way — by following the news.
But news is noisy.
Some is fake, some is "buy the rumor, sell the fact", and sometimes the price moves the opposite of what the news suggests. So, many give up on news and turn to...
📊 2D: Technical Analysis (TA)
TA has been around since the 1980s, when personal computers went mainstream. It's visual and intuitive — charts, lines, indicators. You see price action unfold on-screen and feel like you're deciphering the market in real time.
Some traders even build entire systems off indicators like RSI, MACD, or moving averages. They think:
"Aha! The chart did this, so next time I’ll do that."
But often, "next time" doesn't work the same.
TA is fundamentally historical — it's about pattern recognition and hoping history repeats.
It’s like counting the color of every fallen leaf, trying to predict the next one.
We needed something better. So the institutions turned to…
🧠 3D: Quantitative Modeling
Enter the quants — physicists, mathematicians, engineers. They model the markets like rocket science using multi-dimensional equations. Think LTCM (Long-Term Capital Management), led by Nobel Prize winners.
Quant models are more sophisticated than charts — they simulate human behavior with precision. But there's a problem: humans change.
A model may work… until people start behaving differently.
Markets are not just math. They’re psychology, emotion, fear, greed.
Which brings us to the new frontier…
🤖 4D: AI-Powered, Language-Driven Investing
This is where LLMs (Large Language Models) enter the game.
People often ask me:
“Why use LLMs for trading? Why not traditional ML like LSTM?”
Here’s my answer: Markets are made of humans, and humans communicate through language.
Not numbers. Not charts. Not just price.
Now, with LLMs, we can:
Analyze any human-created document (news, filings, tweets, speeches)
Understand sentiment in real context
Capture nuance — the stuff traditional models miss
LLMs don’t just convert text to numbers. They learn meaning.
This adds a fourth dimension to our trading models: language + reasoning + context + behavior.
Underneath, it’s still powered by classic ML and deep learning. But now the machine can think more like a human — with intuition, memory, and adaptability.
---
🌐 The Future Is 4D Investing
We're not saying this is the final answer to markets. But it’s a major leap forward.
Trading is one of the hardest prediction problems in the world.
And now we have a tool that bridges the gap between math and human behavior.
Welcome to the era of 4D investing —
Where the future of trading is built with language, context, and AI.
Let’s explore it together in 📖qs-academy. 🚀

Bloom inverse head and shoulderHi guys,
Take all of this with a grain of salt, because I've been terribly wrong on Hydrogen - but, I'm seeing what looks like inverse head and shoulder forming in Bloom, with a landing on top of a prior resistance level. As far as I'm concerned, this ticker, regardless of what it is, is ready to fly into new all time highs, and i have targets for an inverse right leg into fresh highs - if anyone's interested. It's usually just me talking to myself.

BE Long. If I’m right follow for moreBeautiful consolidation above the MA. Get ready for higher price

Bloom Energy Breakout? 44 looks possible. As long as it closes today above that yellow line, (the old high), it's going higher.
Bloom Energy Corp. engages in the manufacture and installation of a solid oxide fuel-cell based power generation platform. Its product, Bloom Energy Server, converts standard low-pressure natural gas or biogas into electricity through an electrochemical process without combustion. The company was founded by K. R. Sridhar, John Finn, Jim McElroy, Matthias Gottmann, and Dien Nguyen on January 18, 2001, and is headquartered in San Jose, CA.

H5 Day Trade Review! Crushed $BE Trade x2🚀 H5 Day Trade Review
Check out how we absolutely nailed NYSE:BE day trades two days in a row! 👇

BE LongPosted this for my subscribers on Jan 3rd, been on my watchlist since ER since it had HVE and gapped up to break the 3-year-long downtrend. Part of the clean energy & power theme, leader in the hydrogen space. Entered when breaking out of the double inside day and upside reversal shakeout bar, added at DTL breakout. Looking to ride and add more when pulling back to KMA.

$BE - Is BE-ASTING! Free Swing Trade Idea is killing it!NYSE:BE is the next NYSE:OKLO NASDAQ:NNE
March 26 calls up 44% & counting! 🤯
$28 profit target obliterated!!!!💥
Called this trade out for free!
Not financial advice
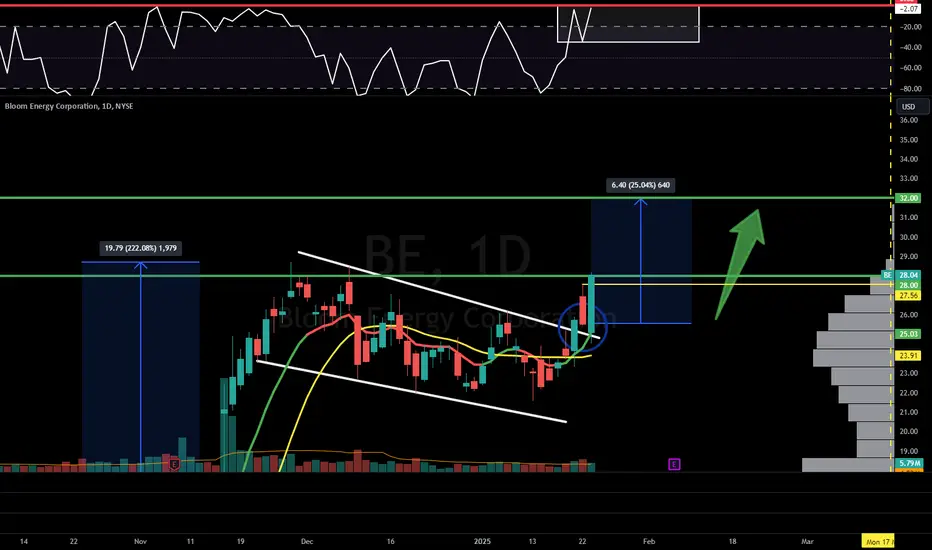
Bloom Energy ($BE) - H5 Swing of the Week!🚨 25% Upside H5 Swing Trade 🚨
NYSE:BE ran for over 200%, got some rest and is now breaking out!
Energy is hot right now too.
🎯$28🎯$32
High Risk/ High Reward here!
I'm in on the March $26 Calls.
NOT FINANCIAL ADVICE!

Parabolic RiseIt is not only the fast parabolic rise that makes me worry but also the very strong resistance here. A correction seems to be due.
But I don't see a sign of a declne yet. Thus I will open a small position only.

New Setup: BEBE : I have a swing trade setup signal. I'm looking to enter long if the stock can manage to CLOSE above the last candle high(BUY). If triggered, I will then place a stop-loss below (SL) and a price target above it(TP-50%,move SL to breakeven), then using the close below the 10SMA as my trailing stop loss. **Note: The above setups will remain valid until the stock CLOSES BELOW my set stop-loss level(3).
