Market insights

DEVON ENERGY CORP long ...DEVON ENERGY CORP long ... The exchange rate moves in a dual wave motion. The ATR (D1) is 1.66 times the previous value. This means that the distance of the exchange rate movement can be greater than 1.66 times the wave (BC) wave period as in the (0A) wave period. This may also have the consequence that the wave (BC) is twice as large as the wave structure (0A). The (BC) wave periodus target price is 56usd.

DVN Detected possible stock repurchase!!!DVN: devon energy corp
2018-03-07 16:12:01
Detected possible stock repurchase


Rising Earnings per Share for Devon EnergyThe Earnings of Devon Energy Corporation started to climb from December 2016 and between August and but only in September of 2017 the stock price started to show a recognizable trending behavior, All this added to a rising Crude Oil Futures is a good argument for add this stock to a portfolio.
Another good quality of this stock is your high beta coefficient (2.65) very high compared with others in this sector.
Earnings per Share:
www.nasdaq.com
My technical point of view here is:
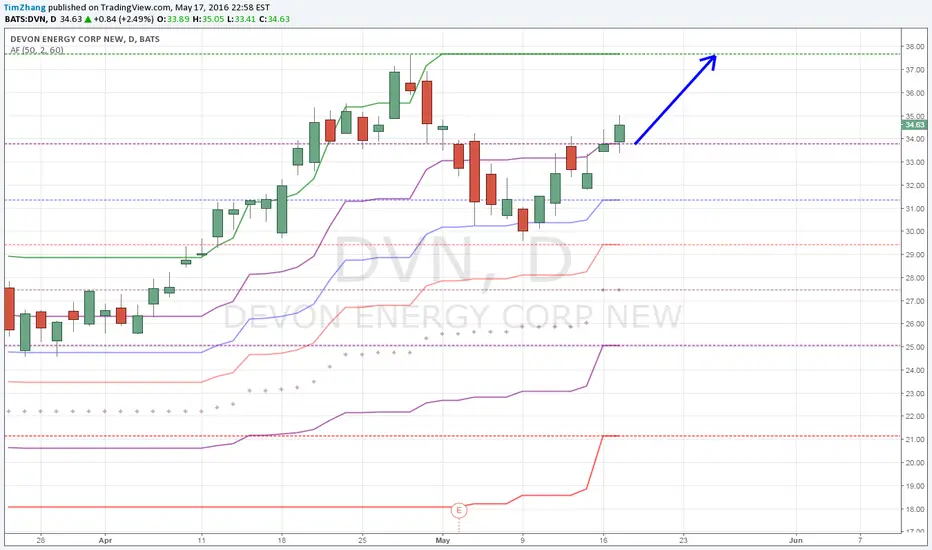
After a down trend movement from December 2016 to July 2017 I can appreciate now how the price is making new higher highs and higher lows and for identify this I only place some support and resistance lines around some key levels 34.20 the most recent place the 37.30.
And now in the present is easy to identify a resistance breakout with your respective pullback in the 37.30 area. This is a good point to entry here in the now but it remains to be know what will happen in the future with that line of resistance around the level of 50.00 for a speculative trade looks good if the price target is 50.00 and if the price reach that level close the trade and bye. But for a long term investing (Years) I do not know because Technical Analysis can not gimme with accuracy what will happen in the future.
Like Ed Seykota say "There is no math to get you out of having to experience uncertainty"
Other way to handle this trade is to make the decision to close or hold in the future based on how the price behaves when it reaches that level and watch over the position like a hawk
For more details look the daily chart
www.tradingview.com
Opinions are for educational purposes. I am not licensed to provide investment advice but I try than my opinions looks the more realistic way.

DVN is in a rising wave structure...DVN is in a rising wave structure. Currently, it is a breakthrough of 40.85 usd correction levels. The next adjustment level is 44.26 usd. This is a quarter of a wave size. Here, we assume an equal size correction. Thereafter, a total wavelength increase of $ 46.67 will be used. The ATR axes (purple line) are sufficiently sloping to form a definite wave motion.


Earnings Flag Breakout?DVN previously has produced a head and shoulders patterns, hence the decrease in stock price for the long period. But, recently the stock broke out of its flag pattern and it is also earning report day for DVN today. So, there is an opportunity. I have put the Long order at the next fibonacci level, as that will provide support and resistance. The Long take-profit is till the 50 MA. The Short order is until the next lower fibonacci level.

Long term opportunity on Devon EnergyThe rising wedge was confirmed when it changed $31-59 into a support.
A higher low was also now confirmed at $33-90.
The target of the wedge should it play out is around the 40 week moving average, waiting at $38-36.
Technically the share will warn again when $29-54 changes into a resistance.
Buy: $33-90
Stop loss: $29-54
Target: $38-36

DVN LongSector is currently hot
Stock has daily RSI > 70, and study shows stocks with RSI above 70 will often continue to rise
Volume > 1mio
Price above 5$
Broke consolidation

DVN inverse fractal wave motion...DVN inverse fractal wave motion. The reason for inverse fractal wave movement is the increase in option trading. It is a kind of wave motion whose attribute is that all the falling waves in the past have taken on an equally large but growing wave. The fractal feature is that the corrections in the same places appear in the exchange rate as in the initial fractal in the past, just inverted. But back to the analysis. If the exchange rate continues to move without major market shocks, it will reach 51 usd in approximately 50-60 days. Here, it is worthwhile to make a profit for those who have entered into 28-30 usd and level. Because then, a 13 USD correction is expected, followed by a slip. Then a stronger upward section begins. The figure is a seven-time interval resolution. So that I expect 200 days to start the big rise. However, this stock will be available for 300% in the next three years.
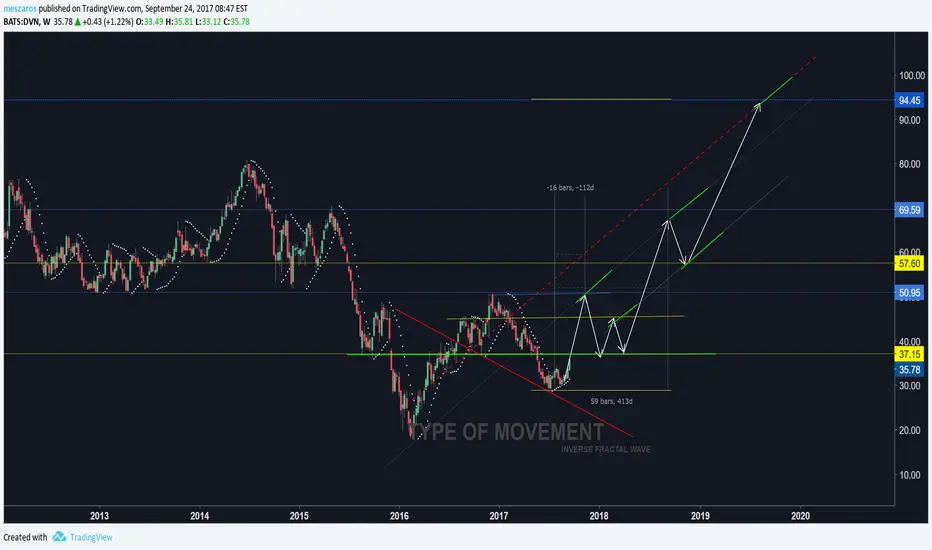
The DVN share price is rising...The DVN share price is rising. In our view, energy prices are slowly increasing. This is followed by the share of oil and processing companies. Technically, the exchange rate is a first-time correction of an upward trend. This is about to end. According to our strategy, USD 31 is already an upward wave rate. If this statement is correct, it can last up to 52.13 usd for the current move. This requires a further waveform, so at this level we expect a $ 39 correction. Then we expect a wave of wave motion to increase to a higher level, for which we expect to reach 67 usd levels. As the increment is expected to be 2 wavelengths, after a further correction, a pre-amplitude wave may raise the exchange rate up to 100 usd levels.

DVNDVN is down in a Bollinger Band so I doubt it is going any kind of retracement on the upside, it looks like it is still heading down. Take a look.

DVN - POTENTIAL BOTTOMSignal of a potential bottom from one of my dBFIs on the weekly chart
Awaiting confirmation (close above sma14).


DVN Long SetupAnother possible setup is for DVN. If I am not mistaken we are in a possible wave 4 which could retest the support line of previous highs. This is possible since US index in on the rise and oil prices can drop accordingly. If so, this can be an oppurtunity to load up with some cheap oil stocks like DVN.

Closed above previous resistanceIt is looking better to get back to $37+ again. There is a gap to $40 last year, this could be filled soon.
$DVN - DailyCould be putting in an Island reversal here on daily above the 1.618 ext and approaching R3 below the 200 MA. Weekly bounce off S2. The ideal short would be at 50.46 which is the 61.8 retracement from the high.
RSI at 76 and CMF is at 85.43 - warrants at least a pull back..
I would buy May $32P's and expect the trade to work within 1-2 days, if not, bail.
