GME AVWAP & recent liquidity injection eventsI have two anchored VWAP signals I check for seeing where individual stocks or etfs are relative to the two most recent liquidity events: COVID QE, and the opening of the "premium window" during the March 2023 regional bank crisis. Strangely I find they both match on GME.
Market insights

$GME - the hype in levelsThese area's of interest are interesting to say the least.
Some support and some some resist but either way.
Just think it should dump to $11.50 cause that would be fun before blasting off up and to the right. .. idk.. though

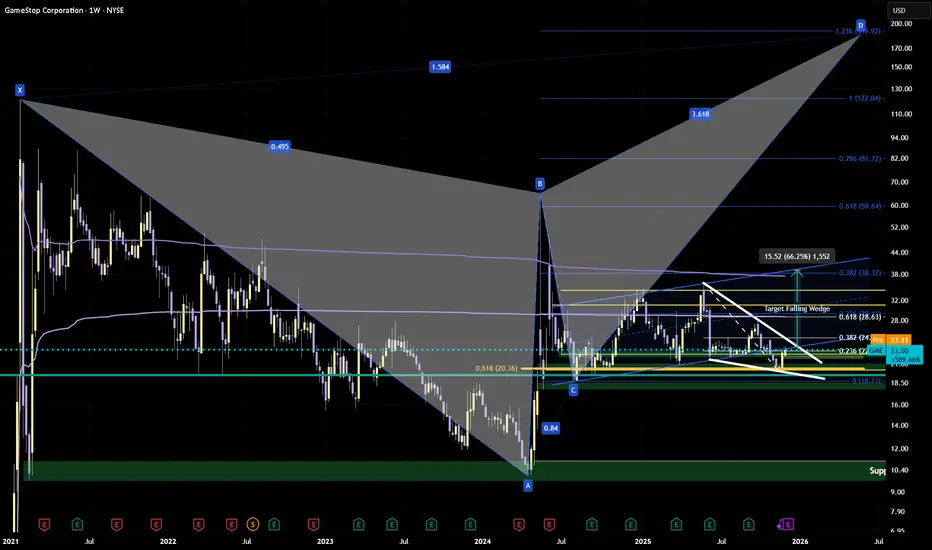
GME: Falling Wedge + Fib area’s + Character loop + Bearish CrabWe're sitting at a juicy confluence right now — the 0.618 fib from the 2024 low-to-high AND the 0.236 from the 2025 high-to-low. When fibs stack, they have my attention.
The Falling Wedge
Classic bullish pattern forming since the end of May: price coiling tighter between converging trendlines.
• First target zone: $28–29 (lines up with the VWAP from the 2020 low)
• Next target: $38 (lines up with the 0.382 Fib and the VWAP from the 2021 high)
Now, will we smash through the 0.236 on the first try? Probably not. GME loves its signature rounding loop before committing to a move, so I wouldn’t be surprised to see some chop here first.
The $20–22 zone has been re-accumulation territory again and again: same support, better structure, and improving fundamentals.
The Bigger Picture: Bearish Crab Harmonic
On the harmonic side, the ABC leg of the big Crab is doing its job as a roadmap. When I flip that same ABC into Fib extensions, the 1.236–1.382 FE band drops right into the larger 1.618 XA D-zone of the Bearish Crab. That whole cluster sits roughly in the $200 area, which is where the full pattern would be expected to exhaust if the Crab completes.
The Roadmap:
Current: $22-23
Wedge breakout: $29-30
Next leg: $38
Extended: $59 → $81 → $122
Harmonic D zone: ~$200
The wedge gives us the catalyst. The harmonic gives us the destination. Let's see how it plays out. NFA. DYOR.
Rejection off MA confirm?One more year down and sideways to major trend?
Will we reverse and break the MA?
Flip a coin, up or down, heads or tails both sides say buy.

GameStop (NYSE: $GME) Posts Strong Q3 Profit Recovery GameStop Corp. (NYSE: GME) reported its third-quarter 2025 financial results, delivering a sharp recovery in profitability despite softer revenues. Net sales came in at $821 million, down from $860.3 million a year earlier, reflecting continued weakness in physical gaming demand and a slower software cycle. However, the company’s internal restructuring efforts significantly improved financial efficiency. SG&A expenses were reduced to $221.4 million, a substantial drop from $282 million, highlighting GameStop’s aggressive cost-cutting strategy.
Operating income rose to $41.3 million, a strong reversal from the prior year’s $33.4 million operating loss. Adjusted operating income also improved to $52.1 million, signaling healthier core operations. Net income jumped to $77.1 million, considerably higher than last year’s $17.4 million, boosted by improved margins and reduced expenses. On an adjusted basis, net income surged to $139.3 million, underscoring the company’s operational momentum.
GameStop ended the quarter with an impressive $8.8 billion in cash, cash equivalents, and marketable securities—nearly double last year’s $4.6 billion. The company also reported $519.4 million worth of Bitcoin holdings, reflecting its continued exposure to digital assets as part of its treasury diversification strategy.
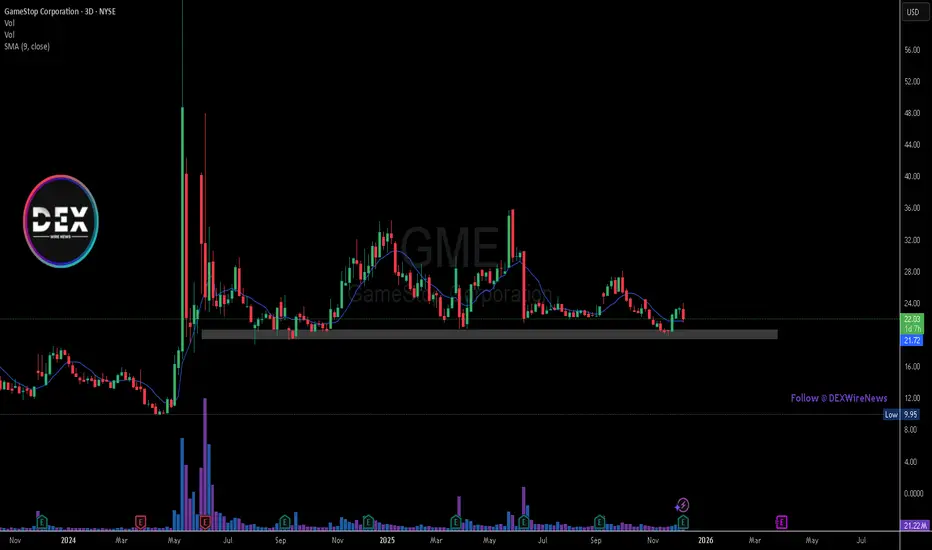
Technical Analysis
From a technical perspective, GME is still consolidating within a long-term support range between $20–$22, an area that has historically acted as a demand zone. Price recently bounced cleanly off this structure, showing early signs of renewed buying interest. A sustained close above $24–$25 could open the door for a move toward $28–$30.
However, failure to hold the support region may expose GME to downside risk toward $15–$16, especially if market conditions weaken. Volume remains subdued, suggesting accumulation rather than speculative momentum. For now, the chart favors cautious bullishness as long as support remains intact.
GME Short-Term PUT Setup — Pre-Earnings Bearish Edge📈 GME Trading Info — Earnings Signal (2025-12-09)
🎯 Trade Direction
BUY PUTS
Confidence: 60% (Medium Conviction)
Risk Level: Moderate — Katy/LLM conflict detected
🔢 Options Setup
Strike: $23.00
Expiry: 2025-12-12 (3 days)
Entry Range: $0.90 – $0.92
Target 1: $1.35 (50% gain)
Target 2: $1.80 (100% gain)
Stop Loss: $0.65 (28% loss)
Position Size: 2% of portfolio
📊 Market Snapshot
Current Price: $23.44
24h Move: +0.59%
Implied Move: $2.27 (9.7%)
IV: 133% (high)
RSI: 82.0 (overbought)
Stochastics: 89.0 (overbought)
PCR: 0.71 (neutral)
🤖 Katy AI vs. LLM Conflict
Katy Prediction: Bearish → -0.97% move to $22.71
LLM Recommendation: Buy Calls
Katy Confidence: 50%
⚠️ Critical: Trade aligns with Katy’s bearish bias despite LLM call recommendation.
📰 Sentiment Overview
Mixed earnings preview: focus on “Ryan Cohen’s No-Hype Turnaround”
Overbought technicals suggest downside potential
Neutral options flow; unusual activity at $12 calls (speculative retail)
Institutional flow appears neutral
⚠️ Key Notes
Earnings volatility high — premiums expensive, fast moves expected
Katy AI shows consistent downward pressure (95% of predictions below current price)
Tight stop-loss essential; consider closing early if gains materialize
Low Katy confidence → position size conservative

GameStop bullish momentum fueled by short-cover squeezeCurrent Price: $23.0
Direction: LONG
Confidence Level: 72% (Based on consistent bullish sentiment from X tweets, price action above key EMAs, and supportive technical signals despite low YouTube snippet volume)
Targets:
- T1 = $24.20
- T2 = $25.00
Stop Levels:
- S1 = $22.80
- S2 = $22.60
**Wisdom of Professional Traders:**
Several professional traders are flagging GameStop’s current setup as one that could extend gains in the short term. The collective trader analysis emphasizes price strength above the 20-day and 50-day EMAs, combined with a MACD in positive territory, as signs the rally is intact. By pooling insights from multiple traders who watch these levels closely, a clear bullish bias emerges on the weekly timeframe.
**Key Insights:**
The main thing I’m watching is the technical alignment: price at $23.0 sits comfortably above the $22.80 and $22.30 EMA supports, and RSI at 62 signals room to run before hitting overbought territory. Twitter sentiment over the past 24 hours has swung notably bullish, with 7 out of 12 trading-relevant posts pointing to continued upside. The short interest remains elevated above 13%, which adds squeeze potential if momentum holds.
Here’s where it gets interesting—resistance zones at $24.20 and $25.00 have been mentioned repeatedly by traders as near-term breakout points. Volume is moderately high but not extreme, suggesting this move isn’t just retail frenzy but is supported by steady buying. This technical picture favors a pull-back entry to around $22.80, giving traders strong risk-reward into the target zones.
**Recent Performance:**
Over the last session, GameStop climbed 3.4% to close at $23.45 before settling around $23.0 in after-hours. The rally came on the heels of both an analyst upgrade to “Buy” and a surprise AI gaming platform announcement, pushing price through minor resistance. This capped off a week of substantial gains, including a sharp move higher after a temporary trading halt.
**Expert Analysis:**
Multiple traders I track have highlighted the clean chart structure: moving averages pulling up, MACD positive, and price consolidating just below minor resistance. There’s agreement that as long as $22.80 holds, bulls will maintain control for the week. Several pointed out that a move through $24.20 could quickly extend to $25, given thin overhead supply in that zone.
**News Impact:**
The recent AI gaming platform news acts as a mid-term growth driver, but in the immediate term, the “Buy” upgrade has been the catalyst for traders piling in. Short-interest data released last week showed significant positioning against GME, which has fueled the current squeeze. Regulatory halts remain a risk factor, but trader sentiment suggests more upside before any enforced cooldown.
**Trading Recommendation:**
Here’s my take—entering long on any dips toward $22.80 with a stop just below $22.60 offers a favorable setup. First target at $24.20 aligns with near-term resistance, and a secondary target at $25.00 captures the potential continuation of this squeeze over the next 5-7 trading days. Position sizing should be moderate due to volatility risk from regulatory actions or sudden short-interest declines, but momentum indicators and sentiment lean strongly in favor of bulls this week.

GME Character LoopIn my other post I’m tracking GME’s big harmonic roadmap – here I’m zooming in on the story 'how price keeps acting along the way'.
On this chart I’ve marked the recurring “character loop”:
red double tops → red strong zigzag dumps → purple rounding tops inside demand zones → big upside legs.
You can see that script play out more than once: top out, dump hard into demand, carve a rounded base, then bang.
Right now we’ve just had another double top and sharp dump, and price is sitting in the upper green demand zone around the macro 0.618 support. I’ve marked a new potential purple rounding zone here, with a lower green box + “Rounding Top ????” as the next possible stage if this one fails.
I’m basically combining two views:
the harmonics as a possible macro roadmap
this repeating behaviour as the way GME often travels between those zones.
If buyers step in and we see that familiar rounding + push, it fits both stories. If this 0.618 cluster gives way, the script changes and the lower box comes into play.
Just mapping GME story behaviour and seeing if it stays in character.

Meme-Stock Darling GameStop Is -25% YTD. What Its Chart ShowsOne-time meme-stock darling GameStop NYSE:GME has fallen more than 25% year to date and trails the S&P 500 SP:SPX in almost every time period from one month to five years. What does GME's chart and fundamental analysis say as the video-game/collectibles retailer prepares to report earnings next week?
Let's take a look:
GameStop's Fundamental Analysis
GME will go to the tape with the firm's fiscal Q3 results after the close of business next Tuesday.
The company isn't well covered by analysts, but the one estimate that I can find calls for $0.20 in adjusted earnings per share on roughly $987.3 million of revenue.
Numbers like that would compare very well to the same period a year ago, with adjusted EPS up 233.3% from the $0.06 that GME reported in fiscal Q3 2024 and revenues some 15% higher from the year-ago quarter's $860.3 million.
The firm is also coming off a strong fiscal Q2, where it easily beat expectations for both earnings and revenue.
GameStop's Technical Analysis
Now let's take a look at GME's chart going back some seven months and running through Tuesday afternoon:
What we have here is a falling-wedge pattern of bullish reversal, as marked with the two blue, heavy diagonal lines that take up almost the entire chart.
Now, this matters, as an ascending triangle -- marked above with thinner blue lines, and which this chart comes close to actually showing -- would be a pattern of bearish continuance.
GameStop rebounded off of the falling wedge's lower trendline in late November and is currently trying to retake its 50-day Simple Moving Average (or "SMA," marked with a curvy blue line in the tan-shaded area's center). Doing that could get some professional money behind the stock.
That's key, as the shares have recently taken and held their 21-day Exponential Moving Average (or "EMA," denoted by the curvy green line above). Taking and holding the 21-day EMA implies some support from the swing crowd.
One could see the 50-day SMA as GameStop's current upside pivot, but my feeling is that the 200-day SMA (the red line above) will matter much, much more.
Yes, the 200-day line is usually seen as more important than the 50-day one -- but in this case, that red line is running almost concurrently with the falling wedge's upper trendline.
Meanwhile, GME's other technical indicators are showing signs of improvement as well.
For instance, readers will see that the stock's Relative Strength Index (or "RSI," marked with a gray line at the chart's top) has quickly gone from technically oversold to neutral to much better than neutral in less than two weeks.
And look at GME's Moving Average Convergence Divergence indicator, marked with black and gold lines and blue bars at the chart's bottom.
The 12-day EMA (the black line) and 26-day EMA (the gold line) are both running below the zero-bound, but the 12-day line has crossed over the 26-day one. That's a subtle technical positive.
More overtly, the histogram of the 9-day EMA the (blue bars) has already moved above zero, which is a short-term bullish technical signal.
An Options Option
Some options investors looking to take advantage of this moderately bullish set-up while not using much capital might set a three-part options trade, called a "combination" in this situation.
This would involve selling a lower put, buying a call and selling a higher call -- with all three expiring on the same day but having different strike prices. Here's an example:
-- Purchase one GME call at a $24.50 strike price -- the falling wedge's upper trendline -- and a Dec. 12 expiration (i.e., after Tuesday's earnings). This would cost about $0.70 at recent prices.
-- Sell one GME Dec. 12 $27 call for roughly $0.32 at recent levels.
-- Sell one GME Dec. 12 $20 put, which was trading at about $0.22 as I wrote this.
Net Debit: $0.16.
In this case, the trader wants to get long the shares, but only if GME breaks out of the falling-wedge pattern.
To do so inexpensively, the trader buys a call with a strike price equal to the pattern's upper trendline. But to reduce costs, the trader also sells a put with the $27 strike, turning this portion of the set-up into a simple bull-call spread.
Additionally, the trader sells a put with a strike price that's at the falling wedge's lower trendline to further lower costs (because he or she is OK with actually buying the shares at a discount if this put is exercised).
Best case, the trader's theoretical maximum gain is $2.50 on a set up that only cost $0.16 -- a $2.34 net profit.
Worst case, the trader ends up long 100 GME shares at a $20.16 net basis at a time when the shares are trading below $20.
(Moomoo Technologies Inc. Markets Commentator Stephen "Sarge" Guilfoyle had no position in GME at the time of writing this column.)
This article discusses technical analysis, other approaches, including fundamental analysis, may offer very different views. The examples provided are for illustrative purposes only and are not intended to be reflective of the results you can expect to achieve. Specific security charts used are for illustrative purposes only and are not a recommendation, offer to sell, or a solicitation of an offer to buy any security. Past investment performance does not indicate or guarantee future success. Returns will vary, and all investments carry risks, including loss of principal. This content is also not a research report and is not intended to serve as the basis for any investment decision. The information contained in this article does not purport to be a complete description of the securities, markets, or developments referred to in this material. Moomoo and its affiliates make no representation or warranty as to the article's adequacy, completeness, accuracy or timeliness for any particular purpose of the above content. Furthermore, there is no guarantee that any statements, estimates, price targets, opinions or forecasts provided herein will prove to be correct.
Options trading is risky and not appropriate for everyone. Read the Options Disclosure Document ( j.moomoo.com ) before trading. Options are complex and you may quickly lose the entire investment. Supporting docs for any claims will be furnished upon request.
Options trading subject to eligibility requirements. Strategies available will depend on options level approved.
Maximum potential loss and profit for options are calculated based on the single leg or an entire multi-leg trade remaining intact until expiration with no option contracts being exercised or assigned. These figures do not account for a portion of a multi-leg strategy being changed or removed or the trader assuming a short or long position in the underlying stock at or before expiration. Therefore, it is possible to lose more than the theoretical max loss of a strategy.
Moomoo is a financial information and trading app offered by Moomoo Technologies Inc. In the U.S., investment products and services on Moomoo are offered by Moomoo Financial Inc., Member FINRA/SIPC.
TradingView is an independent third party not affiliated with Moomoo Financial Inc., Moomoo Technologies Inc., or its affiliates. Moomoo Financial Inc. and its affiliates do not endorse, represent or warrant the completeness and accuracy of the data and information available on the TradingView platform and are not responsible for any services provided by the third-party platform.

GME setup is looking suspiciously similar to April 2024The GME chart currently has a very high pattern correlation with March/April 2024, leading into the run up to $80. The Auto Fractal with a 30 length segment period and 500 bar lookback finds the segment on it's own.
With Michael Burry starting to discuss GME, and macroeconomic stress starting to boil over as it did in April 2024, we should be vigilant to see if there are any unusual blocks over the next week or two. If we start to see unusual options or share blocks rolling in, the chart has the potential to reach over $29, up until we reach the bond->equity conversions and warrant conversions. At that point, the price should hit a brick wall.
To identify the top of the cycle, we need to look in the pre-market. Unusual bullish spikes in pre-market generally signal the absolute top of the cycle and are a major sell signal. If we get a very bullish pre-market spike prior to $29, proceed with extreme caution.
Other than that, my indicators are pretty much all signaling both MOASS and the end of the current global financial system, and have been for the past month. Popcorn is at the ready.

GME Harmonic Game: Giant Crab, Sneaky Bat and a Potential SpringGME is loading its harmonic endgame. On the weekly I’m tracking a giant potential Bearish Crab and a sneaky potential Bearish Bat nested inside it – both still unconfirmed, just harmonic “roadmaps” for now, not guarantees.
Price is currently poking around point C in the green box, a classic spot where a Wyckoff-style springboard could form. If this zone holds and buyers step in, we might see a slingshot back toward the Bat B area and, in a best-case scenario, a run toward the upper PRZs. If it breaks down convincingly, the whole spring idea is invalid and the bears win this round.
I’m watching how price, volume and local trendlines behave here to see whether these harmonics start to prove themselves or get wiped off the map. Not financial advice – just my harmonic game plan for the next big move on GameStop.

GameStop GME
I will buy from these levels.
This is my favorite stock. I love GameStop, i'm gamer :))
I bought it from year 2004, and keep buying as i can at lowest prices, ever sold, and continue buy more.

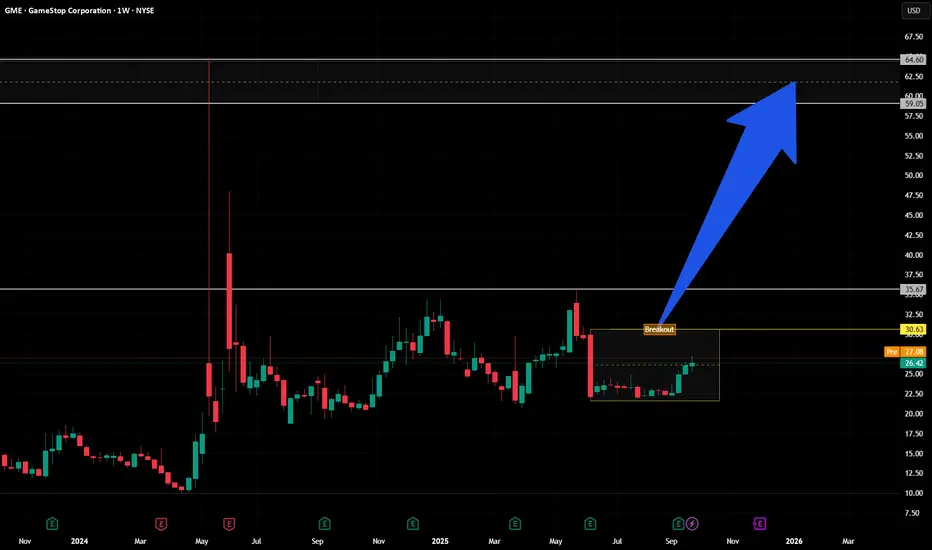
$GME Weekly breakout in the makingMemestock or not the weekly is accumulating pressure. Combine with warrants week and sheer meme power, we may see something impressive once the 30$ breakout is triggered.
GME: The clock is ticking…After topping near $65, GME has been consolidating in a WXY corrective pattern. The Y Wave is forming a triangle, and the E Wave is about to determinate.
If it resolves as expected, we could see a strong upside move.
Key Gann Dates:
🔹 11 Nov 2025
🔹 11 Dec 2025

GME: Bearish StructureAt $22.29, GME is not a dip. It’s a falling knife!
A close below $21.50 could trigger stop-loss cascades.
The combination of:
Bearish Patterns, broken trendline, low volume
Dilution overhang
Crypto beta risk (BTC proxy)
No growth narrative
Do your own research and trade at your own risk.

10/27/25 - $gme - are you paying attn?10/27/25 :: VROCKSTAR :: NYSE:GME
are you paying attn?
- the converts have famously been a vehicle used (and no longer used) by treasury co's in order to borrow at 0%, but it kept a lid on px action b/c the risk arbs would immediately go and short the stocks once they moved
- i suspect ryan has trapped a massive pile of shorts w this convert at $30
- co is FCF +ve. transitioned into trading cards. anyone that knows this alpha generation knows this is their dopamine of choice. it's a highly profitable and sticky business. you want to own businesses that have the attention of the younger generations
- last 6 mo this co has done $300mm in FCF... shut down two unprofitable businesses and stacked a bunch of 0 interest (convert) debt way above current levels
- and now you have trump tweeting at this?
- time to lock in, anon. something weird is happening here.
V

I believe we are HERE! Parabolic Move might be sooner than we think! $67 is not a MEME! I would like to see price tag $22.66 today or tomorrow the latest, if it doesn't this setup is invalidated!

GME Market Strategy: Risk-Managed Swing to Resistance🚨 GME: GameStop's Great Heist! 🎮💰 Bullish Swing/Day Trade Plan
Asset: GameStop Corporation (GME)Market: NYSE (Stock)Strategy: Swing/Day Trade with a "Thief's Layered Limit Order" Approach 😎
Get ready, traders! We're about to pull off a bullish heist on GameStop (GME) with a slick, calculated plan to outsmart the market! 📈 This setup is packed with technical firepower and a cheeky vibe to keep it fun yet professional. Let’s dive into the Thief’s Wealth Strategy Map and steal some profits! 🕵️♂️
📊 Technical Breakdown: Why GME is Ripe for the Taking
Our bullish setup is backed by a rock-solid technical foundation. Here’s the intel:
🔥 382 EMA Breakout: GME has smashed through the 382-period Exponential Moving Average, signaling strong bullish momentum. This breakout is our green light for action! 🚦
💥 Accumulation Zone Pressure: Buyers are stacking up in the accumulation zone, pushing prices upward like a crew of bullish bandits ready to raid the market.
🕯️ Heikin Ashi Reversal Candle: A gorgeous bullish Heikin Ashi candle has emerged, screaming BUYING POWER and confirming the trend reversal. The bulls are in control! 🐂
🗝️ Thief’s Edge: We’re using a layered limit order strategy to sneak into the market at multiple price points, maximizing our entry precision.
🕵️♂️ The Thief’s Entry Plan: Layered Limit Orders
This isn’t your average “buy and pray” strategy. We’re using a layered limit order approach to enter like sneaky market thieves. Set your buy orders at these levels:
🪙 $24.00
🪙 $24.50
🪙 $25.00
🪙 $25.50
🪙 $26.00
Pro Tip: Feel free to add more layers based on your risk appetite and account size. The more layers, the merrier the heist! 😜 You can also enter at any price level within this range if you prefer a single strike. Just keep it sharp and calculated!
🛑 Stop Loss: Protect Your Loot
🛡️ Set your stop loss at $23.00 to guard against unexpected market traps. ⚠️
Note: Dear Ladies & Gentlemen (Thief OGs), this is my suggested stop loss, but it’s your heist! Adjust it to suit your risk tolerance. Trade smart, and don’t get caught by the market cops! 👮♂️
🎯 Target: Cash Out Before the Barricade!
🎰 Our profit target is $31.00, where a police barricade zone (aka strong resistance) awaits. This level is flagged as overbought with a potential trap for greedy thieves. 🪤 Escape with your profits before the market clamps down!
Note: Thief OGs, this is my target, but you’re the boss of your trades. Take profits at your own discretion and secure the bag! 💸
🔗 Related Pairs to Watch (Correlated Assets)
To maximize your market intel, keep an eye on these correlated assets (all in USD):
🎥 NYSE:AMC Entertainment (AMC): Another meme stock darling, often moving in tandem with GME. Watch for similar bullish setups or divergences.
📊 AMEX:SPY (S&P 500 ETF): GME’s wild swings can be influenced by broader market sentiment. If SPY is bullish, GME’s momentum could get an extra boost!
📱 NYSE:BB (BlackBerry): Another retail-favorite stock with potential for correlated volatility. Check for breakout patterns here too.
Key Correlation Points:
🚀 NYSE:GME and NYSE:AMC : Often ride the same retail-driven waves, especially during short squeezes or social media hype.
⚖️ AMEX:SPY Influence: If SPY shows weakness, GME’s bullish momentum might face resistance. Stay alert!
🔍 NYSE:BB as a Signal: If BlackBerry is pumping, GME might follow suit.
📝 Final Notes for the Heist
This is a high-octane, bullish setup designed for swing or day traders with a taste for calculated risk. The Thief’s Layered Limit Order Strategy gives you flexibility to enter the market like a pro, while the technicals (382 EMA breakout, Heikin Ashi, and accumulation pressure) provide a solid foundation. 🏦
Stay sharp, manage your risk, and don’t get greedy—escape with your profits before the market throws up a barricade! 🚓
✨ “If you find value in my analysis, a 👍 and 🚀 boost is much appreciated — it helps me share more setups with the community!”
#Hashtags: #GME #StockMarket #SwingTrading #DayTrading #Bullish #TechnicalAnalysis #TradingStrategy #MemeStocks

GME | Gann & Elliott Wave Setup!Time + Price harmony = something big brewing 👀
According to Gann timing and Elliott Wave structure, NYSE:GME looks primed for another upside impulse 🚀

GameStop and Fibonacci: It's About TimeThis is my first attempt at publishing a video on TradingView, so hopefully it works.
I wanted to put together something educational about fib channels and why I like to use them. They're not a silver bullet, but they do tell you a lot about where to expect support and resistance because the chart has a very good memory, and you can see this play out on pretty much any instrument, including cryptocurrencies.
I follow NYSE:GME closer than any other ticker, so this video is about my philosophy on the fib channels that I have been using on the GME chart and talking about on the Echo Chamber Podcast. Hopefully this adds a little more context to that discussion, how the flat price levels are not always the only thing that matters, but taking time-based trends into account can make a big difference in your analysis and understanding of price movement.
Happy to hear people's thoughts on my crayons 🖍️ which color should I eat next?
Since this is a bit of a longer video, here's an AI summary of the content with timestamps:
Introduction 00:00-01:05
I introduce the topic of explaining my TradingView chart, which has many colorful lines. I clarify that I didn't manually draw all the lines, but used Fibonacci channels that only require selecting 3 points.
Explaining Current Chart 01:05-04:33
I show my current GameStop chart, explaining various trend lines and Fibonacci channels. I demonstrate how to adjust the Fibonacci channel points to analyze different price movements.
Fresh Chart Walkthrough 04:33-11:57
Moving to a clean chart, I explain global chart items, including trend lines from major tops and bottoms. I discuss dividend-adjusted vs non-adjusted charts and explain the "Gandalf line" of support.
Fibonacci Channels Explanation 11:57-24:54
I provide a detailed explanation of how Fibonacci channels work, demonstrating how to draw them and interpret the resulting lines. I show how these channels can describe price action across long time periods.
Additional Examples 24:54-33:44
I show more examples of Fibonacci channels applied to GameStop's entire price history. I discuss how these channels can provide insight into potential future price movements and support/resistance levels.
Conclusion 33:44-34:40
I summarize my thoughts on GameStop's current price action in relation to the Fibonacci channels and support levels identified.
Some Quotes
"I find them mathematically interesting." 11:54 - Referring to trend-based Fibonacci tools.
"Math is your friend here. But you don't have to do the math, you just can use tools that will help you." 17:19
"Price is fractal in nature in that patterns are repeating and Fibonacci is everywhere." 17:19
"Things like history repeats itself. It's just a question of when, not if." 24:30
"The point I want to drive home here is that when we start to get a little bit more granular here, and this is why I have lots of crayons on my chart." 28:34
Key Tips/Concepts
Fibonacci channels can be powerful tools for technical analysis, providing insight into potential support and resistance levels.
These channels can sometimes describe price action across very long time periods, even when drawn based on recent price movements with thoughtfully selected endpoints.
The importance of considering price, time, and volume in technical analysis, as demonstrated by the "Gandalf line".
The value of using multiple timeframes and chart types (dividend-adjusted vs non-adjusted, trading hours only vs extended hours included) to gain a more complete picture of a stock's price history. (Editorial note: something I didn't cover in the video, but the difference between log scale and linear scale sometimes will make for an interesting story on trendlines and fib channels too. I prefer to keep my chart in log scale, but will toggle between log and linear occasionally to see if there's something interesting there in the lines already drawn.)
The concept of fractal nature in price movements and how patterns tend to repeat over time.

Are you ready to wait for one more year?At least this is what the chart tells me. Warrant at 32$ with a date of October 26.
Everything looks to be connected. GME, right now is trapped.
For me, there is no way, so far to buy it until GME breaks out that massive symmetrical triangle that you can see.
Patiente. It will come, but it will take time, more than it is said.
September -October 2026 will be the key and I will be ready for it. Now, save and wait.

GME 1W: when the memes fade, the structure speaksGameStop is once again testing the lower boundary of its long-term consolidation, bouncing off the 21.53 zone - a level that aligns with the 0.79 Fib retracement and historical support. This zone also intersects with a key trendline on the weekly chart, and just recently, a golden cross (MA50 crossing MA200 weekly) printed - a rare but technically significant signal. The stock continues to trade inside a broad descending channel, and if this support holds, the natural next step is a move back toward the mid-range at 37.42 (0.5 Fib), followed by a possible push toward 64.92. The tactical setup favors a confirmation entry near current levels, with a stop under 21.00. Risk/reward here is among the cleanest GME has offered in months.
On the fundamental side, GameStop remains in a transitional phase. The company is shutting down unprofitable segments, reducing costs, and doubling down on e-commerce and digital distribution. Financial results are still slow to recover, but the latest Q2 2025 report showed positive operating cash flow and narrowing losses. This isn't a value play in the traditional sense - it's more about the potential for renewed retail-driven momentum if technical conditions align.
If there’s still power behind the crowd - this might be one of the most technically compelling entry zones of 2025.

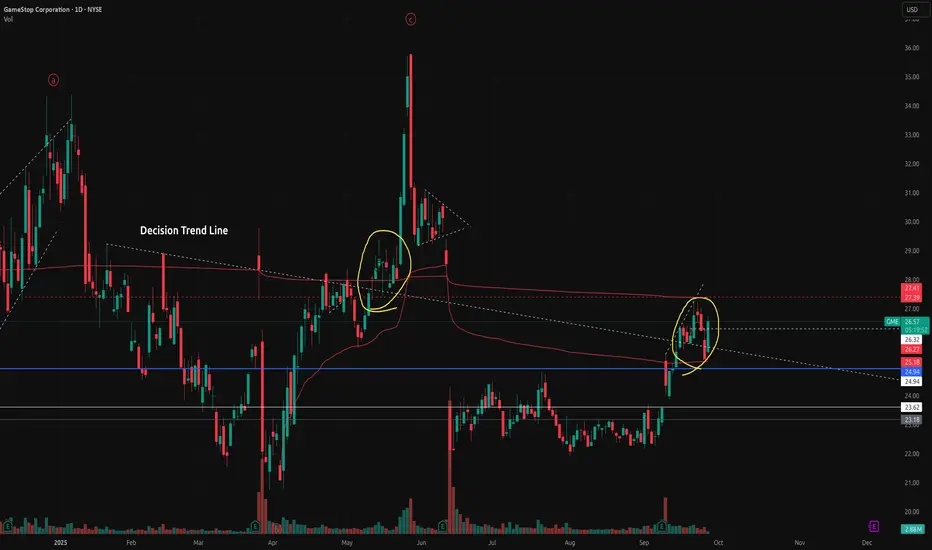
GME - Time for Giants again?GME is not a stock I have a clear wave-count on by any means, but elliot wave theory is not the only means by which I trade. I selectively look at volume/market structures to make decisions. And let me say, for ALL of 2025, this 'Decision Trend Line' has been the deciding factor between GME running or GME falling.
Only ONCE has it broken through and retested, the last time it did this? Mid may, when prices quickly soared on Bitcoin rumors.
GME is a company that fundamentally has turned some things around, but I'm not ignoring this clear technical breakthrough and retest.
The time of giants is near again.