ICICI BANKKey Levels That Matter
Primary Buy Zone: 1325
Structural Demand / SL: 1186
Last Swing High: 1500
Measured Target: 1639
Trade Plan (MTF – Positional)
Entry Strategy
Entry: 1325 (Single-shot entry)
Qty: 5000
Risk Management
SL: 1186
Defined Risk: 139 pts
Risk placed below MTF–ITF demand confluence
Targets
Primary Target: 1639
Clean move above 1500 should accelerate momentum
ICICI BANK – Multi Time Frame (MTF) Summary
Trend Overview
HTF (Yearly / Half-Yearly / Quarterly):
✅ Primary UPTREND firmly intact
Yearly demand at 1043–970 → long-term base
Half-yearly & Quarterly show higher demand shift (BUFL)
HTF Avg Demand Zone: 1229 – 1092
MTF (Monthly / Weekly / Daily):
✅ Strong continuation structure
Monthly, Weekly & Daily all at BUFL
Indicates fresh leg within an existing uptrend
MTF Avg Demand Zone: 1314 – 1186
ITF (240M / 180M / 60M):
✅ Perfect alignment
All ITFs holding DMIP
Confirms sustained institutional participation
Market insights

ICICI Bank | Gann Square of 9 Intraday Case Study | 06 Apr 2023This chart presents a classical WD Gann Square of 9 intraday setup, where price completed its normal capacity early in time, leading to a high-probability reversal.
On 06 April 2023, ICICI Bank started gaining upside momentum from the third 15-minute candle.
The intraday low at ₹875 was selected as the 0-degree (0°) reference point, following standard Gann methodology.
Using the Gann Square of 9, the stock’s normal intraday upside level was projected at:
45° → ₹890
Price reached the 45-degree level around 11:15 AM, which is significantly earlier than the ideal Gann time window near 2:30 PM.
As per Gann’s time–price relationship, early completion of a degree level often indicates temporary exhaustion.
The stock reacted precisely from this zone and reversed lower, offering clear intraday downside movement.
This case highlights how price geometry combined with time analysis helps traders identify logical reaction zones, rather than depending on indicators or assumptions.
📌 Key Gann Levels
0° → 875
45° → 890
🔍 Learning Points
Square of 9 defines price capacity
Time determines when that capacity becomes effective
Early completion = higher probability of reaction
Structure > indicators
Disclaimer:
This idea is shared for educational and analytical purposes only. It is not a trading or investment recommendation.

ICICI BANKICICI Bank Ltd., incorporated in the year 1994, is a banking company (having a market cap of Rs 9,93,046.55 Crore).
ICICI Bank Ltd. key Products/Revenue Segments include Interest & Discount on Advances & Bills, Income From Investment, Interest On Balances with RBI and Other Inter-Bank Funds and Interest for the year ending 31-Mar-2025.
The Bank has reported Standalone Non Performing Assets (Gross NPAs) at .00 % of total assets and Standalone Net Non Performing Assets (Net NPAs) at .00% of total assets for the quarter ending 30-09-2025.
For the quarter ended 30-09-2025, the company has reported a Consolidated Total Income of Rs 76,146.59 Crore, up 2.11 % from last quarter Total Income of Rs 74,576.03 Crore and up 4.39 % from last year same quarter Total Income of Rs 72,942.55 Crore. The bank has reported net profit after tax of Rs 13,357.06 Crore in latest quarter.
The bank’s top management includes Mr.Pradeep Kumar Sinha, Mr.Sandeep Bakhshi, Mr.Ajay Kumar Gupta, Mr.Rakesh Jha, Mr.Sandeep Batra, Mr.B Sriram, Ms.Neelam Dhawan, Mr.Punit Sood, Mr.Radhakrishnan Nair, Mr.Rohit Bhasin, Mr.S Madhavan, Ms.Vibha Paul Rishi, Mr.Anindya Banerjee, Ms.Prachiti Lalingkar. It has Walker, Chandiok & Co.LLP as its auditoRs As on 30-09-2025, the company has a total of 714.37 Crore shares outstanding.

ICICI BANKStock has formed a triangle pattern and is now consolidating within the range, as the overall market looks bearish and private banks being the underperformer, one can expect some dip in near term. One can look for buying opportunities once it reaches Fib level of 0.5-0.618

ICICI BANK - BULLISHBullish in daily chart. Hammer in weekly chart.
Closed above ascending trendline.
Resistance / targets as per FIB levels.
BUY at current level or dips.

icici bank buy icici bank as per my risk this is only for my pers knowledge not recommend for any buy and sell please take as per your own risk mgt

ICICI Bank Ltd for 17th Oct #ICICIBANK ICICI Bank Ltd for 17th Oct #ICICIBANK
Resistance 1420 Watching above 1422 for upside momentum.
Support area 1400 Below 1400 gnoring upside momentum for intraday
Watching below 1398 for downside movement...
Above 1420 ignoring downside move for intraday
Charts for Educational purposes only.
Please follow strict stop loss and risk reward if you follow the level.
Thanks,
V Trade Point

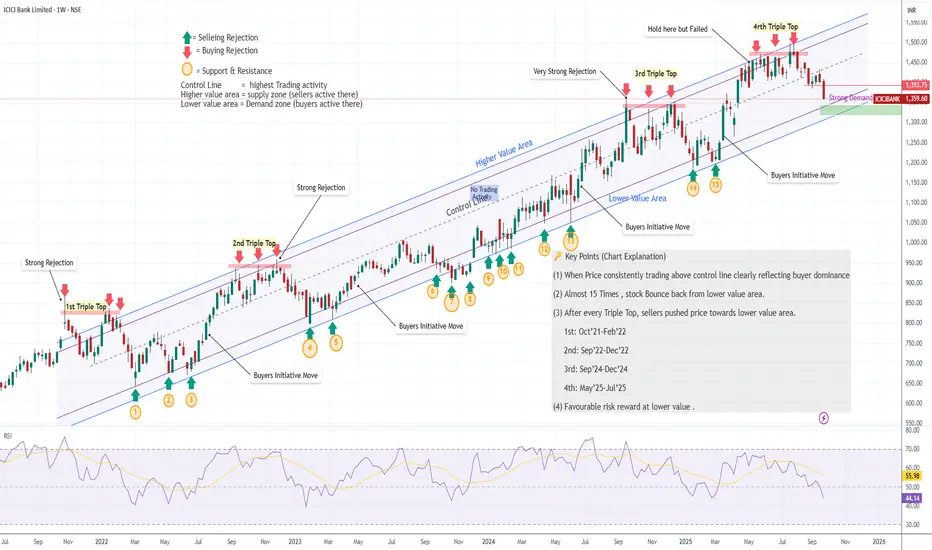
“ICICI Bank: Where Smart Money Steps InICICI Bank has been trading inside a long-term uptrend channel for the past 3 years. Within this structure, two clear zones are visible:
Higher Value Area (Supply Zone): Sellers dominate → price faces rejection here.
Lower Value Area (Demand Zone): Buyers dominate → price consistently bounces from here.
👉 Every time price approaches the Lower Value Area around 15 times :
(1) Buyers step in aggressively,
(2) Price reverses strongly,
(3) Risk–Reward becomes highly favorable.
(4) This makes the current setup a good accumulation point.
Now once again, price is testing the Strong Demand Zone (₹1340–1320).
Risk–Reward Setup
Buy Zone: ₹1340–1320
Immediate Resistance: ₹1390–1400
Upside Target: ₹1500–1550 (upper channel boundary)
Risk: Breakdown below ₹1320 may lead to ₹1200.
Fundamental Strength
✔️ Healthy Balance Sheet: Strong capital adequacy, well-managed NPAs.
✔️ Consistent Profit Growth: Strong momentum in NII & PAT over the years.
✔️ Retail & Digital Leadership: Leading share in retail loans + strong digital adoption.
✔️ Sector Tailwind: Indian banking credit growth projected at 14–16%, a positive for ICICI.
✔️ Valuation Comfort: Reasonable PE & PB compared to peers (HDFC Bank, Axis Bank).
ICICIBANK: Support Zone & Hidden Setup UnfoldingICICI Bank – Technical Outlook
On the daily and 1-hour charts, ICICI Bank is showing strength near a key support zone of 1370–1390.
On the 1-hour timeframe, the stock is forming a diamond pattern around the 1380–1400 range.
A sustained move above this support zone may trigger upside momentum and lead to higher price levels in the coming sessions.
Conclusion: ICICI Bank is currently at a crucial support area with a developing bullish structure. Traders and investors should monitor these levels closely for potential opportunities.

icici bank chartTrend
Stock recently tested around ₹1500 (resistance zone) and retraced.
Currently at ₹1394, down ~1.2%.
Structure looks like a sideways-to-weakening uptrend; higher highs were made earlier, but now price is slipping towards a support zone.
Key Levels:
Immediate Support: ₹1380 – 1400 zone (currently testing).
Strong Support: ₹1320 – 1340 (if current support breaks).
Major Support: ₹1250 & then ₹1180.
Immediate Resistance: ₹1450 – 1475.
Major Resistance: ₹1500 (recent swing high).
Chart Pattern:
Price is consolidating after an uptrend.
A break below ₹1380 may trigger a short-term bearish move.
If it holds above ₹1380, sideways consolidation can continue with chance of re-testing ₹1450/1500.
Stop Loss & Targets (Short-Term Swing):
If Long (Bullish bias):
Entry near: ₹1390 – 1400 (only if it holds this support).
Stop Loss: ₹1365.
Targets: ₹1450 → ₹1500.
If Short (Bearish bias):
Sell if closes below ₹1380.
Stop Loss: ₹1415.
Targets: ₹1340 → ₹1300.
📊 Fundamental View
Business Strength: ICICI Bank is one of India’s leading private sector banks with strong retail & corporate lending.
Financial Performance (latest trends till FY25):
NII (Net Interest Income): Steady double-digit growth.
Asset Quality: GNPA and NNPA at record lows compared to past years.
ROA / ROE: Among the best in private banking space.
Credit Growth: Strong in retail & SME segments.
Valuation: Fairly valued compared to peers like HDFC Bank, Axis Bank, and SBI.
Outlook: Fundamentally strong for medium-to-long term investors, but short-term volatility linked to RBI rate stance, credit growth, and NIM pressure.
🧭 Verdict
Short-Term (1–4 weeks): Neutral-to-slightly bearish unless ₹1380 holds strong. Break below = bearish move.
Medium-Term (3–6 months): Still bullish as long as price stays above ₹1250; stock may retest ₹1500–1550.
Long-Term (1+ year): Fundamentally strong; good hold for investors.
this is only learning purpose not any buy sell recommendation. analyses your self its good for you

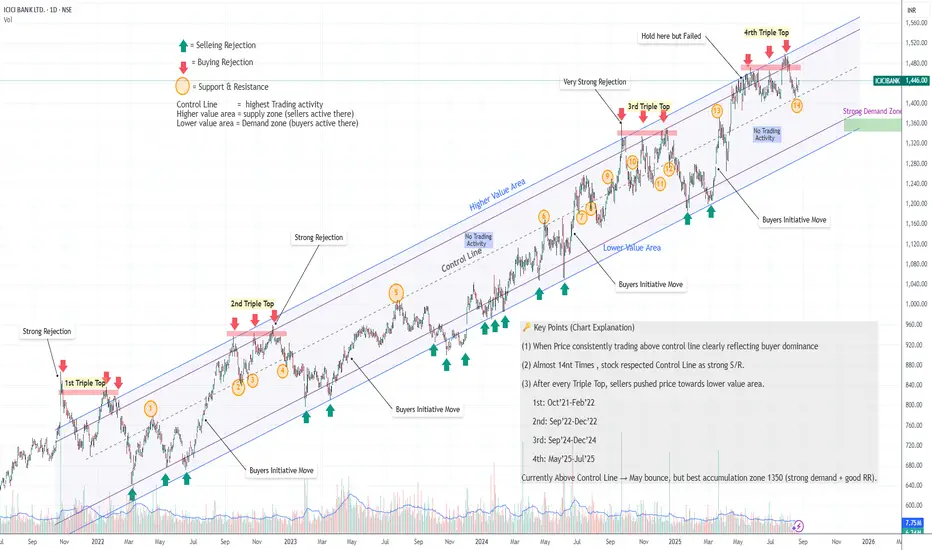
“ICICI Bank – Triple Tops Rejected, Demand Zone in Focus”🔑 ICICI Bank – Key Technical Points
📌Multiple Times → Control Line acted as S/R (around 14nth Times)
price respected the Control Line – price took support & resistance near Control Line → confirms its importance.
📌 Repeated Triple Tops → Seller Pressure
Every time the stock formed a Triple Top, sellers pushed it down towards the lower value area.
🔺 1st: Oct’21 – Feb’22
🔺 2nd: Sep’22 – Dec’22
🔺 3rd: Sep’24 – Dec’24
🔺 4th: May’25 – Jul’25
📌 Current Situation
Price is trading near the Control Line → short-term bounce is possible here but Don't forget Triple top recently forming here.
📌 Demand Zone (Near 1350 or Lower Vale area)
The strongest buying opportunity lies in this zone at 1350 – historically a key demand area offers the best risk–reward setup.
No indicator, no oscillator, No Moving Average, No Fundamental factor included: - Theory is just based on Price action breakdown.
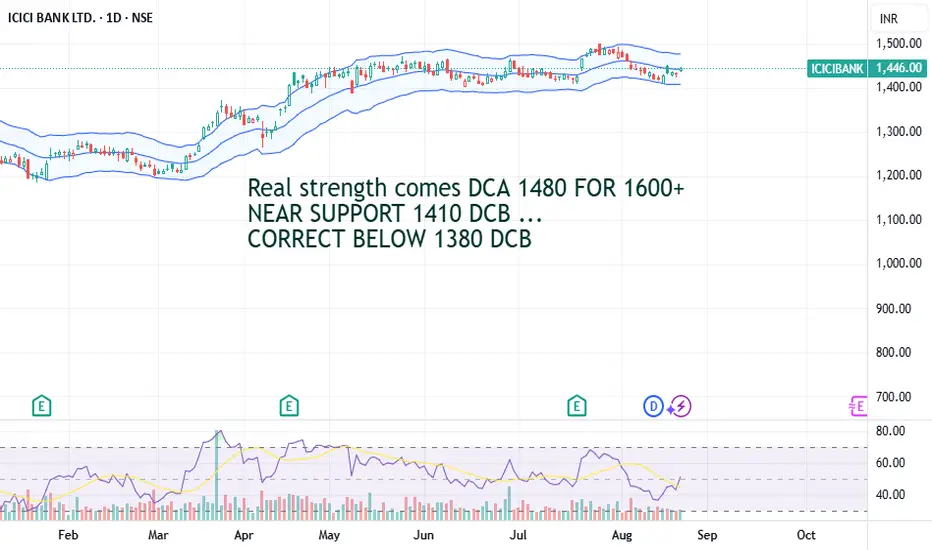
PROFITABLE ICICI READY TO CROSS ATH OR BE IN RANGE 1380-1500 ??Profitable Pvt. ICICI bank is in consolation 120 point since 40 days once this phase over and success to daily close above 1480 try to touch ATH and easily shift to 1600+ .
Keep near term DCB SL1410 and long hold SL DCB 1380 ....
ICICI Bank on the move! A strong buy opportunity spotted.There are two charts of ICICI Bank—one on the 1-hour timeframe and the other on the 4-hour timeframe.
On the 4-hour chart, ICICI Bank is trading within a well-defined parallel channel, with strong support in the 1400–1410 zone.
“On the 1-hour chart, ICICI Bank is forming a Symmetrical Triangle pattern with support near 1424. The weekly pivot level at 1423 may also act as strong support, while the monthly pivot at 1450 is acting as resistance. The pattern breakout indicates a potential target of 1465.
If this support level holds, the stock may witness higher price levels.
Thank You !!

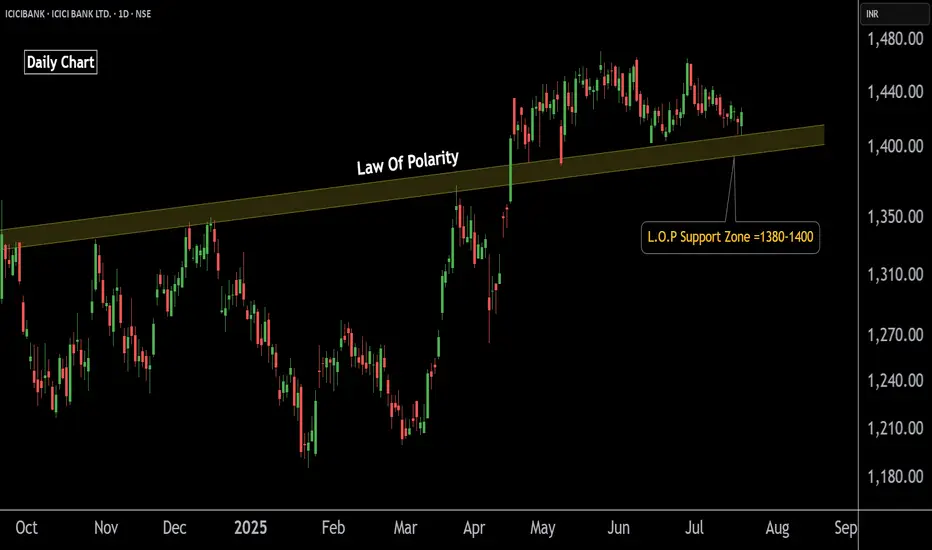
ICICI Bank Poised for Upside – Buy OpportunityThis is the daily chart of ICICIBANK.
ICICIBANK having a good law of polarity at 1380-1400 level .
If this level is sustain then we may see higher prices in ICICIBANK.
Thank You !!
ICICI Bank_Key Resistance Area/ All time HighICICI Bank - Price near all time high or key resistance area. Although the price is making a big green candle, volume doesn't support the breakout momentum (or atleast Breakout momentum is not created yet). Good part is - Price takes support at 20 DEMA and all other price structure looks good for potential breakout.
Watch the key area and how tomorrow going to be.

ICICI Bank Ltd view for Intraday 22nd May #ICICIBANKICICI Bank Ltd view for Intraday 22nd May #ICICIBANK
Resistance 1450 Watching above 1452 for upside momentum.
Support area 1420 Below 1430 ignoring upside momentum for intraday
Watching below 1417 for downside movement...
Above 1430 ignoring downside move for intraday
Charts for Educational purposes only.
Please follow strict stop loss and risk reward if you follow the level.
Thanks,
V Trade Point

ICICI BANK showing bearish patternICICI BANK SHOWING clearly bearish signal as market is having some of its own issue of india pak- and stock is also at its high with profit booking face the level of 1400 is the support once it break it highly possible to reach 1350 or more down

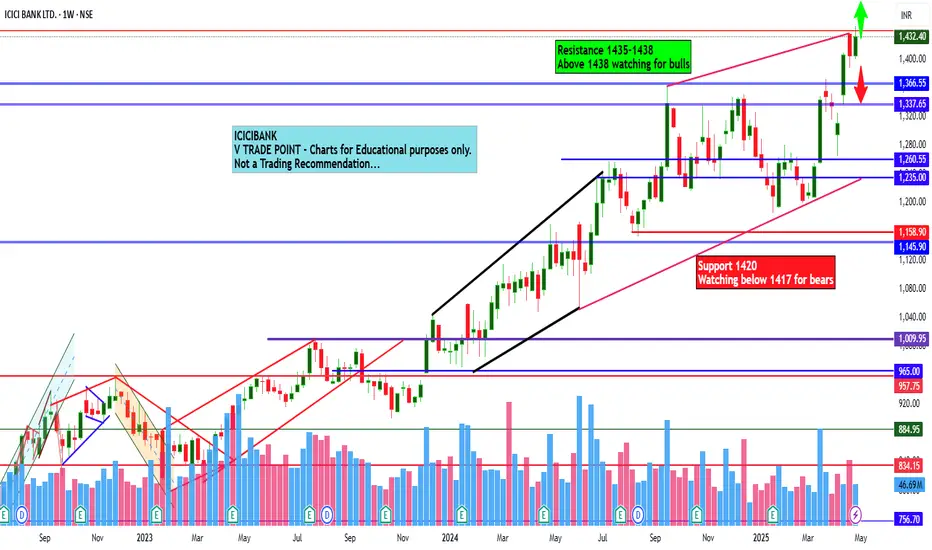
ICICI Bank Ltd view for Intraday 5th May #ICICIBANK ICICI Bank Ltd view for Intraday 5th May #ICICIBANK
Resistance 1435-1438 Watching above 1438 for upside movement...
Support area 1420 Below 1420 ignoring upside momentum for intraday
Watching below 1417 for downside movement...
Above 1435 ignoring downside move for intraday
Charts for Educational purposes only.
Please follow strict stop loss and risk reward if you follow the level.
Thanks,
V Trade Point
ICICI Bank Ltd view for Intraday 29th April #ICICIBANK ICICI Bank Ltd view for Intraday 29th April #ICICIBANK
Resistance 1430-1435 Watching above 1435 for upside movement...
Support area 1420 Below 1420 ignoring upside momentum for intraday
Watching below 1417 for downside movement...
Above 1430 ignoring downside move for intraday
Charts for Educational purposes only.
Please follow strict stop loss and risk reward if you follow the level.
Thanks,
V Trade Point

ICICI Bank Ltd view for Intraday 28th April #ICICIBANK ICICI Bank Ltd view for Intraday 28th April #ICICIBANK
Resistance 1420 Watching above 1422 for upside movement...
Support area 1400 Below 1400 ignoring upside momentum for intraday
Watching below 1397 for downside movement...
Above 1420 ignoring downside move for intraday
Charts for Educational purposes only.
Please follow strict stop loss and risk reward if you follow the level.
Thanks,
V Trade Point

ICICI Bank Ltd view for Intraday 23rd April #ICICIBANK ICICI Bank Ltd view for Intraday 23rd April #ICICIBANK
Resistance 1420-1425 Watching above 1430 for upside movement...
Support area 1400 Below 1400 ignoring upside momentum for intraday
Watching below 1397 for downside movement...
Above 1420 ignoring downside move for intraday
Charts for Educational purposes only.
Please follow strict stop loss and risk reward if you follow the level.
Thanks,
V Trade Point

ICICI Bank Ltd view for Intraday 22nd April #ICICIBANK ICICI Bank Ltd view for Intraday 22nd April #ICICIBANK
Resistance 1420-1425 Watching above 1430 for upside movement...
Support area 1400 Below 1400 ignoring upside momentum for intraday
Watching below 1397 for downside movement...
Above 1430 ignoring downside move for intraday
Charts for Educational purposes only.
Please follow strict stop loss and risk reward if you follow the level.
Thanks,
V Trade Point

Review and plan for 22nd April 2025 Nifty future and banknifty future analysis and intraday plan in kannada.
This video is for information/education purpose only. you are 100% responsible for any actions you take by reading/viewing this post.
please consult your financial advisor before taking any action.
----Vinaykumar hiremath, CMT
