Oceaneering (OII) — Subsea Tech + Multi-Year Backlog MomentumCompany Overview
Oceaneering International NYSE:OII is a global leader in offshore engineered services & subsea robotics, spanning ROVs, asset integrity, and digital solutions for oil & gas and emerging offshore energy.
Q3’25 Execution
Revenue: $743M (+9% YoY)
Net income: +73% YoY
Drivers: higher offshore activity, improved asset utilization, disciplined cost control—expanding operating leverage.
Backlog & Visibility
Multi-year contracts through 2027 reinforce revenue visibility and margin stability, underpinned by deepwater project pipelines.
Tech Edge
Vision™ Subsea digital platform enables remote inspections, safety improvements, and reduced downtime, strengthening OII’s role as a mission-critical deepwater partner.
Investment Outlook
Bullish above: $23–$24
Target: $35–$36 — supported by backlog growth, utilization gains, and digital subsea differentiation.
📌 OII — scaling robotics + digital to power the next cycle of offshore energy.
Market insights

What Is an Expanding Swing?Markets move in contraction/expansion. Small swings can be thought of as a form of contraction and the bigger swing is a form of expansion. An Expanded Swing is simply a reaction leg that is bigger than the previous reaction leg or legs. Its minor swings growing up to be major swings.
This represents a change in behavior that often causes confusion among the shorts and the longs. The shorts are fearful cause the market is now backing up on them and the longs are fearful cause they see a market now turning up and getting away from them. This confusion creates an opportunity for those that are sitting back with a plan.
To see this price action on a chart, it helps to have some simple and objective definitions for mapping the market and i show this in the video. First, we use market structure to read the market, and then we use a trading structure (trade plan) to structure the actual trade where we manage risk.
Shane

OII is about to breakoutNYSE:OII is about to breakout of the H&S pattern. Anticipated price action and targets are shown on the chart, stop loss daily close below 11.65$.
Hit the like button please if you find this useful :)
This is only my own view and not financial advice, do your own analysis before buying or selling
Happy Trading!


Oceaneering's Manufactured Products Segment Wins Contracts in ExOII: Oceaneering International, Inc.
2021-04-27 17:00:00
Oceaneering's Manufactured Products Segment Wins Contracts in Excess of $135 Million

Long | OIINYSE:OII
Possible Scenario: LONG
Evidence: Price Action, Moved Above Upper Keltner Channel, P&F Ascending Triple Top Breakout
TP1 ~13$,
This is my idea and could be wrong 100%

OII: Bullish Pennant, awaiting confirmation (39PC)Bullish Pennant, awaiting confirmation (39PC)
Pros:
Volume during post formation
Descending volume during triangle formation
Volume at break out
Golden cross in blue
PPS above 50MA and 200MA
RS above 0, and ascending
ATR Ascending
R/R ratio above 6
200MA ascending
250RSI above 50
Target:
PT = 17.69$
Help how ever you can to keep this alive.
Thank you to those who have donated Coins!
Always do your own due dilligence. This is not financial advice
Stay Humble, have fun, make money!

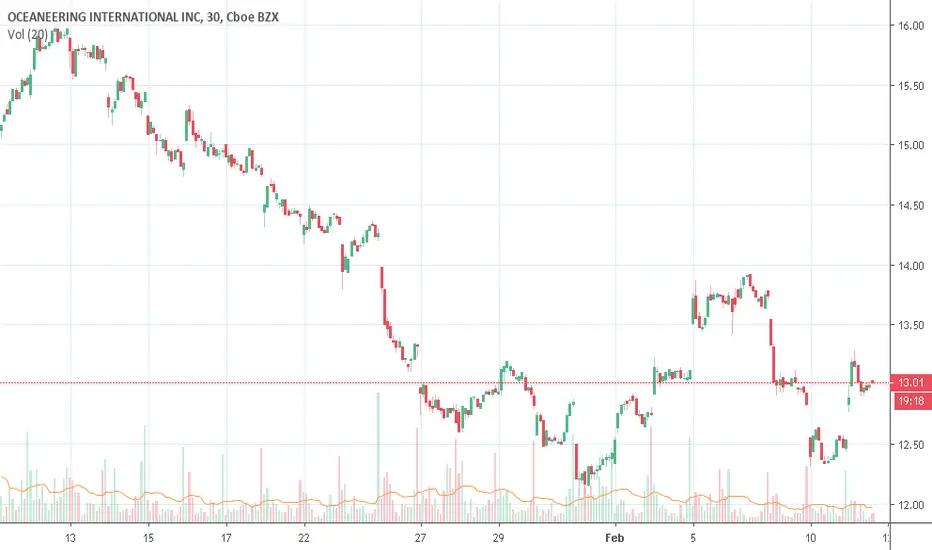
OII - Buy $10.20 Target $11.80This stock is an overall downtrend but could move to $11.80
Entry $10.20
Stop Loss $9.0
First Target: $11.80
Second Target $13.47 (TZ1)
Risk Reward: 1:1.5

OII Bullish9ema is crossing the 20 ema and the MACD is just about to cross. The current price is at the POC (DEC.31) and it tested the 50% fib level yesterday. I think this is a long swing on the break of the the 50% fibonacci level (10.16) targeting $11.26 then 12.07

OII for a potential breakaway?As you can see we have strong support represented by green with a potential to break through the resistance and see prices surge $13+.
Let me know what you guys think in the comments below!
Have a great day traders!

OII for 13$?OII could see a spike past current resistance and shoot to 13$ for pre-covid price.
let me know what you guys think in the comments!

quick TA lines basic key trend with S/R lines. Looks like a good long play for short/mid. Scale in as it goes lower if you think the worlds not gonna end just yet ;)

Oceaneering Awarded Riserless Light Well Intervention Contract bOII: Oceaneering International, Inc.
2020-02-10 17:00:00
Oceaneering Awarded Riserless Light Well Intervention Contract by BP

Oceaneering Awarded Contract to Supply Umbilicals and DistributiOII: Oceaneering International, Inc.
2019-06-18 17:30:00
Oceaneering Awarded Contract to Supply Umbilicals and Distribution Hardware for Mozambique LNG Project
OII Shorta company leveraged on top of an unclear commodity... is a huge liability...
slow profit
dead margins
hard to explain existence for Oil at this price.
the froth is cool.

Oceaneering Announces Petrobras Drill Pipe Riser Systems ContracOII: Oceaneering International, Inc.
2018-08-20 07:01:00
Oceaneering Announces Petrobras Drill Pipe Riser Systems Contract


double top with 3/4 pullbackDouble top with a 3/4 pullback (natural movement in price) to take prices lower.
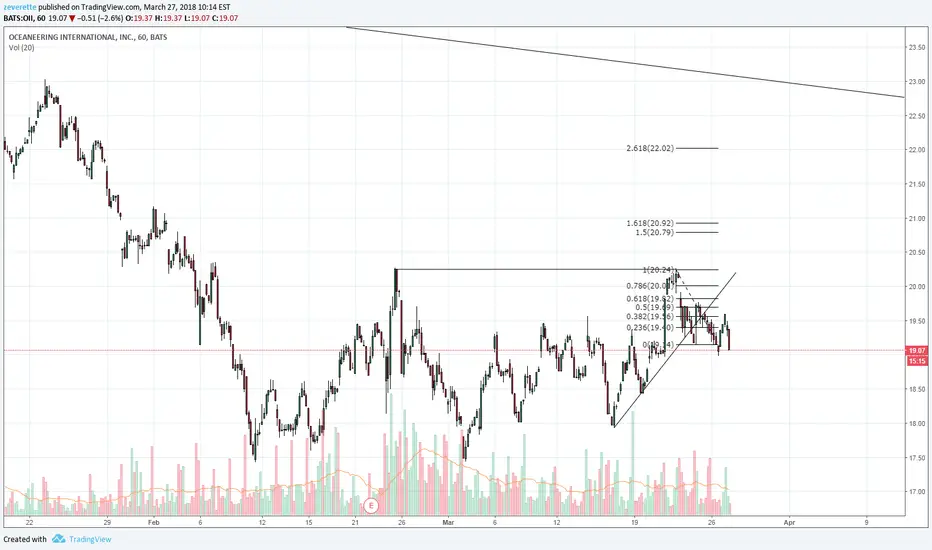
easy play, sell OII I have a short position in Oii, i will add more to my position tomorrow at ny open, with a stop at 23.12 with the initial target for all times low at 19.82. Following that oill will continue the bear market.

