The Art of the Liquidity BuildIt’s the same progression, repeating again and again on multiple different time frames.
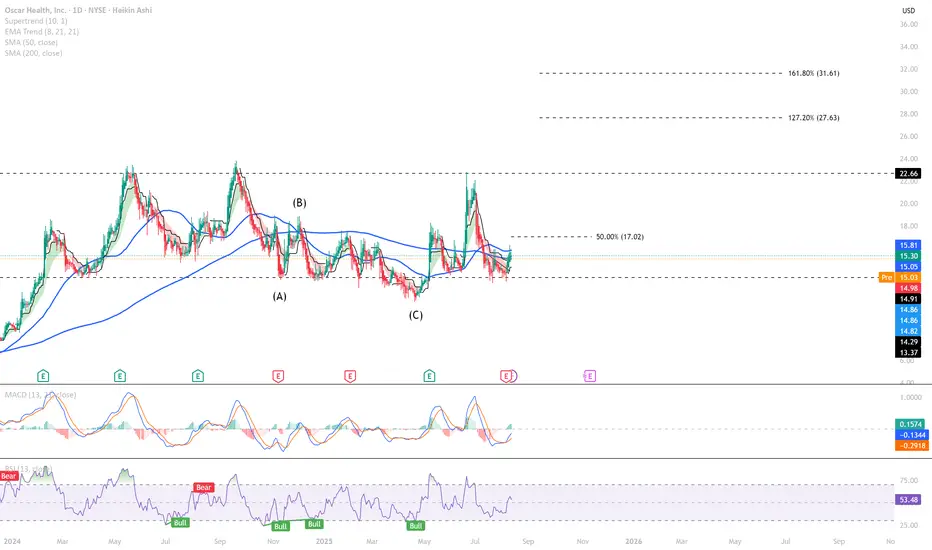
In this crazy looking chart, I essentially just color code the different stages of the liquidity build. Each box represents a stage in the cycle - and when you see it clearly, it’s almost too obvious:
Strong Selling (Red) → Selling (Orange) → Taper (White) → Buying (Green) → Strong Buying (Yellow)
Confirmation of increasing volume during the white --> green changeover.
A basic "Head and Shoulders" or "Cup" pattern. You'll see this same thing each time. Price intentionally proves each stage and sets itself up for the next algorithm on the next timeframe!
Notice the volume get's increasingly large once the white begins the pass over to green!
Oh, and I'm very bullish on OSCR - As usual - But especially with the proving of white and breakout of orange. Anything below $16 is a freebee for me!
Price Prediction: $30 by April 15th
*For those who like Fibonacci - line it up. It's beautiful
Happy Trading :)
Market insights

OSCR - I love it. As you may know if you've seen one of my many OSCR posts in the past, I have a strong bias toward this company as a long time shareholder and treat any trade I make here as a long term position. This is only my opinion and analysis so please do your own analysis and always trade with patience and intention.
If anyone sees this differently, I'd appreciate to hear a convincing long term bear case here. I know I'm completely blinded on this one and that's where traders could get trapped!
That being said, the signs and timeframes are all aligning on this one:
- Recent volume and volatility increase (good for growth company and signals start up for a HTF trend continuation. We've get the necessary liquidity for now.)
- RSI crossing 50 Weekly & Daily
- MacD crossing 0 Weekly & Daily
- CMF crossing 0! Weekly & Daily!
This is a massive indication of a move - look back at any previous V-shape recoveries above 0 like this - always precedes a large breakout.
- 50% HTF Fib ($13.15) is major support level and recently proven with the gap up.
- And my favorite - The algorithms are presenting themselves beautifully. We are initiating buying continuation and that is the key to sustain the breakout of a HTF algorithm like orange.
I highlight the yellow flip zone as our trade confirmation area.
$17.23 - $18.77.
Below, better price, potential to enter in the $15's potentially or maybe a dig to $14 to try and close gap?
Above, big confirmation and immediate room to $21-24.
This zone is a Middle-time-frame liquidity pool set up within a HTF taper structure allowing for a larger move and that in the future can act as a near or long term support beam and liquidity pool if necessary.
I'm not a massive indicator user but I do check them out for a position like this and they look primed on all fronts.
Happy Trading :)

$OSCR IS TOO CHEAP AND UNDERVALUED Oscar Health Rides a Wave of Political Optimism, Emerging as a Top Performer
Oscar Health (NYSE: OSCR) solidified its position as one of the market's standout gainers on Monday, propelled by a surge of optimism stemming from unexpected developments in Washington D.C. The catalyst for this upward move was an announcement from the Trump administration indicating a potential compromise to extend crucial Affordable Care Act (ACA) subsidies for a temporary period.
This news served as a powerful positive shock to the market, directly addressing a primary concern that has weighed heavily on Oscar Health's stock for weeks. During the government shutdown throughout October and early November, investor sentiment was dampened by the fear that political gridlock would prevent the extension of these vital premium subsidies. Such an outcome would have created significant headwinds for Oscar's core business model, which is heavily leveraged to the ACA marketplace.
While it is critical to note that, like many of its peers in the health insurance sector, Oscar's share price remains substantially below its October highs, this latest political development injects a much-needed glimmer of hope. It suggests that the worst-case scenario of an immediate subsidy cliff may be averted, providing the company with a more stable, albeit temporary, operational runway.
Technical Analysis and Market Outlook
From a chart perspective, this fundamental catalyst appears to be triggering a technically significant price movement. The stock is currently exhibiting the early characteristics of a potential reversal pattern, breaking a prior sequence of lower highs and lower lows. This bullish momentum, fueled by the positive news, suggests that the established support and resistance levels remain critically valid and are now being tested with renewed conviction.
For investors and traders, this confluence of a positive fundamental catalyst and a budding technical reversal pattern presents a compelling case. The stock, which many perceive as fundamentally undervalued after its sharp decline, may now be entering a phase of re-rating. The key for sustaining this upward trajectory will be for the price to firmly hold above recent support levels and challenge the next layers of overhead resistance, confirming that this is more than a short-lived relief rally and the beginning of a more sustained recovery.
QS V3 Alert: OSCR Overextended, Katy AI Signals Strong DownsideOSCR QuantSignals V3 | Weekly Prediction
Current Price: $14.37
Predicted Price: $13.67 (-4.89% by 11/21), down to $13.44 (-6.50% by 11/24)
Trend: Bearish (despite weekly composite guidance of BUY CALLS)
Confidence: 55%
Weekly Momentum: +1.70% (overextended, potential pullback)
Trade Signal:
Direction: PUT / SHORT
Expiry: 2025-11-28 (8 days)
Strike: $14.00
Entry Price: $0.68
Target 1: $1.02 (50% gain)
Target 2: $1.36 (100% gain)
Stop Loss: $0.48 (30% risk)
Position Size: 2% of portfolio (reduced due to conflict between Katy AI and composite signal)
Analysis Summary:
Katy AI predicts strong downward movement with high-frequency forecasts: 96 consecutive bearish points.
Technicals: Price near session highs, VWAP $14.22, weekly momentum overextended.
Options Flow: Neutral, low gamma risk, no unusual activity.
Risk: High due to low confidence (50%) and directional conflict with composite signal.
Competitive Edge:
Katy AI’s predictive model gives early insight into potential overextended weekly reversal.
Strike selection balances risk/reward with 0.645 delta.
Tight stop and small position sizing mitigate exposure.
Important Notes:
This trade contradicts composite weekly guidance; extreme caution advised.
Monitor for sudden bullish news; early exit if Target 1 is reached in first 3 days.
Consider further reducing position size if VIX rises above 25.

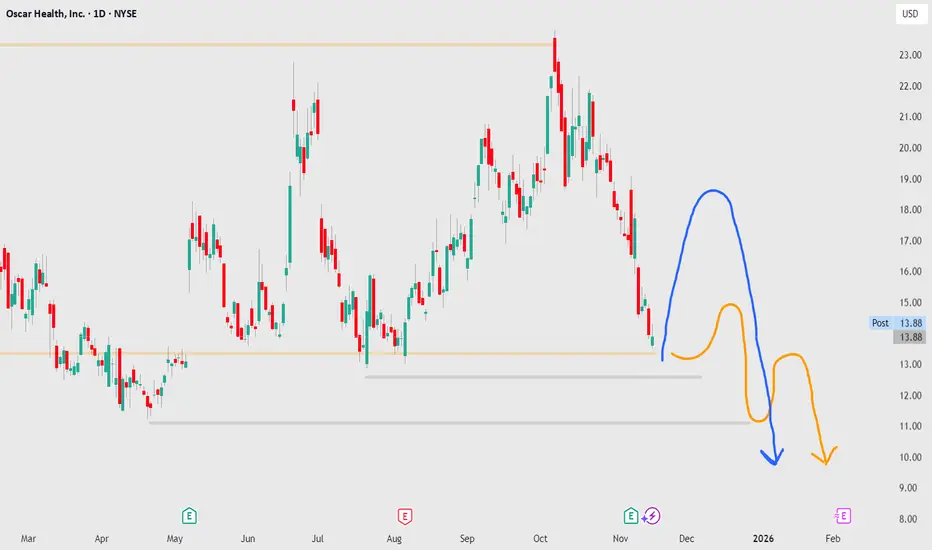
OSCR to below $11 long-termTo be treated as a downtrend.
Currently in a Weekly sideways trend. Price may bounce the bottom of the orange line, and rally higher (50-60% of the range) then fall lower.
Or the recent downtrend may continue lower, with normal sized pullbacks, and continuations lower.
Gaps up / down may give much more clarity as to the short-term direction.
Not bullish on OSCR. Since we're at the bottom of the range, expect buying / demand.
Then watch to see what that demand does. Quite possible, short-term traders will buy and sell rather quickly. When their rally rolls over, you can look at shorting the topping pattern and target the bottom of the range and lower.
Lines drawn are just 2 ways price may develop (big picture).
Blue line may be better if interested to short, as you'll get a better price + closer to resistance.
Orange line, shorting can work as long as trade is watched closely. Usually not a good idea to short a support level. Unless it rejects off of it. One example. Break down below support, retest, short here. Or wait for 2nd breakdown (the breakdown of the lower low, followed by the retest, and break beneath the lower low) and short here.
$OSCRExecutive Summary:
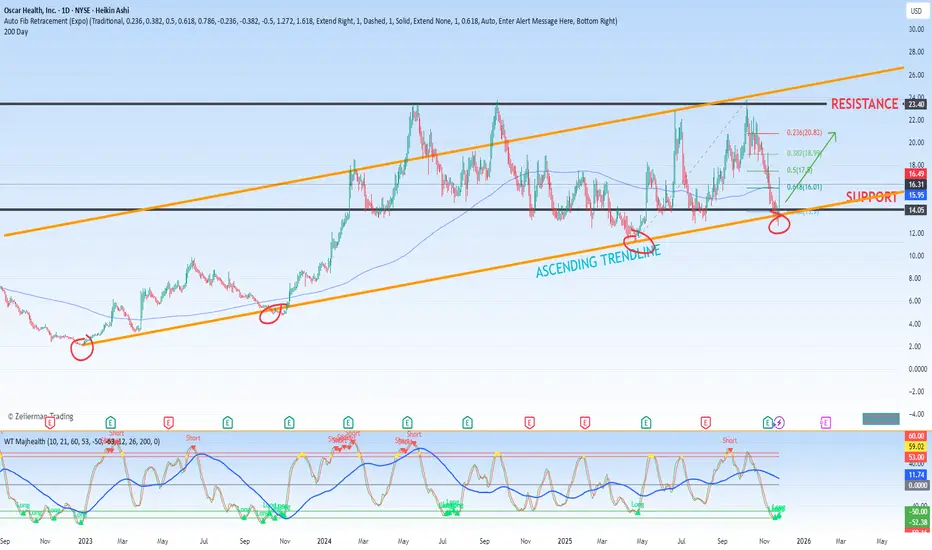
Oscar Health, Inc. ( NYSE:OSCR ) presents a compelling technical setup suggesting a period of consolidation within a well-defined range. After a significant prior move, the stock is currently digesting gains and building a base for its next potential directional shift. Key Fibonacci retracement levels have provided both resistance and support, mapping out a clear roadmap for traders. The prevailing thesis is that NYSE:OSCR is an undervalued asset, and its current technical posture offers a strategic opportunity for accumulation near strong support levels, with a primary buy zone identified at the $14.00 level.
Detailed Technical Breakdown:
1. Established Trading Range:
The stock has entered a phase of equilibrium, characterized by a clear consolidation pattern. The boundaries of this pattern are distinct:
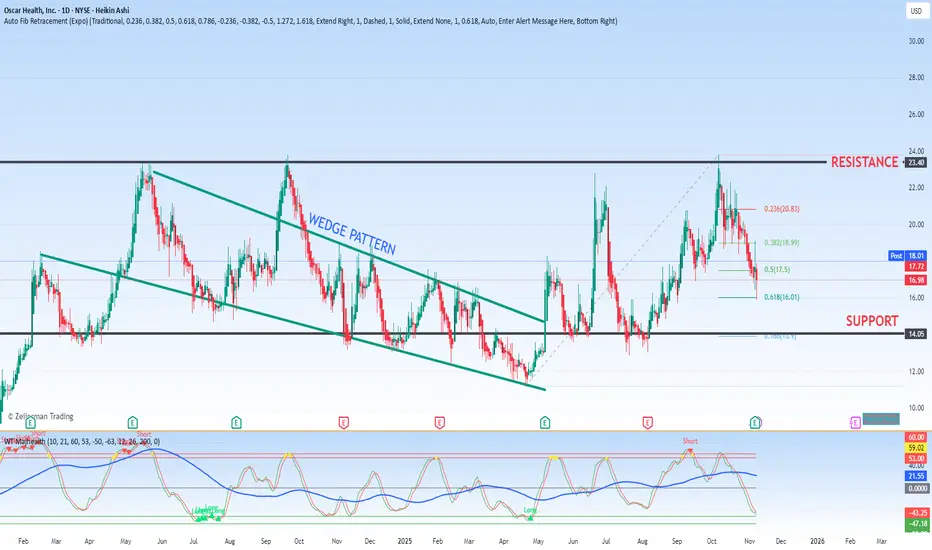
Upper Resistance: The $24.00 level has proven to be a significant technical and psychological barrier. On multiple attempts, the stock has been rejected from this zone, establishing it as a key ceiling for the current trend.
Lower Support: Conversely, the $14.00 level has acted as a robust floor. Each time the stock has declined to this region, buying interest has emerged, preventing a further breakdown and solidifying its role as a primary support level.
This consolidation between $14 and $24 indicates a battle between buyers and sellers, with neither side able to assert dominance. Such phases often precede a significant breakout once the market reaches a consensus.
2. Critical Fibonacci Retracement Analysis:
Applying Fibonacci retracement levels to a relevant prior price swing provides a mathematical framework for identifying potential reversal zones. The recent price action has interacted precisely with these key levels, validating their importance:
23.6% Level ($20.78): This level initially acted as a minor resistance point during the consolidation. A failure to hold above this level often signals a deeper retracement is underway.
38.2% Level ($18.95): Widely regarded as a shallow, yet significant, retracement level. The stock's interaction with $18.95 served as a confirmation that the pullback from the resistance was gaining momentum.
50.0% Level ($17.47): The halfway point of the prior move is a classic level for market indecision. A breach below this level, as witnessed, shifted the near-term bias to the downside, targeting the deeper Fibonacci supports.
61.8% Level ($15.99): Known as the "Golden Ratio," this is one of the most critical Fibonacci levels. It represents a deep retracement that often holds in healthy pullbacks. The fact that the price has already tested and moved through this level indicates that the sell-off has brought the stock into a deeply oversold territory relative to its prior swing.
3. Primary Investment Opportunity & Strategic Outlook:
The convergence of the strong horizontal support at $14.00 and the completion of a deep Fibonacci retracement sequence creates a high-probability investment zone. With the key Fibonacci levels (23.6% to 61.8%) now in the rearview mirror, the focus shifts squarely to the ultimate support at $14.00.
This level represents the optimal area for strategic accumulation. A successful bounce from this zone would not only reaffirm the long-term support structure but also potentially initiate a new upward leg back towards the upper end of the trading range, targeting the $18.95 (38.2% Fib) and ultimately the $24.00 resistance level.
In conclusion, the technical evidence suggests NYSE:OSCR is forging a solid base. While the path of least resistance has been downward within the range, the stock is approaching a critical juncture where risk and reward become highly favorable. A disciplined approach would be to target entry points as the price approaches the strong $14.00 support, with a clear invalidation point should that level fail to hold.
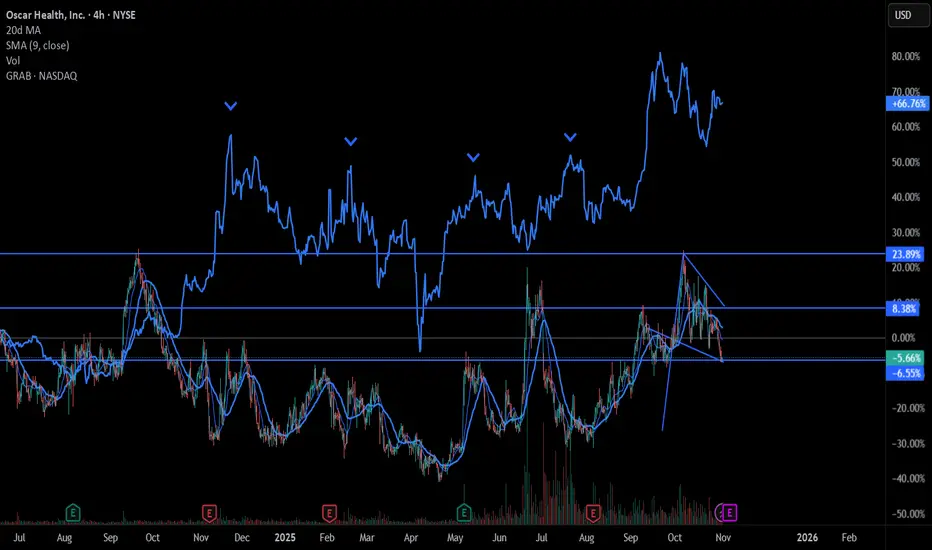
$OSCR Setting Up for a $GRAB-Style Breakout I'm calling this one early. NYSE:OSCR is mirroring the exact 4-peak formation NASDAQ:GRAB just broke out from. NASDAQ:GRAB tapped $6 four times, then blasted off on earnings. Now NYSE:OSCR is building the same pattern at $17, sitting right at the bottom of Bollinger band. RSI has cooled off but IV is sky high walking into earnings. Add in ACA and Nov 6th earnings we have real catalyst. Calm before the storm. Who's in? 30's 📈🚀
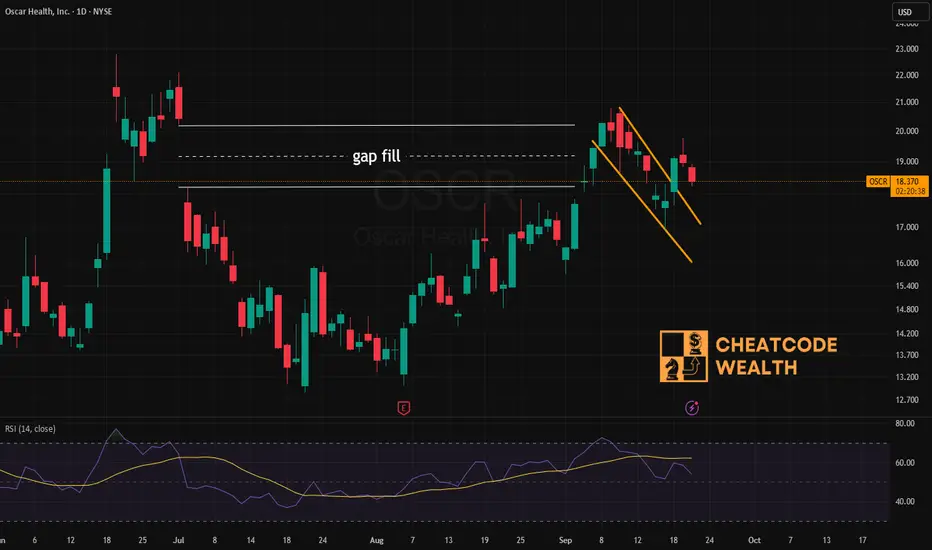
$OSCR Gap filled and bull flag retest in developmentThe gap has been filled, it appears that a minor bull flag is being retested
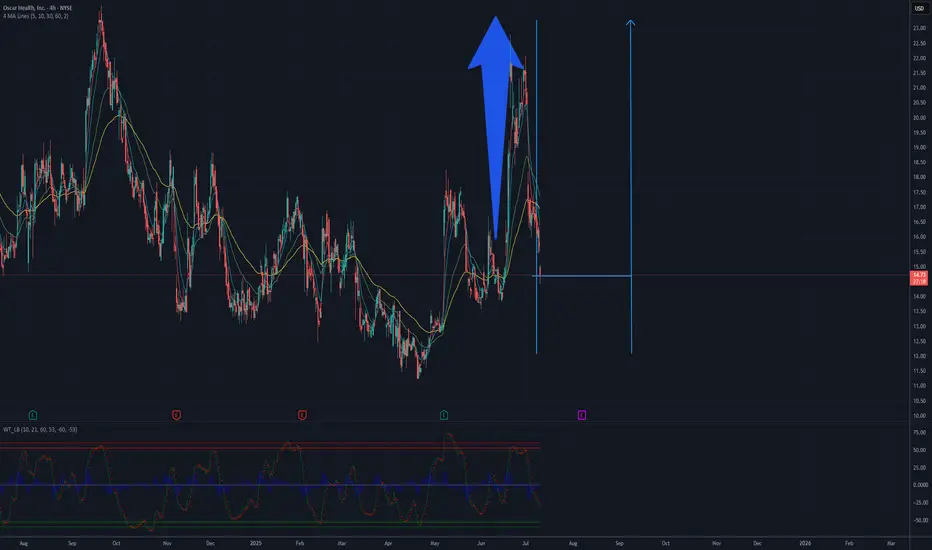
Potential Upside for OSCR.US – Targeting $23Oscar Health (OSCR.US) is currently trading near the technical support zone of $14–$15, a level that has historically acted as a base for rebounds. In May and June 2025, the stock saw sharp upward movements, breaking through the $20 mark, which confirms strong bullish potential. The current pullback may offer a buying opportunity before another upward leg. Once the resistance at $18–$20 is cleared, a move toward $23 — the September 2024 high — appears achievable. This scenario is supported by the technical setup and past price reactions at these levels.
Potential TP: 23 usd
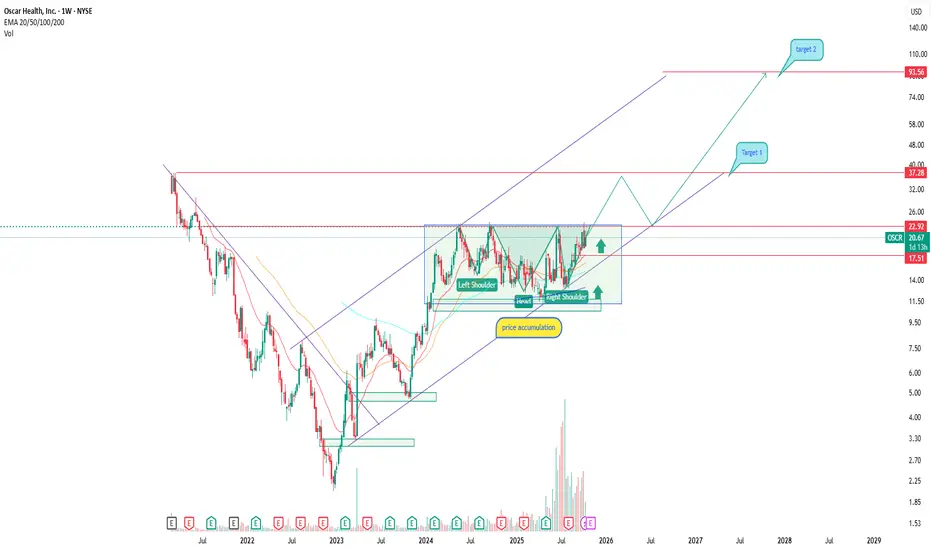
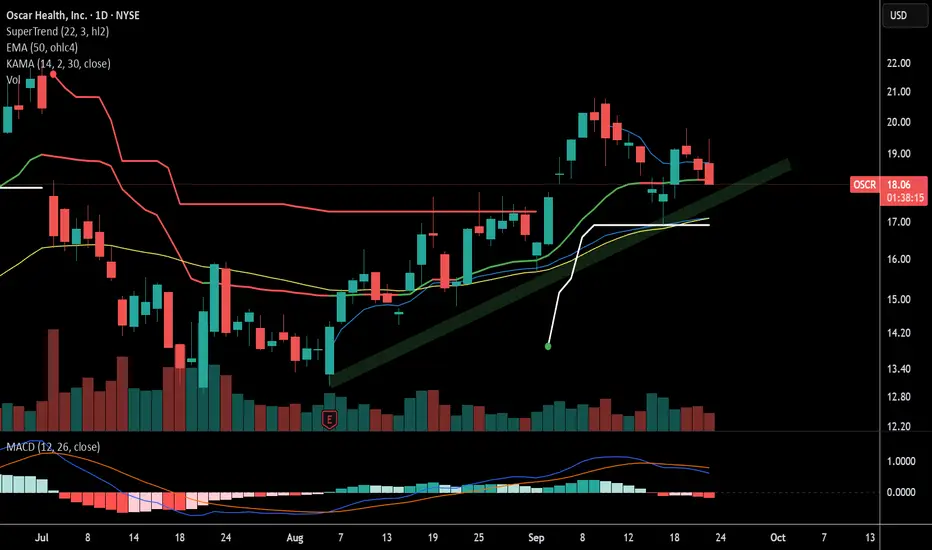
OSCR breakout from accumulation and start of a new trendOscar Health (NYSE: OSCR) is emerging as one of the more interesting names in the U.S. healthcare insurance sector. After an extended accumulation phase, the stock has broken out and is now trading above its major EMAs (50/100/200), confirming a structural shift toward a bullish trend.
The pattern resembles an inverse head and shoulders, with the 17.50–20.00 area acting as strong base support. A confirmed breakout above this zone sets the stage for a move toward 37.78 (Target 1) and potentially 93.55 (Target 2) — the upper boundary of the mid-term ascending channel.
Fundamentally, The company continues to grow its customer base and improve margins after strategic restructuring. Its shift toward tech-driven insurance solutions and partnerships with major healthcare providers strengthen its position. Recent earnings reports show narrowing losses and revenue stabilization — a sign of operational progress.
This looks like the early stage of a longer recovery cycle: the market is moving out of accumulation, but confirmation above 20.00–25.00 is crucial. As always — stay disciplined and trade by structure, not emotion.
OSCR longWe got another trump dip and I took the opportunity to update this chart. We were deep into supply on the dip after a strong breakout. I have added shares here, nothing about this company is effected by tariffs. This is a perfect retest of a breakout.

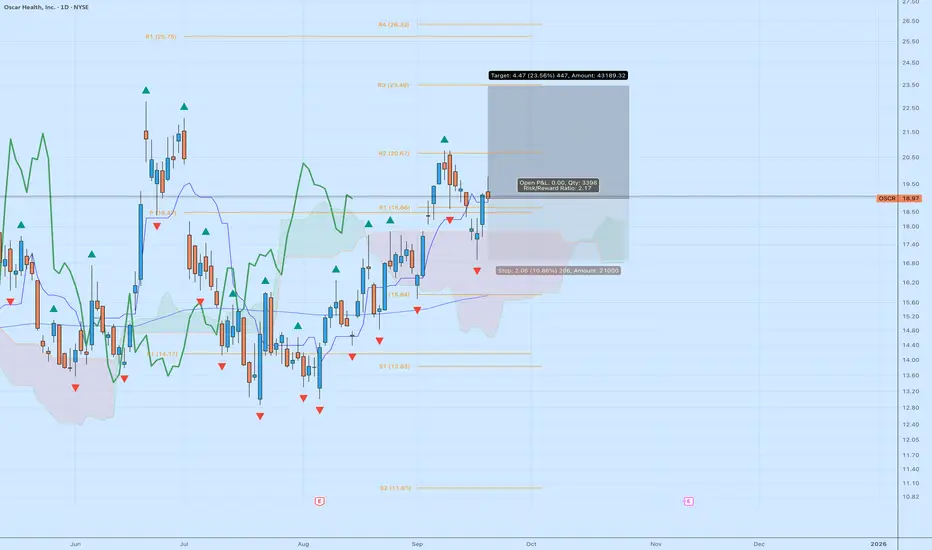
Oscar Health (OSCR) – Risk/Reward Setup Worth WatchingI’m tracking a long setup on NYSE:OSCR after a strong recovery trend that has been quietly building since the summer. It’s carving out a technical structure that offers a clean risk/reward.
Company Context
Oscar Health is a tech-driven health insurance company that’s been rebuilding its story in 2024–2025. With a focus on digital-first healthcare plans and partnerships, it’s been reducing losses and narrowing its path toward profitability. Investors are beginning to treat it less like a speculative health-tech play and more like a managed care turnaround. That shift alone can fuel momentum as institutions re-rate the name.
Technical Breakdown
Entry Zone: Around $18.90, just above the daily pivot (P: $18.51) and prior breakout support at $18.66.
Ichimoku Cloud: Price is holding above the cloud, with the leading span showing a bullish tilt. This suggests trend support into October if buyers defend current levels.
Moving Averages: OSCR is trading above its 50-day average and bouncing off the short-term Kijun line — a healthy pullback/retest dynamic.
R Levels: Resistance to watch sits at R2 ($20.67) and R3 ($23.49). Targeting these aligns with a potential 23% upside move.
Stop Placement: My risk is anchored near $16.80–$17.00 (just below R1/Pivot cluster and cloud support). That’s roughly -11%.
Reward: Upside target $23.49–$24.00 gives ~+23%. That’s a 2.1:1 reward-to-risk profile.
Why It’s Interesting
OSCR has been building higher lows since May, which is constructive in a volatile market.
The current consolidation looks like a platform for continuation, especially if it can break and hold above $20.
Liquidity is decent for a mid-cap, and options flow has been showing unusual activity recently (call side).
Risks to Monitor
As an insurance stock, OSCR is tied to regulatory headlines and policy changes.
Earnings volatility can be sharp — a stop discipline is key here.
Broader market sentiment could swamp this setup if risk-off flows dominate.
My Take:
This isn’t a “bet the farm” play, but OSCR gives traders a very tradable setup: clear support, well-defined stop, and room to run into the low $20s. As long as it holds above the cloud and the $18 pivot zone, I like the long bias.
OSCR last tricks before leaving the accumulation rangeAs said in the title, if you look at this graph there is clearly a re-accumulation to be spotted here. And by the looks of it we are finishing up. I think there is a high probability that this will start a new uptrend. Especially with SP:S5HLTH also starting to show signs of strength.
DYOR.

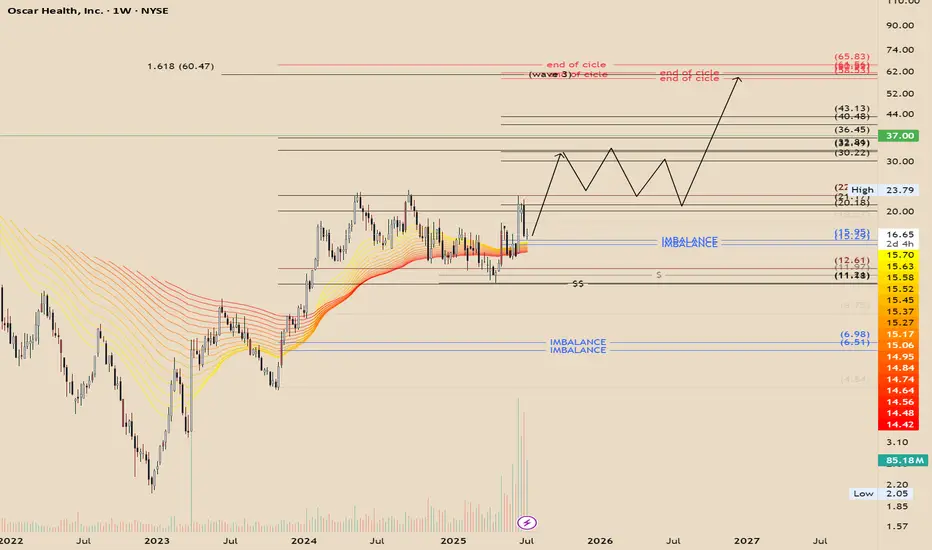
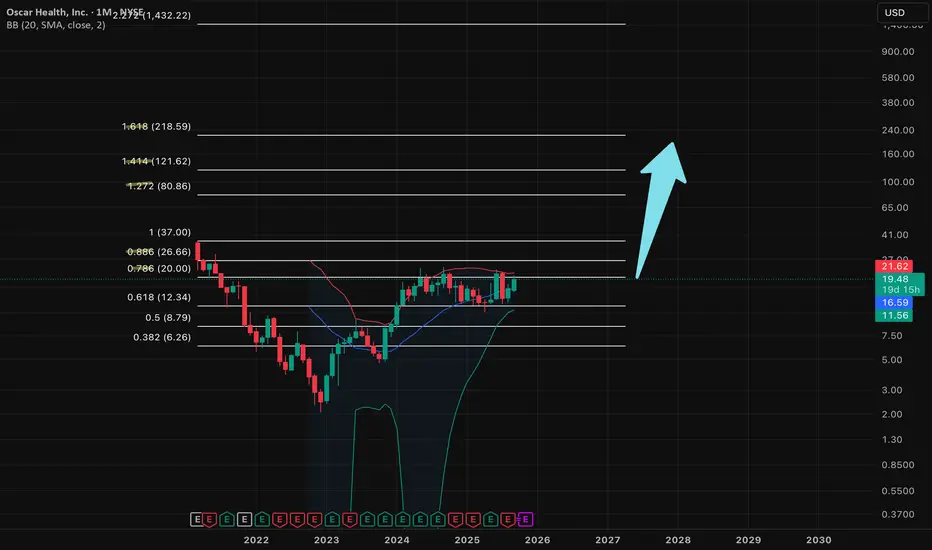
OSCR - Cyclical Expansion and Algorithmic ConfluenceOscar Health moves in cycles. It's possible to observe algorithmic confluence with the 3rd extension at 1.618 (~$60). The price reacted to the algorithmic expansion channel as expected and retraced to the equilibrium of the weekly bullish breaker. Therefore, the price behavior I anticipate is an aggressive expansion toward the next algorithmic level around $30, potential consolidation thereafter, and a final expansion toward the end-of-cycle target in the $60s.
This analysis is purely speculative and for educational purposes only.
$OSCR is struggling short termNYSE:OSCR is supported on kama now. But I dont like price action here. Closed swing position as it feels like to test green uptrend zone at 17.60
OSCR gap and refillOSCR pumped way past target one and pushed into the weekly supply. The gap was filled to the upside, but we will likely retrace this move. Most of this is already completed, we will likely wick below 17.5$.
My plan:
Possibly shares and cash secured puts around 17$, I have a large LEAP call spread in play
$oscr is getting ready to pull of some huge growth!NYSE:OSCR is trying to break the 0.786, ones it does this it will move up to the 0.886 and break the previous ATH. After some consolidation it will reach the 1.618.
OSCR gap closureOSCR has filled the daily gap and quickly met our nearly two price targets. I have taken lots of profits and converted my exposure to purely LEAP call spreads to preserve capital. I still believe we will see 22$ soon, and UNH pumping might also drag us up. A golden fib extension is around 25$, but my target for the year is $35.
OSCR: back to support and now it’s decision timeAfter the recent impulse move, OSCR has pulled back to a key support zone around 13.65. That area aligns with the 0.79 Fib retracement, a horizontal level from spring, and a rising trendline that has already triggered reversals in the past. The structure is still intact, and buyers are testing the level again. If support holds and we get a bullish confirmation, the next target is 17.01, followed by a potential breakout toward the high at 22.81.
Volume remains elevated, the overall structure is healthy, and the correction is controlled. A break below 13.00 would invalidate the setup - until then, it’s a clean, high-reward zone with tight risk.
Fundamentally, Oscar Health has revised its 2025 guidance: revenue is expected in the $12–12.2B range, with operating losses projected between $200M and $300M. Despite softening topline growth, earnings per share are improving, and investor sentiment has been shifting. Technical strength is also reflected in the recent rise in RS Rating to 93, confirming that the stock is showing relative leadership even as the market cools.
This is one of those setups where both technicals and narrative are aligning - now we just need confirmation from the chart.

Oscar Health has great linesI have 20 call options for NYSE:OSCR just to be transparent. The strike price is $15, exp March 2026. This one has some really good simple chart structure and solid fundamentals. I'll be watching this to break the $18.13 in the next few days. It could quickly sweep up into the $20's and then retrace back down.
But, I do like this company and this stock is way undervalued if you really dig into the details.

Trade Setup Description – OSCR (Oscar Health)!📝
Ticker: OSCR
Timeframe: 30m chart (short-term view)
Current Price: $16.81 (+19.77%)
🔍 Technical Breakdown
Chart Pattern: Price recently bounced from support around $16.00 and broke above a short-term trendline (ascending triangle setup).
Key Levels:
Support: $16.00 (white line – prior demand zone)
Immediate Resistance: $17.33 (red line – trendline + prior supply)
Target Zone: $18.14 (green line – measured move projection / resistance)
Risk Zone (Stop): Below $16.40–$16.50 (yellow/white lines show key invalidation level).
🎯 Trade Idea
Entry: Break & hold above $16.80–$17.00 zone.
Target: $18.14 (approx. +8% upside from entry).
Stop-Loss: $16.40 (risk of ~2.5%).
Risk/Reward Ratio: ~1:3 (favorable).
⚡ Momentum Note
Stock is up nearly +20% today, showing strong relative strength.
Breakout confirmation above $17.33 could trigger momentum buying toward $18+.
Watch volume: sustained high volume supports continuation.
📌 Summary:
OSCR is setting up a bullish breakout with clear support at $16.40 and resistance at $17.33. A successful breakout may open the path toward $18.14. Risk management is crucial given today’s volatility.

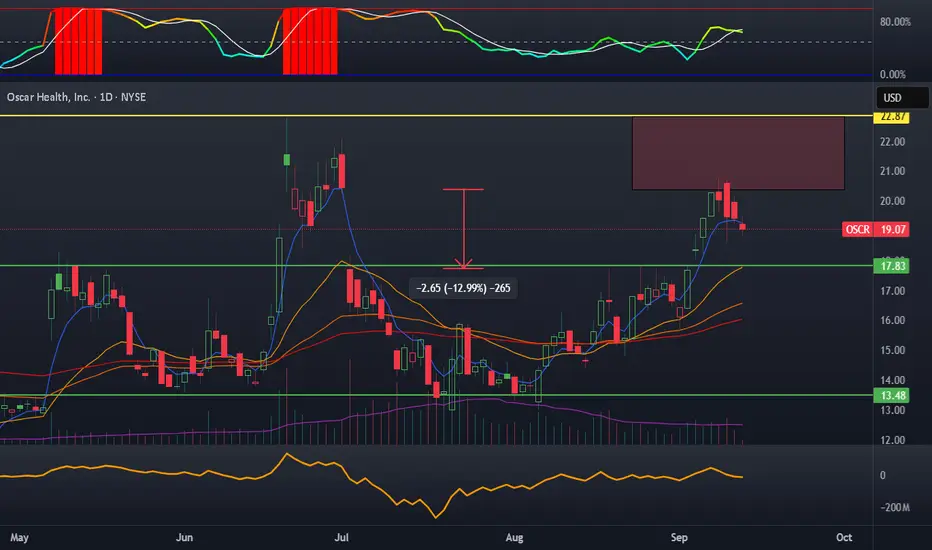
OSCR runningOSCR is on the move again. I have noted the greater range, but we have had trouble getting right back to the zone. I have created a target before the larger macro range setup. If you are short-term trading this, this would be a safer zone to exit.
My plan:
I was assigned most of my shares with cash-secured puts as we approached the bottom of the range, which gave me leeway with an adjusted basis.
I have sold multiple rounds of unassigned covered calls
I am finally at threat of assignment at 16 and 17$ strikes, I am fine with this
I have 17/20$ September spread long calls to cover this upside move and 25% of my shares are uncovered

Aggressive pricing after ACA Hit.Oscar Health took a major hit this year due to ACA-related votes and sector headwinds, leading to sharp price declines.
The stock broke its downtrend aggressively, signaling strong momentum, although the pullback has also been volatile.
Oscar currently trades far below its estimated fair value of $18–$20, making the price look attractive for a recovery.
For bullish confirmation, I want to see clear closes above $17 – the 50% Fibonacci retracement between the wave 1 high and wave 2 low. Only then would I expect wave 3 to be underway.
Without this technical confirmation, my bias remains neutral.