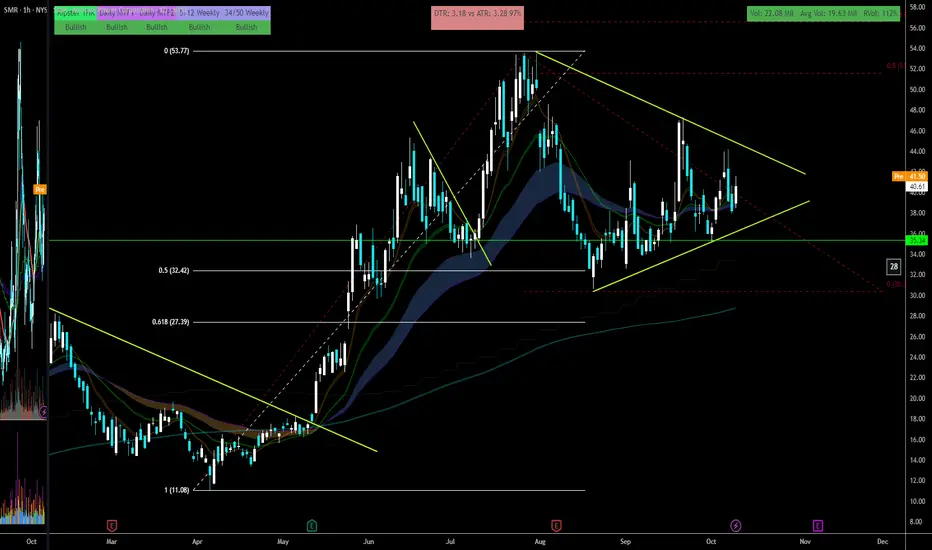
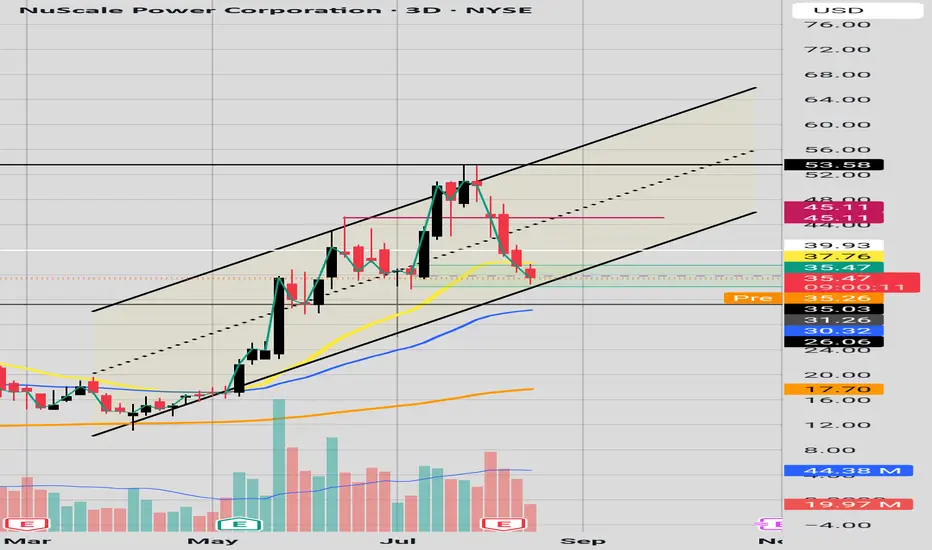
$SMRThe technical structure for NYSE:SMR presents a compelling case of a strong, sustained uptrend, characterized by a rhythmic pattern of sharp advances followed by periods of consolidation. This behaviour is the hallmark of a healthy, momentum-driven bull move.
1. Pattern Analysis: Sequential Bull Flags
The chart reveals the successful completion and continuation of a classic bullish pattern sequence:
The First Bull Flag: This pattern likely began with a powerful upward move (the "flagpole"), followed by a brief, shallow, and downward-sloping consolidation period (the "flag"). The successful breakout above this first flag confirmed the pattern and signaled the resumption of the uptrend. Your note that this first pattern "has been a success" is a key observation that sets a bullish precedent.
The Emerging Second Bull Flag: Following the initial breakout, the price action appears to be forming a second, successive bull flag. This pattern represents a temporary pause and period of profit-taking within a larger uptrend. It indicates that after a strong leg up, the market is catching its breath, allowing overbought conditions to ease before the next potential advance. We are currently in the "waiting" phase for this second pattern to fully reveal itself and confirm with a breakout.
2. Fibonacci Retracement: Mapping the Pullback and Target
Applying Fibonacci retracement levels to the most significant prior upswing provides a mathematical framework for understanding the corrections and projecting future targets.
The current consolidation within the second bull flag has already respected key Fibonacci levels, finding support and reversing near them:
0.236 Level ($44.30): This shallow level was easily passed, indicating a healthy correction.
0.382 Level ($36.18): This is a common retracement zone in a strong trend, and the price action here likely provided a key support area.
0.500 Level ($29.62): A deeper, but still within the normal, retracement level. Holding above this level would be considered a sign of continued strength.
The analysis points to the 0.618 Fibonacci retracement level at $23.05 as the primary target for the overall pattern. This level is a deep retracement and often acts as a critical support or resistance zone. In this context, it represents a significant profit-taking objective once the second bull flag completes its breakout and resumes the upward trajectory.
3. The Overall Narrative and Key Levels to Watch
The story for NYSE:SMR is one of a powerful, structured uptrend building energy for its next move.
The Bullish Narrative: The successful first bull flag established a pattern of "burst and consolidate." The formation of a second such pattern suggests the trend is well-organized and has further to run. The measured move projection from the second flag, upon a breakout, aligns with the $23.05 (0.618 Fib) target.
The Outlook After the Target: It is prudent to anticipate that upon reaching the $23.05 target, the stock will likely experience a significant pullback or period of extended consolidation. This is a typical market behavior as traders lock in profits at a major Fibonacci level.
Conclusion and Strategy:
Confirmation Trigger: A decisive breakout above the resistance trendline of the current, second bull flag pattern is needed to confirm the next leg up is beginning.
Primary Target: The initial upside target for this next leg is projected at the $23.05 level.
Risk Management: A break below the support trendline of the second flag would invalidate the short-term bullish pattern and suggest a deeper correction is underway.
In summary, NYSE:SMR is exhibiting technically sound bullish behavior. The focus is now on the completion of the second bull flag, with a breakout setting the stage for a move toward the $23.05 Fibonacci target, after which a pullback is considered a high probability.
Trade ideas

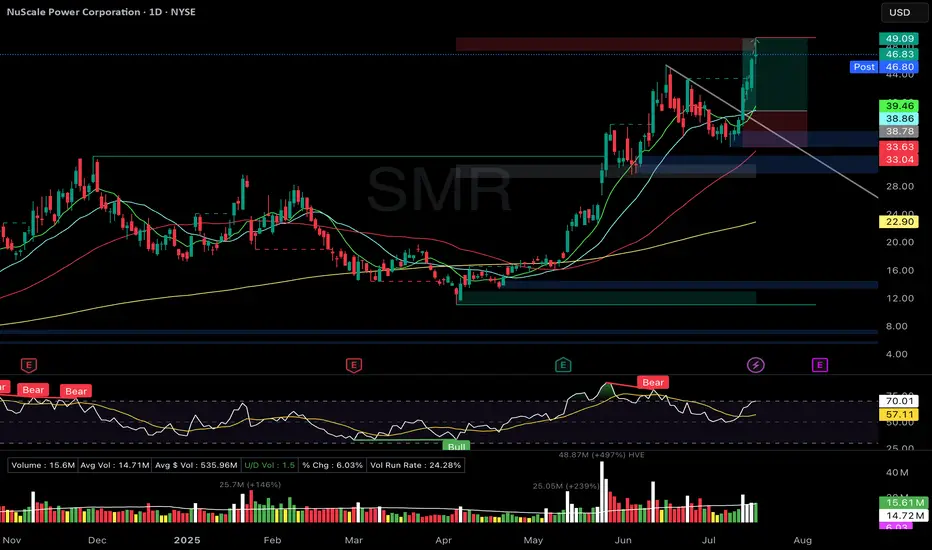
Where Could This Downtrend Finally End?This is my thoughts on SMR as a cycle perspective. If we connect the lows from April 2024, September 2024, and April 2025, we can draw a clear uptrend line. Each of those lows occurred after SMR had dropped about 55–58% from the previous high.
Currently, the stock has fallen roughly 55% again and is now touching that same trendline. On the 4-hour chart, the RSI has entered the oversold zone, dropping below 30. The RSI readings at each of the past lows were 39, 33, 28, and now it sits at 26.
From a cycle standpoint, I believe SMR is approaching a bottom area. If this trendline breaks easily, it could signal a confirmed shift into a downtrend.
On the other hand, SMR is under downward pressure from its recent equity offering, and growing skepticism toward the broader AI sector adds further risk.
If you follow my post logic, and if you decides to buy here, it’s crucial to exit all positions immediately if the trendline breaks.

I held off as long as I could -- long at 34.72I have only so much willpower and only so much fear of market corrections. Both were exceeded today. I do not argue that this stock is overvalued based on its current business. I can make a case for its long term positive future (AI needs SOOOOOOO much energy while we apparently think it's a good idea to squash free energy in this country). Small modular reactors will be part of the energy future globally I suspect both near and especially, long term.
That said, I am a trader, not an investor. A 35% pullback that respected (so far) the most recent low is as much as I can justify waiting on a stock that has produced the gains this one has for me. Could it go down another 15%. I suppose. But I don't think it will before it rebounds, and when this thing rebounds, it makes Nikola Jokic (or insert your favorite NBA rebounder here) look like a child. It has had 5 15% or more single days since June.
It had a chance for a head and shoulders top back in June-Sept and it failed and ran to all time highs. To me this is a steep correction, but not a trans failure 30 is my expected floor here, but anything is possible if the whole market melts down. Regardless, this trend began back at the beginning of 2024 and is still very much intact here. In my perfect world, though, this is a trade that lasts less than a week for me. Tactical adds and sells until final resolution are always a possibility.
As always - this is intended as "edutainment" and my perspective on what I am or would be doing, not a recommendation for you to buy or sell. Act accordingly and invest at your own risk. DYOR and only make investments that make good financial sense for you in your current situation.

Triangle Breakout w confluencesNice Risk Reward in this triangle.
Pros-
+0.5 fib clean retest on 20th august from the move that started 4th April to 31st July top
++VRVP massive shelf at $35.34 so thats a clean defined risk no matter what happens you cut there and you run and dont stop ! Losers can keep holding but thats like $5 risk from here
+++RS compared to SPY for short and long term aliging as per my indicators
++++RSI also moved to my liking here
+The theme is in with AI etc etc power
Cons-
Markets at high so any news can cause panic but that should be accumulating time
Plan-
+Starting half size at $41.50
+Add full on triangle BO or scale in if it falls down to triangle bottom
Risk first everythin else later. No FOMO or maybe little fomo but what are we doing ? we will cut it at 35.4
Target-
TP1- 2R at $50 psych
TP2- 53.77 ATH
TP3 (Dare devils or greedy bastards :) - $56.57 fib extension 0.6 and $72.77 fib 1.0 (I will probably leave runners)
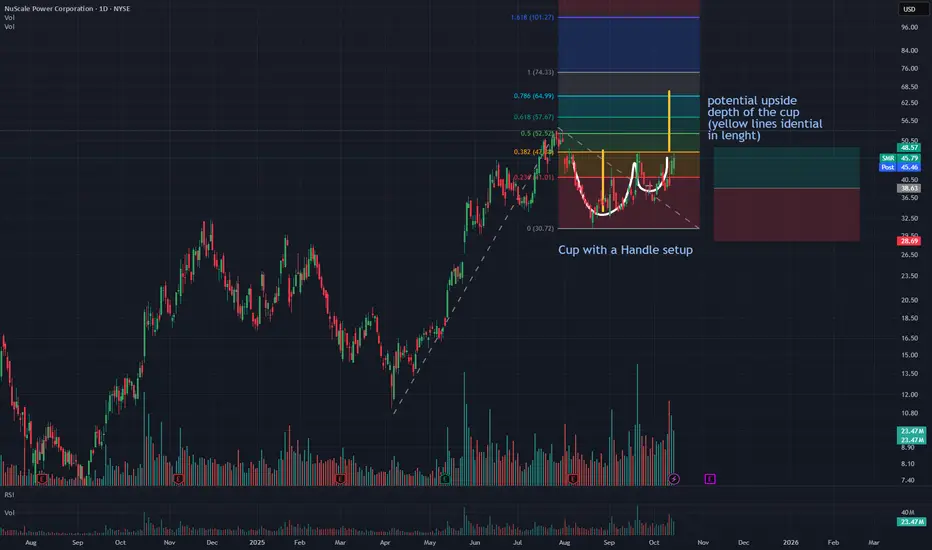
Energy demand and Small Modular Reactors (SMR) Cup with a Handlehere is a clear CUP with a HANDL setup. SMR is in a energy space, where nuclear becomes a new "oil" for AI-thirsty economic driver and electricity is in demand. SMR, while still speculative, as not yet showing any income, while pass all regulations and already have inked contracts. It stands well against competition in its own niche.
Here is a potential set up for any break above what seems resistance level the potential run could be decent. Company set to report quarterly results soon. Full disclosure - I am in.
$SMR WedgeWedge forming with potential breakout either direction. A break below with a close on the daily would be a strong entry either direction.

Give it some timeHas SMR found support?
Is the downtrend over?
Was Tuesday candle a fakeout?
If SMR candle holds and overcome the 36.46$ level, then next challenge may be 38.00$
If not we might see the 34 $ price range.

Filled the gap - are we going back?TL;DR (Summary):
The prominent candlestick gap on the chart has finally been filled. Technical analysis suggests this is a classic setup for a potential reversal. We're targeting a 10% profit, which translates to a price near $42. Risk is well-defined.
Scenario Analysis:
THE GAP: A clear candlestick gap (or window) was formed, indicating a previous imbalance in market equilibrium. Gaps often act like magnets, and statistics show a high probability of them being filled eventually.
THE FILL: The price has now reached and completely filled this gap. This is a key technical event that frequently precedes a significant price movement.
THE REVERSAL POTENTIAL: The gap-fill area now acts as a strong support zone. We anticipate increased buying pressure here as the asset is perceived to be at a better value. Momentum and volume analysis support the likelihood of a bounce.

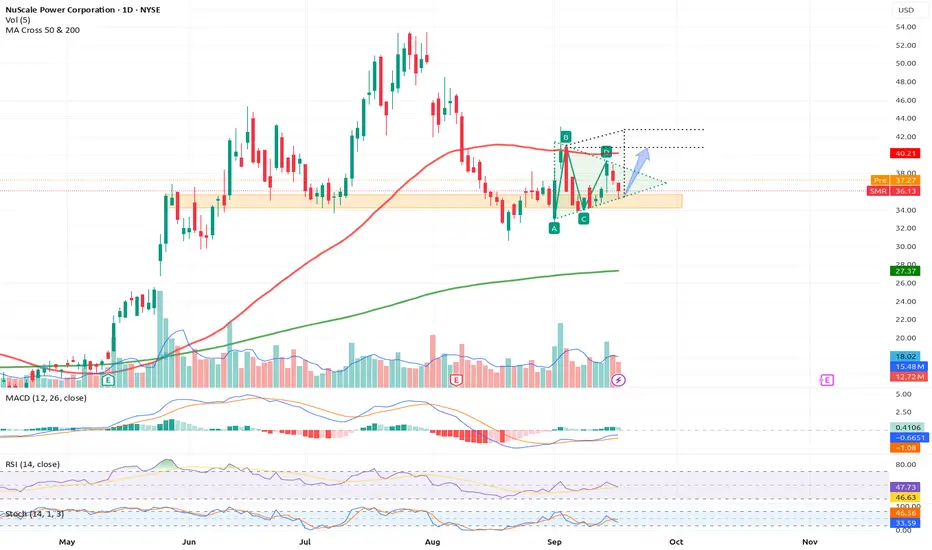
NuScale Power long ideaSimple thesis here built off technicals: recent price decline on lower volume, MACD curling and both RSI and Williams %R ticking higher off oversold lows. A move through the volume shelf (and a close above 36) should signal a 10-15% move higher.

Will SMR Break Out and Reach $40?We have a strong support level and a triangle consolidation pattern.
If it manages to break out and surpass the MA50, reaching $43 is not out of the question.
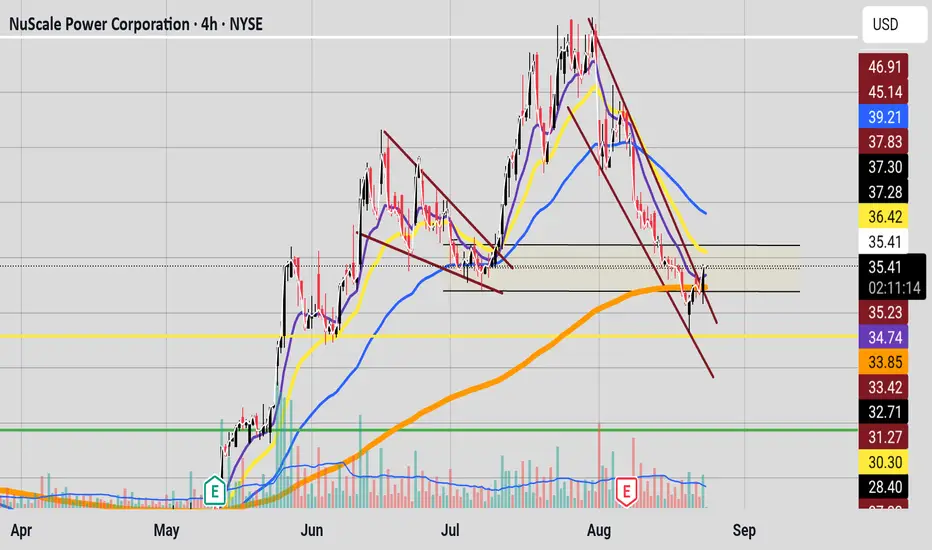
New Setup : $SMRBearish setup on the Daily chart, while the hourly is still bullish.
The trigger will come (if it will come) with both the time frames in a bearish scenario.
Bearish price action and bearish setup for all the EMA.
High Risk, but ready to catch it !

SMR may as well be ASMR for me this year - long at 34.16I missed the signal on this one completely before the close, but it's a rare stock I'm willing to pay up for.
SMR doesn't have a long enough track record for me to rank it among the stocks I have long histories on, but what I can tell you is that it has been an absolute BEAST for me all year. It has absolutely BLOWN AWAY every other stock I trade on both a total gain and per day held basis. The real fun started at the beginning of 2024 for this one, but I chose to only show the trades from this calendar year. Including the earlier ones would have just made these more incredible, though.
Since Jan 1 of this year, I have gotten 13 signals on SMR. All 13 were wins and most were BIG. The AVERAGE gain per trade was +10.77% and the average holding period was 11 days. As you can see from the chart, though, that holding period was skewed mightily by that long Feb-May trade. But even with that, it has generated an absolutely absurd per day return of .96% per DAY held. That is almost 25x the average market daily return. When I get a minute, I'll go back and look at all the trades for this one and post a follow up note on the entire history of SMR.
This one IS a little dangerous, though. It has a meme-stock quality to it that is a little unsettling and after doubling since the beginning of the year, it might be due for an even bigger correction than it's already had since July 25 (-34%). But as anyone who follows me already knows, having a method that can make money while a stock drops lets me sleep a lot better after I open trades like this one. The fact that it has already pulled back 34% makes it that much less worrisome. The presence of nearby support at 32.65 and 31.05 also make me less nervous, but make no mistake, these kind of stocks do not always respect support or resistance.
I have made a ridiculous amount of money trading this one this year and I hope that continues. I do think a rate cut could juice things a bit, but this company loses money and has almost no revenues, so if you follow me on this and lose, don't say you weren't warned. This is NOT a value stock.
Side note that makes this trade even more attractive to me - the option premium here is kind of absurd and it has weekly options, so if that entry lot drops, I can write calls if the trade drags on to generate some extra profit/lower my cost basis. This one is not for the faint of heart, though, so follower beware.
I will add tactically (not recklessly) if opportunities present themselves, but my hope is for a quick fat bounce, as always.
As always - this is intended as "edutainment" and my perspective on what I am or would be doing, not a recommendation for you to buy or sell. Act accordingly and invest at your own risk. DYOR and only make investments that make good financial sense for you in your current situation.

CM-Finding Stocks That MOVE!-Part 2-(Building The Scanner)This is Video 2 in the series "CM - The Best Method I’ve Found For Finding - Stocks That MOVE!!"
Please make sure you watch the 1st video in this series which is listed below under Related Ideas.
Also in that post I provided links to two different watch lists.

Tesla, Nio, XPEV breakout ahead of NVdA earnings tomorrowTesla is breaking out of a daily chart wedge pattern.
This pattern suggest a move to 400 could occur as long as the indices don't fall on NVDA earnings.
If you look at how some of the China ADR EV companies have performed, Tesla could be well on its way to replicating a move.
All eyes on NVDA earnings tomorrow. Heading into the print with a 58 PE and looking like it wants new highs.
NVDA guidance will once again be crucial for the market. $46B revenue estimate is likely to be beat.
We secured profits on the massive nuclear pop today. SMR calls printed over 100%

MaintenanceWe have candles with long shadows forming on the 21 EMA and above the golden zone. Price needs to maintain the 21 EMA to maintain the uptrend.

Wedges and DreamsCan price make HHs and HLs through 34.73 (10EMA) in blue and 36.42 (21 EMA in yellow)? If so the bulls will get a miracle; the falling Wedge will come into fruition and the bulls will hopefully enjoy a trend reversal. However, the bulls still must exercise caution because the bears are still near.
SMRExpecting Bullish momentum up to the 53$ high after lows liquidated and bullish momentum at 33$ level.

Demand and SupportSMR on the 3 Day chart is at the support of a parallel channel and in a Demand Zone, but is that enough? It is also hovering under the 21 EMA(in yellow). If price fails there we have a 50EMA(in blue) close to a key level 31.26 that may possibly be the next price target. Price needs to break from the Demand Zone and the 21 EMA(37.76) if that happens possible price target 45.00. Candle finishes printing on Tuesday.
Tapped inPrice has recently touched a Demand Zone. Price is right under the 50 EMA. Will price return to the 40$ price range or will the sellers/shorters bring price down to the 35$ price area? If price can claim the 50 EMA and make Higher Highs and Higher Lows, the bulls can say this is just a pull back.

SMR Bullish flag breakout from 21DMA → new ATHSMR – NuScale Power Corp.
Setup Grade: A
• Entry: $38.78 (7/14)
• Exit: $46.00 (7/17) → Gain: +18.6%
• Setup: Bullish flag breakout from 21DMA → new ATH ($49.27). RSI hit 70.
• Exit Reason: Doji star at highs. Expected pullback to 21DMA (~$38.89).
• Plan: Re-enter if reversal near $33.63 confirms with hammer + volume.
SMR heads up at $40.78: Golden Genesis fib may cause a DIPSMR got a strong spike with all nuclear stocks.
It has just hit a Golden Genesis fib at $40.78.
Look for a Dip-to-Fib or Break-n-Retest for longs.
.
See "Related Publications" for previous plots including this BOTTOM CALL:
===========================================
.

NuScale Power strong setup formingI believe SMR is set for long rise as strong impulse will continue. This idea, of course, will take some time before we see double and triple price from now ($36). I expect swings up and down within a few weeks before trend up resumes.
Now to EW analysis. Price completed purple wave (3) of green (1) which is a part of black wave (iii). So now I expect it to go down around 38% to 68% of purple (3) and will accumulate.
Then is shall take some time for green (1) and then (2) to complete. Here we might have significant price drop with the count invalidation level at around $11.2. I don't expect this however EW rules allow to have it. Once green wave (2) is completed, the stock will fly.
SMR is an innovative manufacturer of small nuclear modular reactors. It is the only one which got the license from US nuclear authorities in this field. They do much work to install first reactors by 2030 for the first customers.
In general, data centres and progressing AI boom will be in need for energy and together with policies being shifted away from solar/wind as the only green clean energy, reliable energy sources might be long-term winners.
Currently, the company holds strong balance sheet and makes little money however work towards strengthen legal position and get contracts.
I plan to accumulate sizeable amount during upcoming volatility to build long position.

NuScale Power Corp. (SMR) – Leading the Nuclear RenaissanceCompany Overview:
NuScale NYSE:SMR is pioneering small modular reactor (SMR) technology—offering a scalable, carbon-free solution for baseload energy at a time when AI, quantum computing, and data centers are driving unprecedented power demand.
Key Catalysts:
Regulatory Leadership 🏛️
Only SMR design approved by the U.S. Nuclear Regulatory Commission (NRC) ✅
Creates a regulatory moat—a multi-year head start over competitors
Enhances institutional credibility and accelerates deployment
Global Flagship Project: RoPower, Romania 🇷🇴
462 MW project → pre-orders already underway
Final investment decision by year-end could validate tech and unlock global markets
First major deployment in Europe signals international expansion readiness
Explosive Growth Outlook 🚀
77% forecasted revenue CAGR through 2025 vs. industry avg of 8.3%
62% reduction in per-share losses expected → strong operating leverage
Positioned to meet clean energy mandates and private sector demands for resilient, low-carbon power
Investment Outlook:
✅ Bullish Above: $27.00–$28.00
🎯 Price Target: $48.00–$50.00
📈 Thesis Drivers: First-mover advantage, regulatory approval, and global SMR project pipeline
⚛️ NuScale isn’t just building reactors—it’s building the future of energy. #SMR #NuclearEnergy #CleanPower
