NZDCAD: Stuck in a Range And Showing Signs of a DropNZDCAD: Stuck in a Range And Showing Signs of a Drop
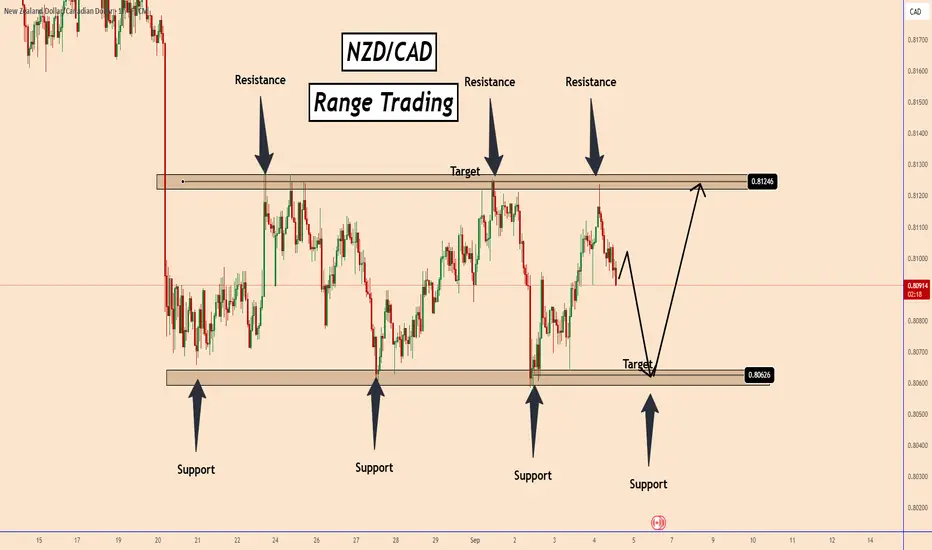
NZDCAD has been moving sideways for a while, trading between 0.8060 and 0.8125. This has created a clear range pattern.
Each time price hits the bottom of the range, it bounces up. And each time it reaches the top, it pulls back down.
Right now, the pair looks ready to move lower again. The reaction has already started, and the chart suggests a possible drop toward 0.8060.
You may find more details in the chart!
Thank you and Good Luck!
❤️PS: Please support with a like or comment if you find this analysis useful for your trading day❤️
NZDCAD trade ideas
NZDCAD: Consolidation ContinuesThe market is currently consolidating within a broad horizontal range on the 4-hour timeframe.
Following a test of the range resistance, a significant bearish engulfing candle emerged, indicating a confirmed change of character (CHOCH).
Based on this analysis, a potential price decline towards the range support is anticipated. The target price is set at 0.8084.

NZDCAD – Range Resistance in Play!📌 NZDCAD has been moving within a clear range structure between support and resistance zones on the 1H timeframe.
Price is now approaching the upper resistance area, where sellers have consistently stepped in to cap bullish momentum.
If this level holds, we could see a bearish reversal, driving price back toward the support zone near the lower boundary of the range.
This setup offers a classic opportunity to trade the swing from resistance back into support.
⚠️ Always remember: patience pays. Let the market come to you.
📚 Always follow your trading plan regarding entry, risk management, and trade management.
Good luck!
All Strategies Are Good; If Managed Properly!
~Richard Nasr

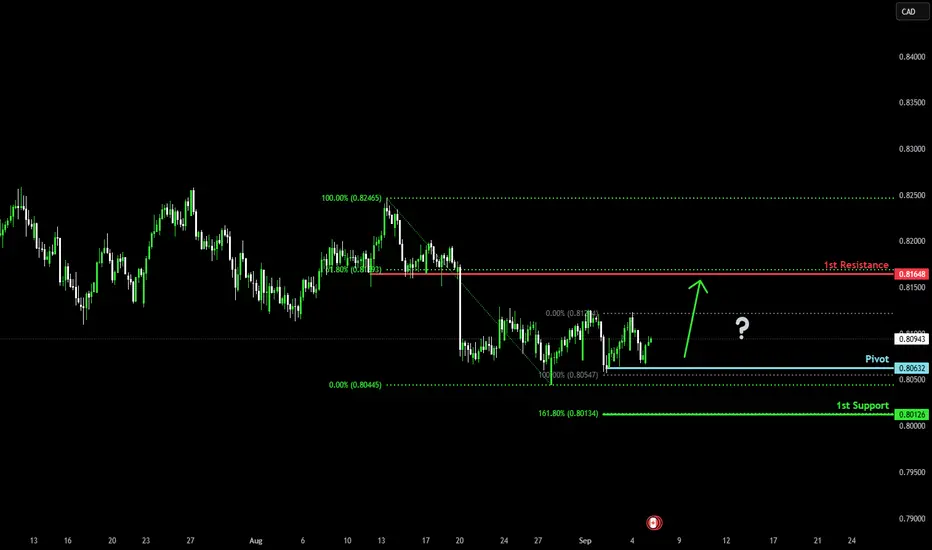
Bullish reversal?NZD/CAD has bounced off the pivot, which acts as a pullback support and could rise to the 1st resistance, which aligns with the 61.8% Fibonacci retracement.
Pivot: 0.80532
1st Support: 0.80126
1st Resistance: 0.81648
Disclaimer:
The above opinions given constitute general market commentary, and do not constitute the opinion or advice of IC Markets or any form of personal or investment advice.
Any opinions, news, research, analyses, prices, other information, or links to third-party sites contained on this website are provided on an "as-is" basis, are intended only to be informative, is not an advice nor a recommendation, nor research, or a record of our trading prices, or an offer of, or solicitation for a transaction in any financial instrument and thus should not be treated as such. The information provided does not involve any specific investment objectives, financial situation and needs of any specific person who may receive it. Please be aware, that past performance is not a reliable indicator of future performance and/or results. Past Performance or Forward-looking scenarios based upon the reasonable beliefs of the third-party provider are not a guarantee of future performance. Actual results may differ materially from those anticipated in forward-looking or past performance statements. IC Markets makes no representation or warranty and assumes no liability as to the accuracy or completeness of the information provided, nor any loss arising from any investment based on a recommendation, forecast or any information supplied by any third-party.

NZD_CAD POTENTIAL SHORT|
✅NZD_CAD is set to retest a
Strong resistance level above at 0.8130
After trading in a local uptrend for some time
Which makes a bearish pullback a likely scenario
With the target being a local support below at 0.8096
SHORT🔥
✅Like and subscribe to never miss a new idea!✅

NZDCAD Will Go UP!
HI,Traders !
#NZDCAD is trading in a
Local uptrend and the pair
Made a local correction
But will soon retest a
Horizontal support of 0.81257
From where we will be expecting
A further move up as we
Are locally bullish biased !
Comment and subscribe to help us grow !

NZD_CAD LOCAL SHORT|
✅NZD_CAD price went up sharply
But a strong resistance level was hit at 0.8170
Thus, as a pullback is already happening
And a move down towards the
Target of 0.8140 shall follow
SHORT🔥
✅Like and subscribe to never miss a new idea!✅

NZD-CAD Rebound Ahead! Buy!
Hello,Traders!
NZD-CAD is trading in a
Downtrend but the pair
Has almost reached a
Local horizontal support
Of 0.8063 so despite
This being a counter
Trend move we will be
Expecting a local
Bullish rebound
Buy!
Comment and subscribe to help us grow!
Check out other forecasts below too!
Disclosure: I am part of Trade Nation's Influencer program and receive a monthly fee for using their TradingView charts in my analysis.

#NZDCAD Buy setup VFZ, EW and FIB.
On top of that, we are very low on general. NZD should start pushing again in risk on environment
Bullish bounce off?NZD/CAD is falling towards the support level that aligns with the 61.8% Fibonacci retracement and could bounce from this level to our take profit.
Entry: 0.80937
Why we like it:
There is a pullback support that lines up with the 61.8% Fibonacci retracement.
Stop loss: 0.80659
Why we like it:
There is a swing low support.
Take profit: 0.81631
Why we like it:
There is a pullback resistance that lines up with the 78.6% Fibonacci retracement.
Enjoying your TradingView experience? Review us!
Please be advised that the information presented on TradingView is provided to Vantage (‘Vantage Global Limited’, ‘we’) by a third-party provider (‘Everest Fortune Group’). Please be reminded that you are solely responsible for the trading decisions on your account. There is a very high degree of risk involved in trading. Any information and/or content is intended entirely for research, educational and informational purposes only and does not constitute investment or consultation advice or investment strategy. The information is not tailored to the investment needs of any specific person and therefore does not involve a consideration of any of the investment objectives, financial situation or needs of any viewer that may receive it. Kindly also note that past performance is not a reliable indicator of future results. Actual results may differ materially from those anticipated in forward-looking or past performance statements. We assume no liability as to the accuracy or completeness of any of the information and/or content provided herein and the Company cannot be held responsible for any omission, mistake nor for any loss or damage including without limitation to any loss of profit which may arise from reliance on any information supplied by Everest Fortune Group.

NZD_CAD WILL GO DOWN|SHORT|
✅NZD_CAD has been growing recently
And the pair seems locally overbought
So as the pair has approached
A horizontal resistance of 0.8120
Price fall is to be expected
SHORT🔥
✅Like and subscribe to never miss a new idea!✅

NZDCAD LongNZD/CAD (Daily Timeframe) Analysis
The pair NZD/CAD has recently shown strong bullish signs after breaking above the descending trendline (red line). This breakout suggests that sellers are losing control and buyers are gaining strength.
The price has bounced from a key horizontal support zone, indicating that this level is being respected by the market.
RSI is moving above the mid-level (50), which confirms momentum shifting towards the bulls.
After the breakout, the pair is expected to continue its upward movement towards the next resistance zone around 0.8240.
📌 Trade Plan:
Buy Entry: 0.8150 (current zone)
Stop Loss (SL): 0.8102 (below support zone, protecting against false breakout)
Take Profit (TP): 0.8240 (major resistance area)
⚖️ Risk/Reward: The setup offers a favorable ratio, as the potential upside is higher compared to the downside risk.
✅ Summary:
This is a trendline breakout trade supported by momentum (RSI) and structure (support-resistance). As long as price holds above 0.8100, buyers are in control and the pair has room to test higher levels.
---
📢 Disclaimer: This analysis is for educational purposes only and not financial advice. Forex trading involves high risk; always do your own research and manage risk properly before entering any position.

LP usuli bilan #SellSell below the 0.81604 price level.
The position was opened too far from the zone, and the price broke through the zone with a strong impulse. This indicates that the price may have already exhausted its daily momentum, and a pullback could be expected!
NZDCAD is BullishPrice was in a strong downtrend, however now it seems that bulls are trying to assume control of the price action. For the past two weeks price is hovering within a range, that has led to a bullish divergence and triple bottom patterns, all hinting a reversal. If previous lower high is broken with good volume then we can expect a strong rally upwards. Targets are mentioned on the chart.

NZDCAD: Price Holding Below SupportNZDCAD has been in a messy daily range. The daily levels do not hold cleanly. However, I do think there's an opportunity here regardless.
The first trendline break indicates weakness. The second trendline break is cleaner as price is able to hold below this level on the daily timeframe.
Looking at the intraday timeframe, I plotted a trendline to look for confluence. Price crosses below this trendline and is somewhat supported by an exponential moving average crossover.
There is an opportunity to scale into this trade provided that it starts trending cleanly.

A Short Setup On the NZDCAD and NZDUSDThe outlook for the NZD against the CAD is becoming increasingly bearish, with a combination of diverging fundamentals and a technical break on the chart suggest further downside is likely.
The bearish sentiment is largely driven by different economic and monetary policy expectations for the two countries.
Diverging Central Banks:
New Zealand central bank RBNZ has made dovish remarks last monetary policy announcement, it cut its interest rate in an effort to jumpstart a faltering economy. Unlike the Bank of Canada, which is adopting a more wait-and-see approach. With Canadian inflation near target and its economy more robust, the interest rate spread should favor the CAD.
Economic Performance Gap:
New Zealand's economy is displaying signs of stress, with domestic demand slowing and unemployment increasing. Although Canada's economy is also slowing, it seems to be on track for a softer landing, aided by a more stable labor market and a housing sector that has surprised to the upside.
The story is straightforward: a central bank actively easing policy to help a soft economy (New Zealand) compared with a central bank on hold with a more stable economy (Canada). That divergence provides a bearish outlook for the NZD/CAD.
The Chart Validates the Bearish Scenario
Established Downtrend: The pair has been making consecutively lower highs. This is a classic technical formation that is a clear signal that sellers are in charge and that buying momentum is disappearing with every attempt at a rally.
Critical Support Break: The most significant recent development was the definitive break of a key support level in the 0.8115 area. This level had held on multiple occasions since June, but the breakdown of this level likely paves the way for a more decline.
Support Turns Resistance: Since the breakdown, price has pulled back slightly higher to test this former broken support area. if price cannot retake this level, it confirms the breakdown.
Downside Targets: Now that the bearish structure is in place, the potential initial target is in the 0.8020-0.8030 area. This area corresponds with Fibonacci retracement and extension levels.
Bottom line
When technical and fundamental analysis converge, it forms a high-conviction trade. The underlying narrative of diverging monetary policies offers the "why" of NZD weakness , while the technical breakdown on the chart provides potential future price action.
With the RBNZ's easing cycle and the clear bearish price structure on the chart, the path of least resistance for NZD/CAD appears to be lower. Not being able to break the new resistance around ~0.8115 would most likely see the pair decline towards the first target area of 0.8020-0.8030 in the next couple of weeks.
Remember, nothing is guaranteed in this market... trade with care.

NZD-CAD Local Pullback! Sell!
Hello,Traders!
NZD-CAD made a sharp
Bullish move up and hit
A horizontal resistance
Of 0.8130 and the pair
Failed to break the level
So we are locally bearish
Biased and we will be expecting
A local bearish correction
On Monday!
Sell!
Comment and subscribe to help us grow!
Check out other forecasts below too!
Disclosure: I am part of Trade Nation's Influencer program and receive a monthly fee for using their TradingView charts in my analysis.

NZDCAD APPROACHES SUPPORT LEVELHere’s the Daily timeframe Chart of NZDCAD. Technically, we can see how price is declining to a support level. We have a bullish sentiment on NZDCAD therefore we are waiting for price to shift from intraday bearish to intraday bullish to help us make a buy entry.

NZD/CAD LONG FROM SUPPORT
NZD/CAD SIGNAL
Trade Direction: long
Entry Level: 0.807
Target Level: 0.814
Stop Loss: 0.803
RISK PROFILE
Risk level: medium
Suggested risk: 1%
Timeframe: 12h
Disclosure: I am part of Trade Nation's Influencer program and receive a monthly fee for using their TradingView charts in my analysis.
✅LIKE AND COMMENT MY IDEAS✅


NZDCAD 4H PERSP.This technical analysis is again about sell and bear market! But with 4H timeframe.
As we see in this chart, we got oriented market on if the price will reach LL which is current most near and strong support level for this pair.
* PAWS ARE NEAR!!! GRR... xD
Have a profitable trading!

Im looking for buy setups.Those who are passionate about trading know that this is a tough business. What you have to understand is that the predictions people are making regarding the price movement directions are based on probabilities. There is no such thing as 100 percent direction in the market, and that is because the market can turn against you or your direction at any time it wants. The reason doesn't even matter; it could be the news of some geopolitical changes, oil cut production or war, or many other factors that could impact the financial market. If you have one or more good reasons that the price will follow a certain direction, all you have to do is take a small risk entry in your direction with a good risk-to-reward ratio and just wait and see how the market will perform. A trader could have 1 good reason or a few reasons why his bias is up or down. The reasons could be based on particular studies, past behavior, fundamentals, technical analysis, or certain observations. The important part for you to understand is that the market is in a continuously changing process; this means that yesterday's prediction, today, could be irrelevant. The market does not have to follow your analysis. You have to follow the market, observe its changes, and react accordingly to them! I hope some of you will find this helpful. Good luck!
