NZDCAD 1HR BAT HARMONICBAT Harmonic pattern completed on 1H timeframe.
2 Take profits shown on the chart
Trade Active
NZDCAD trade ideas

NZDCAD: A Short Term Bearish Perspective NZDCAD: A Short Term Bearish Perspective
NZDCAD reached a strong zone near 0.8205 and reached
Given that the trend is still bearish and Canada continues to print strong data the chances are that it can drop further in the short term.
The chances are that it can drop further during the U.S trading session given that the economic calendar is very poor today.
You may find more details in the chart!
Thank you and Good Luck!
PS: Please support with a like or comment if you find this analysis useful for your trading day
Disclosure: I am part of Trade Nation's Influencer program and receive a monthly fee for using their TradingView charts in my analysis.

BuyRejection Level
Daily Volume
Market Structure Shift
London Session
Trend Line Break
Untapped Order Point

NZDCAD Bullish Breakout!
HI,Traders !
#NZDCAD was trading
Beneath the falling resistance
Line but now we are seeing a
Bullish breakout so we are
Now locally bullish biased
And we will be expecting a
Further bullish move up !
Comment and subscribe to help us grow !

SELL NZDCAD now for a 4h time frame bearish trend continuationSELL NZDCAD now for a four hour time frame bearish trend continuation..........
STOP LOSS: 0.8180
This sell trade setup is based on hidden bearish divergence trend continuation trading pattern...
Always remember, the trend is your friend, so whenever you can get a signal that the trend will continue, then good for you to be part of it
TAKE PROFIT : take profit will be when the trend comes to an end, feel from to send me a direct DM if you have any question about take profit or anything.
Remember to risk only what you are comfortable with….....trading with the trend, patient and good risk management is the key to success here

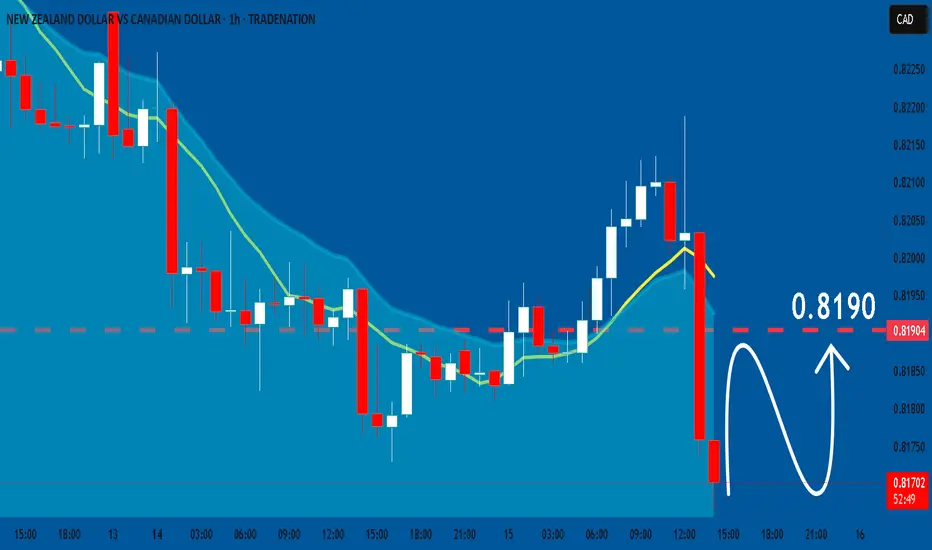
NZDCAD: Patience Before the PushNZDCAD on the 1H chart just completed a clean liquidity sweep below the previous day’s low. That long wick aggressively took out resting sell stops before price sharply reversed.
We’ve now seen a break of structure to the upside, showing a possible shift in market direction. Price is currently pulling back toward two visible imbalance zones (iFVGs), both sitting just below the previous day’s low.
If price trades into these iFVGs and gives us a clear bullish confirmation like a bullish engulfing candle, a rejection wick, or a strong break of structure on lower timeframes, we could look for continuation toward the liquidity above the highs.
📌 Key Levels
• Liquidity sweep below PDL
• Bullish break of structure
• iFVGs aligning as potential entry zones
• Final target: liquidity resting near 0.81900
🧠 Psychology Tip
The best trades don’t need to be forced. Wait for confirmation. A setup without a signal is just a theory. Protect your capital, trade your plan, and trust the process.

NZDCAD Buy?? it looks juicy Hello please do not aim for the top of the range!!
Now because its NZDCAD it might look choppy and it might be choppy.

NZDCAD bearish continuatiuonPrice was consolidating in the last 2 months, now it finally broke the level and got the retest waiting for a beutiful Bearsih Engulfing 30M,1H,2H to enter this trade.
very clear trade for me this week, it has to start now the downtrend.
---
### 🔎 **Multi‑timeframe Bias**
* **Weekly:** Bullish (but higher‑timeframe bullishness often takes longer to play out; intraday moves can still be bearish).
* **Daily:** Bearish
* **12H:** Bearish
* **6H:** Bearish
* **4H:** Bearish
✅ **Result:** 80% of your major timeframes are **aligned bearish**, giving you strong confluence to look for sells rather than buys.
---
### 📉 **Structure and Price Action**
* **Market Structure:**
Price is making **lower highs and lower lows** on the 4H and 1H timeframes, which confirms a **downtrend** in the short/medium term.
* **Current Zone:**
Price is currently reacting from a **Weekly Area of Interest (AOI)**, a previous support now acting as resistance.
* **Bearish Rejection:**
The recent move up into the AOI has been rejected, shown by the price failing to break above the resistance zone and starting to turn down.
---
### 📊 **Moving Averages**
* **50 EMA (blue) is below the 200 EMA (red):** classic bearish alignment.
* Price is currently **under the 200 EMA** and testing the 50 EMA from above — if it breaks back below, this often signals momentum returning to the downside.
---
### 📐 **Risk‑Reward and Setup**
* You’ve marked a **short entry** from the AOI, with:
* **Stop Loss** above the resistance zone (red area)
* **Take Profit** targeting lower liquidity levels (green area near 0.8110)
* The projected move matches the dominant trend direction, increasing probability.

NZDCAD SHORT Market structure bearish on HTFs DH
Entry at both Weekly and Daily AOi
Weekly Rejection at AOi
Daily Rejection at AOi
Previous Structure point Daily
Around Psychological Level 0.82000
H4 EMA retest
H4 Candlestick rejection
Rejection from Previous structure
Levels 2.66
Entry 100%
REMEMBER : Trading is a Game Of Probability
: Manage Your Risk
: Be Patient
: Every Moment Is Unique
: Rinse, Wash, Repeat!
: Christ is King.

NZDCAD Long Trade Risking 1% to make 1.37%OANDA:NZDCAD Long Trade, with my back testing of this strategy, it hits multiple possible take profits, manage your position accordingly.
Note: Manage your risk yourself, its risky trade, see how much your can risk yourself on this trade.
Use proper risk management
Looks like good trade.
Lets monitor.
Use proper risk management.
Disclaimer: only idea, not advice

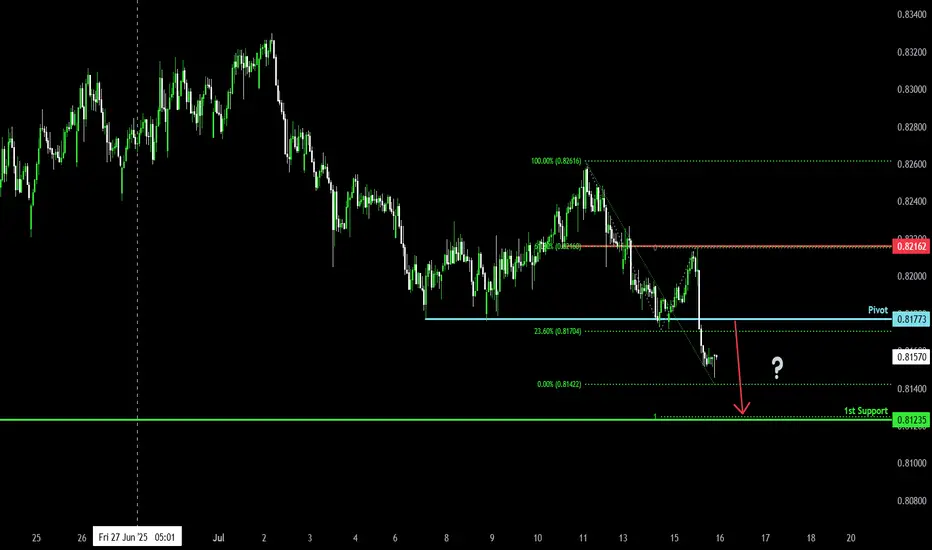
Bearish continuation?NZD/CAD is rising towards the pivot and could drop to the 1st support.
Pivot: 0.81773
1st Support: 0.81235
1st Resistance: 0.82162
Risk Warning:
Trading Forex and CFDs carries a high level of risk to your capital and you should only trade with money you can afford to lose. Trading Forex and CFDs may not be suitable for all investors, so please ensure that you fully understand the risks involved and seek independent advice if necessary.
Disclaimer:
The above opinions given constitute general market commentary, and do not constitute the opinion or advice of IC Markets or any form of personal or investment advice.
Any opinions, news, research, analyses, prices, other information, or links to third-party sites contained on this website are provided on an "as-is" basis, are intended only to be informative, is not an advice nor a recommendation, nor research, or a record of our trading prices, or an offer of, or solicitation for a transaction in any financial instrument and thus should not be treated as such. The information provided does not involve any specific investment objectives, financial situation and needs of any specific person who may receive it. Please be aware, that past performance is not a reliable indicator of future performance and/or results. Past Performance or Forward-looking scenarios based upon the reasonable beliefs of the third-party provider are not a guarantee of future performance. Actual results may differ materially from those anticipated in forward-looking or past performance statements. IC Markets makes no representation or warranty and assumes no liability as to the accuracy or completeness of the information provided, nor any loss arising from any investment based on a recommendation, forecast or any information supplied by any third-party.
NZD/CADNZD/CAD Has Retraced Into My 2h/4h Orderblock And Made A Market Structure Shift To The Upside For A Possible Move Higher Towards The Higher Timeframe Fair Value Gap. I Will Look For Longs Form This Zone And Then Wait For A Market Structure Shift To The Downside To Look For Short Entries To My Daily OrderBlock Which Sits Between 0.79705 - 0.78667. Once There I Will Look For Long Positions.
Trade Carefully HK

NZDCAD TRADE SETUPWait for retest the entry level and bearish momentum candle then take a trade for Sell otherwise skip this setup

NZD_CAD LOCAL LONG|
✅NZD_CAD is set to retest a
Strong support level below at 0.8114
After trading in a local downtrend for some time
Which makes a bullish rebound a likely scenario
With the target being a local resistance above at 0.8145
LONG🚀
✅Like and subscribe to never miss a new idea!✅
Disclosure: I am part of Trade Nation's Influencer program and receive a monthly fee for using their TradingView charts in my analysis.

NZDCAD SHORTThe Price of the New Zealand Dollar to the Canadian Dollar, has been in a downtrend for the month of July, and the canadian dollar is having a strong index for this month, after the break and retest of the daily zone to the downside,my bias is a short.

NZDCAD: Will Start Growing! Here is Why:
Our strategy, polished by years of trial and error has helped us identify what seems to be a great trading opportunity and we are here to share it with you as the time is ripe for us to buy NZDCAD.
Disclosure: I am part of Trade Nation's Influencer program and receive a monthly fee for using their TradingView charts in my analysis.
❤️ Please, support our work with like & comment! ❤️
BULLISH COT DATA last friday for NZDCADLast week COT data is bullish for NZDCAD
Daily Support is at 0.812
0.812 is the origin of the Daily bullish move
That broke 0.832 resistance, creating a higher high.
Target is 0.834
This is a swing trade.

[LONG] NZDCAD Daily bullish. 4H shifted bullish gears signal BUYCOT data suggests institutions are buying NZD less than CAD by the COT Friday release.
Marked on the daily chart, a bullish break of structure.
If we look at 4H timeframe, an internal bullish structure happened last Friday. This can be a signal that the Daily correction/pullback is done.
An internal bullish shift of structure is a confirmation that price may now continue its DAILY bullish move targeting the highs at 0.83441

NZDCAD Bullish 15 min ICT 15 minute Entry:
1. Sell - side liquidity swept.
2. BOS up onM15 confirm shift.
3. Entry from bullish OB or FVG after pullback.
4. SL below liquidity sweep.
5. TP internal high/TP2 premium zone.

BUY NZDCADNZDCAD price looking to recover yesterday's loss. A falling channel pattern seems complete an ready to break to the upside. Buy

NZDCAD– Potential Bulish SetupPerfect! Since you're planning a **swing buy** on NZDCAD, here’s an updated **heading** and **description** tailored for your bullish outlook:
---
📈 NZDCAD Swing Buy Setup – Bullish
NZDCAD is showing signs of a potential bullish reversal from a strong support zone, presenting a promising swing buy opportunity.
This setup is ideal for patient traders looking to catch the next leg higher. Always follow your trading plan and apply proper risk management.

NZDCAD Selling Trading IdeaHello Traders
In This Chart nzdcad HOURLY Forex Forecast By FOREX PLANET
today NZDCAD analysis 👆
🟢This Chart includes_ (NZDCAD market update)
🟢What is The Next Opportunity on NZDCAD Market
🟢how to Enter to the Valid Entry With Assurance Profit
This CHART is For Trader's that Want to Improve Their Technical Analysis Skills and Their Trading By Understanding How To Analyze The Market Using Multiple Timeframes and Understanding The Bigger Picture on the Charts

NZD_CAD POTENTIAL SHORT|
✅NZD_CAD has been growing recently
And the pair seems locally overbought
So as the pair is approaching
A horizontal resistance of 0.8260
Price decline is to be expected
SHORT🔥
✅Like and subscribe to never miss a new idea!✅
Disclosure: I am part of Trade Nation's Influencer program and receive a monthly fee for using their TradingView charts in my analysis.
