NZDCHF Will Go Up From Support! Buy!
Here is our detailed technical review for NZDCHF.
Time Frame: 1h
Current Trend: Bullish
Sentiment: Oversold (based on 7-period RSI)
Forecast: Bullish
The market is approaching a key horizontal level 0.520.
Considering the today's price action, probabilities will be high to see a movement to 0.521.
P.S
Please, note that an oversold/overbought condition can last for a long time, and therefore being oversold/overbought doesn't mean a price rally will come soon, or at all.
Like and subscribe and comment my ideas if you enjoy them!
NZDCHF trade ideas

NZD_CHF RISKY LONG|
✅NZD_CHF fell again to retest the support of 0.5200
But it is a strong key level
So I think that there is a high chance
We will see a bullish rebound and a move up
LONG🚀
✅Like and subscribe to never miss a new idea!✅

GOOD PAIR TO TRADETrades with good risk reward first go up then down clear move you can buy before sell its safe.. enjoy

Trade idea - NZDCHF Long4H
Inverse Head & Shoulders potentially in play.
Clear support & resistance zone is there.
Interesting scenario from a 1H perspective as well with an Inverse Head & Shoulders pattern as well.
Corrective approach towards entry zone.
-68 Fibonacci completion aligning with entry zone.
= Confirmation to enter. Instant market execution Buy.
1.5% risk.

NZDCHF - SellOANDA:NZDCHF made double top and now making LHs and LLs retraced to 0.618 fib level. Sell @ CMP with TP and SL marked

NZDCHF LONGMarket structure Bullish on HTFs DH
Entry at Weekly and Daily AOi
Weekly Rejection At AOi
Daily Rejection At AOi
Daily Previous Structure Point
around Psychological Level 0.52000
H4 EMA retest
H4 Candlestick rejection
Rejection from Previous structure
Levels 6.2
Entry 100%
REMEMBER : Trading is a Game Of Probability
: Manage Your Risk
: Be Patient
: Every Moment Is Unique
: Rinse, Wash, Repeat!
: Christ is King

NZDCHF: Resuming Bearish Trend?The NZDCHF has shifted from its upward trend and is now moving downward after an extended bullish rally.
A decisive break below a key support level signals strong selling pressure in the market.
I expect the downward momentum to persist, with the currency pair potentially reaching the 0.5190 level soon.


NZDCHF: Back to Bearish Trend?!The NZDCHF has reversed its upward trend and is now experiencing a downward movement following a prolonged period of bullish rally.
A significant break below a key support level indicates a strong presence of sellers in the market.
I anticipate that the downward momentum will continue, with the currency pair likely to reach the 0.5190 level in the near future.

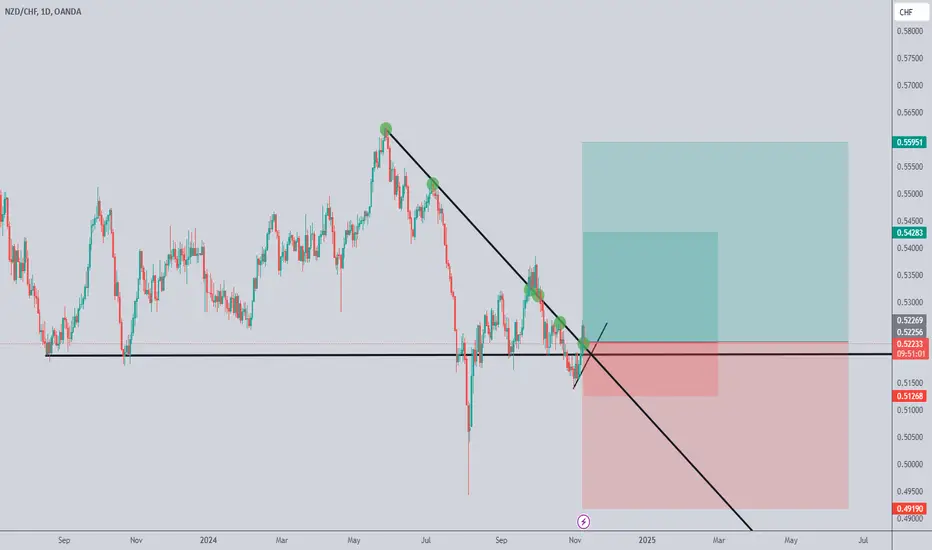
NZD/CHF "Kiwi vs Swiss" Money Heist Plan on Bearish Side.Ola! Ola! My Dear Robbers / Money Makers & Losers, 🤑💰
This is our master plan to Heist NZD/CHF "Kiwi vs Swiss" Market based on Thief Trading style Technical Analysis.. kindly please follow the plan I have mentioned in the chart focus on Short entry. Our target is Green Zone that is High risk Dangerous level, market is oversold / Consolidation / Trend Reversal / Trap at the level Bullish Robbers / Traders gain the strength. Be safe and be careful and Be rich 💰.
Entry 👇 📉: Can be taken Anywhere, What I suggest you to Place Sell Limit Orders in 15mins Timeframe, Recent / Nearest High Point.
Stop Loss 🛑: Recent Swing High using 1h timeframe
Attention for Scalpers : Focus to scalp only on Short side, If you've got a money you can get out right away otherwise you can join with a swing trade robbers and continue the heist plan, Use Trailing SL to protect our money 💰.
Warning : Fundamental Analysis news 📰 🗞️ comes against our robbery plan. our plan will be ruined smash the Stop Loss 🚫🚏. Don't Enter the market at the news update.
Loot and escape on the target 🎯 Swing Traders Plz Book the partial sum of money and wait for next breakout of dynamic level / Order block, Once it is cleared we can continue our heist plan to next new target.
💖Support our Robbery plan we can easily make money & take money 💰💵 Follow, Like & Share with your friends and Lovers. Make our Robbery Team Very Strong Join Ur hands with US. Loot Everything in this market everyday make money easily with Thief Trading Style.
Stay tuned with me and see you again with another Heist Plan..... 🫂

NZDCHF💡Technical analysis of the NZDCHF currency pair chart, 4-hour time frame. The price pattern shown is a bullish flag pattern, which is a bullish reversal pattern. The price moves within a downward sloping channel between support and resistance levels. If the price breaks the upper line to the upside, this could be a signal of the continuation of the uptrend and the start of a new upward movement.
Resistance (R.1) and Support (S.1) levels represent important points to monitor, as the price is expected to bounce or break them to determine the next direction of movement. We monitor the MACD indicator to determine the strength of momentum.
⛔️It is not investment advice, for educational purposes only.

NZDCHF- Bullish Rectangle FlagFormation of Rectangle flag - projecting future target price and confluence of Series of HH and HL


NZDCHF - Bullish price action !! Hello traders!
‼️ This is my perspective on NZDCHF.
Technical analysis: Here we are in a bullish market structure from 4H timeframe perspective, so I look for a long. I expect bullish price action after price filled the imbalance and rejected from bullish OB.
Like, comment and subscribe to be in touch with my content!

NZD/CHF "Kiwi-Swiss" Bank Robbery Plan on Bullish SideHallo! My Dear Robbers / Money Makers & Losers, 🤑 💰
This is our master plan to Heist NZD/CHF "Kiwi-Swiss" Bank based on Thief Trading style Technical Analysis.. kindly please follow the plan I have mentioned in the chart focus on Long entry. Our target is Red Zone that is High risk Dangerous level, market is overbought / Consolidation / Trend Reversal / Trap at the level Bearish Robbers / Traders gain the strength. Be safe and be careful and Be rich.
Entry 📈 : Can be taken Anywhere, What I suggest you to Place Buy Limit Orders in 15mins Timeframe Recent / Nearest Low Point
Stop Loss 🛑 : Recent Swing Low using 2h timeframe
Attention for Scalpers : If you've got a lot of money you can get out right away otherwise you can join with a swing trade robbers and continue the heist plan, Use Trailing SL to protect our money 💰.
Warning : Fundamental Analysis news 📰 🗞️ comes against our robbery plan. our plan will be ruined smash the Stop Loss 🚫🚏. Don't Enter the market at the news update.
Loot and escape on the target 🎯 Swing Traders Plz Book the partial sum of money and wait for next breakout of dynamic level / Order block, Once it is cleared we can continue our heist plan to next new target.
Support our Robbery plan we can easily make money & take money 💰💵 Follow, Like & Share with your friends and Lovers. Make our Robbery Team Very Strong Join Ur hands with US. Loot Everything in this market everyday make money easily with Thief Trading Style.
Stay tuned with me and see you again with another Heist Plan..... 🫂

NZD/CHF BEARS ARE STRONG HERE|SHORT
Hello, Friends!
Previous week’s green candle means that for us the NZD/CHF pair is in the uptrend. And the current movement leg was also up but the resistance line will be hit soon and upper BB band proximity will signal an overbought condition so we will go for a counter-trend short trade with the target being at 0.513.
✅LIKE AND COMMENT MY IDEAS✅


NZDCHF BullishBias Bullish
Fundamental Analysis
NZD is bearish data, but recent inflation is at target level close to 2%. NZD likely to stable down soon. CHF is not taking big move, more neutral position
Price Action: Price retrace back to support level. there was an rejection from Support level. It broke the H4 resistance level. As it show the continuation of bullish movement. Price expected to retest the broken resistance level. It consolidated and form a double bottom and broke through the ltf resistance level
Set up:
Long setup Broken resistance level of H4/H1
SL below swing low
TP next swing high of R:R 1:4.5

BUY NZDCHF - entry strategy explained in detail Trader Tom, a technical analyst with over 15 years’ experience, explains his trade idea using price action and a top down approach. This is one of many trades so if you would like to see more then please follow us and hit the boost button.
We are proud to be an OFFICIAL Trading View partner so please support the channel by using the link below and unleash the power of trading view today!
www.tradingview.com

long idea
Long swing trade idea. From the lows several weeks to materialize. pulled off the low with speed

NZD CHF BuyThe New Zealand Dollar (NZD) is generally considered a higher yielding currency. It is dependent on the export of agricultural and other resources. New Zealand's strong economic performance and rising commodity prices often lead to increased demand for the NZD. If the economic data from New Zealand is positive, this could have a positive effect on the currency.
However, the Swiss franc (CHF) is known as a "safe haven currency," which investors seek in times of economic instability. If there is stability in the global economy, the CHF could weaken as capital shifts to higher yielding assets, including the NZD.
NZDCHF Channel Down and Head and Shoulders driving it much lowerThe NZDCHF pair gave us a spot on buy signal last time we looked into it (August 23, see chart below) that easily hit the target and immediately after started a correction that broke the Channel Up to the downside:
What has emerged from that top is a Channel Down pattern, which made yesterday a new Lower High on the 1D MA50 (blue trend-line). That's not all however. As you can see, this Lower High can technically be the Right Shoulder of a Head and Shoulders (H&S) pattern, which makes the trend even more bearish.
The 1st Bearish Leg of the Channel Down reached a -4.55% decline, so another such Leg would price a Lower Low at 0.50255. This happens to be just above the 2.0 Fibonacci extension, which is a standard target for H&S patterns. Our Target is marginally above both at 0.50500.
-------------------------------------------------------------------------------
** Please LIKE 👍, FOLLOW ✅, SHARE 🙌 and COMMENT ✍ if you enjoy this idea! Also share your ideas and charts in the comments section below! This is best way to keep it relevant, support us, keep the content here free and allow the idea to reach as many people as possible. **
-------------------------------------------------------------------------------
💸💸💸💸💸💸
👇 👇 👇 👇 👇 👇

NZDCHF: Bears Will Push Lower
Remember that we can not, and should not impose our will on the market but rather listen to its whims and make profit by following it. And thus shall be done today on the NZDCHF pair which is likely to be pushed down by the bears so we will sell!
❤️ Please, support our work with like & comment! ❤️
