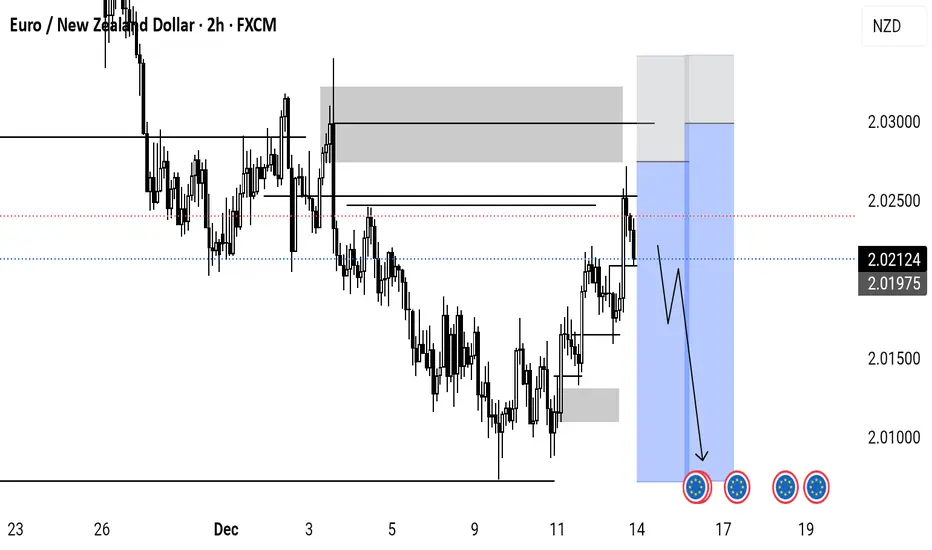
#EURNZD: Bull Run Over? Start Swing Selling HAPPY NEW YAER 2026💥
EURNZD Analysis Based On SMC|ICT Strategy👨💻
🔺We are seeing bullish price exhaustions and change of character already have occurred, now the first thing we need to see is price behaviour and momentum, these are the two things that will give us the confirmation to tae swing sell entry.
🔺Keep 100-150 pips as in stop loss, or adjust according to your analysis, for the take profit 600 to 800 pips and swing sell.
Like, comment and share for more such great analysis, hope 2026 become a year to remember to all of us!
Team Setupsfx_
New Zealand Dollar/Euro
No trades
Market insights

EURNZDThe uptrend line has been broken and has given weak confirmation. A pullback to the broken level has also been made and I expect it to fall to the specified range.

EURNZD LOCAL LONG|
✅EURNZD is reacting from a clearly defined demand zone after a strong bearish displacement, suggesting sell-side liquidity has been taken. The current structure hints at institutional mitigation, with a potential bullish reaction toward internal range liquidity and prior imbalance above.Time Frame 3H
LONG🚀
✅Like and subscribe to never miss a new idea!✅

Why This Support Held | Market Pressure Explained #2🧠 WHY THIS SUPPORT HELD | MARKET PRESSURE EXPLAINED #2 (EURNZD)
This chart illustrates how price stability and continuation can emerge from collective market participation , rather than from candlesticks or indicators in isolation.
📌 In this historical example, s upport held due to sustained buy-side interest becoming visible across multiple timeframes , particularly as price approached previously established support areas.
Key observations include:
• Increased market participation near higher-timeframe support
• Price compression followed by renewed directional activity
• Alignment of structural price zones across timeframes
• Gradual absorption of selling pressure
• Continuation supported by overlapping participation behaviors
📊 Candlesticks do not cause price movement.
They reflect past interactions between buyers and sellers.
🧠 Understanding market behavior is clearer when focusing on
how different participants may interact at specific price areas , rather than treating indicators as standalone decision tools.
📘 This content is provided solely for educational and explanatory purposes , aiming to improve understanding of market structure and price behavior based on historical data.
⚠️ DISCLAIMER
This material is strictly educational and informational.
It does not constitute financial advice, trading instructions, or a recommendation to engage in any financial activity.
The author does not offer personalized guidance.
Any decisions made based on this content are entirely the responsibility of the individual.

EURNZD SellHello traders, I just checked this setup for a potential bearish for EURNZD. We got a channel breakout also a forming head&shoulder pattern in daily timeframe already. I am setting as target the lows at 2.0080.

Bullish reversal?EUR/NZD is falling towards the pivot, which is a multi-swing low support, and could bounce to the 1st resistance, which acts as a pullback resistance.
Pivot: 2.01040
1st Support: 2.00034
1st Resistance: 2.02825
Disclaimer:
The opinions given above constitute general market commentary and do not constitute the opinion or advice of IC Markets or any form of personal or investment advice.
Any opinions, news, research, analyses, prices, other information, or links to third-party sites contained on this website are provided on an "as-is" basis, are intended to be informative only, and are not advice, a recommendation, research, a record of our trading prices, an offer of, or solicitation for, a transaction in any financial instrument and thus should not be treated as such. The information provided does not involve any specific investment objectives, financial situation, or needs of any specific person who may receive it. Please be aware that past performance is not a reliable indicator of future performance and/or results. Past performance or forward-looking scenarios based upon the reasonable beliefs of the third-party provider are not a guarantee of future performance. Actual results may differ materially from those anticipated in forward-looking or past performance statements. IC Markets makes no representation or warranty and assumes no liability as to the accuracy or completeness of the information provided, nor any loss arising from any investment based on a recommendation, forecast, or any information supplied by any third party

EURNZDEURNZD forming a triple top pattern with in a consolidation range ...previously it also performed same kind of character visible on chart..a bearish divergence is also prominent this time

Could the price reverse from here?EUR/NZD is reacting off the support level, which is an overlap support that is slightly above the 78.6% Fibonacci retracement, and could bounce from this level to our take profit.
Entry: 2.01667
Why we like it:
There is an overlap support level which is slightly above the 78.6% Fibonacci retracement.
Stop loss: 2.00615
Why we like it:
There is a pullback support level.
Take profit: 2.02962
Why we like it:
There is a pullback resistance level that aligns with the 50% Fib retracement.
Enjoying your TradingView experience? Review us!
Please be advised that the information presented on TradingView is provided to Vantage (‘Vantage Global Limited’, ‘we’) by a third-party provider (‘Everest Fortune Group’). Please be reminded that you are solely responsible for the trading decisions on your account. There is a very high degree of risk involved in trading. Any information and/or content is intended entirely for research, educational and informational purposes only and does not constitute investment or consultation advice or investment strategy. The information is not tailored to the investment needs of any specific person and therefore does not involve a consideration of any of the investment objectives, financial situation or needs of any viewer that may receive it. Kindly also note that past performance is not a reliable indicator of future results. Actual results may differ materially from those anticipated in forward-looking or past performance statements. We assume no liability as to the accuracy or completeness of any of the information and/or content provided herein and the Company cannot be held responsible for any omission, mistake nor for any loss or damage including without limitation to any loss of profit which may arise from reliance on any information supplied by Everest Fortune Group.

EURNZD FREE SIGNAL|LONG|
✅EURNZD reacts strongly from a clearly defined discount demand zone after a sell-side liquidity sweep. ICT structure shows bullish displacement and strong rejection from demand, suggesting smart money accumulation and a continuation move higher toward the next buy-side liquidity pool.
—————————
Entry: 2.0186
Stop Loss: 2.0156
Take Profit: 2.0229
Time Frame: 4H
—————————
LONG🚀
✅Like and subscribe to never miss a new idea!✅

EUR/NZD Pulls Back From Its December HighEUR/NZD Pulls Back From Its December High
Today the EUR/NZD rate touched the 2.4000 level — the highest reading since late November — but then saw a fairly sharp pullback. Fundamentally, the heightened volatility is driven by a combination of factors.
The euro (EUR) is showing strength because:
→ industrial production in the euro area unexpectedly rose by 0.8% (above forecasts), easing recession fears;
→ the market expects a more measured tone from the European Central Bank amid stabilising data. The meeting will take place on Thursday, 18 December.
On the other hand, the New Zealand dollar (NZD) has come under pressure:
→ a report published on 9 December by the New Zealand Treasury (the Half Year Economic and Fiscal Update) delivered a gloomy outlook: the economic recovery is stalling, and unemployment could rise to 5.5%;
→ prices for dairy products (the country’s main export) are falling, undermining the resilience of the “kiwi”.
That said, the EUR/NZD chart suggests that the scope for further upside may be limited.
Technical Analysis of the EUR/NZD Chart
From 29 November to 12 December, the pair declined (A→B) by roughly 2.9%, and then rallied to today’s peak (2), which lies almost exactly midway between the extremes at A and B. From a Fibonacci perspective, this can reasonably be interpreted as a normal pullback to the 50% level, after which the downward move may resume.
From the viewpoint of trend channels, the descending channel has been expanded upwards, while today’s move (up then down) essentially resembles a Bearish Engulfing pattern — formed during an attempt to break above the upper boundary of the channel.
Many indicators are likely to show divergence between highs 1 and 2. Therefore, taking all of the above into account, forex traders should keep in mind a scenario in which the upward trajectory of the past seven days (shown in blue) is broken by the bears, and the EUR/NZD rate continues to develop within the descending channel.
This article represents the opinion of the Companies operating under the FXOpen brand only. It is not to be construed as an offer, solicitation, or recommendation with respect to products and services provided by the Companies operating under the FXOpen brand, nor is it to be considered financial advice.

16.12.25 Daily ForecastPairs on Watch -
FX:EURNZD
FX:GBPCHF
FX:GBPAUD
FX:GBPJPY
A short overview of the instruments I am looking at for today, multi-timeframe analysis down to what I will be looking at for an entry. Enjoy!

EURNZD WILL GO UP|LONG|
✅EURNZD reacts from a clean demand zone after a controlled pullback, with bullish displacement showing smart money accumulation. Price holds above discount and looks set to target higher liquidity once continuation confirms. Time Frame 3H.
LONG🚀
✅Like and subscribe to never miss a new idea!✅

EUR/NZD BEARISH BIAS RIGHT NOW| SHORT
Hello, Friends!
EUR/NZD pair is trading in a local uptrend which we know by looking at the previous 1W candle which is green. On the 4H timeframe the pair is going up too. The pair is overbought because the price is close to the upper band of the BB indicator. So we are looking to sell the pair with the upper BB line acting as resistance. The next target is 2.020 area.
Disclosure: I am part of Trade Nation's Influencer program and receive a monthly fee for using their TradingView charts in my analysis.
✅LIKE AND COMMENT MY IDEAS✅


EURCHF Trade Recap & 17.12.25Pairs on Watch
FX:USDJPY Long
FX:GBPNZD Short
FX:AUDUSD Long
A short overview of the instruments i am looking at for Today, Multi-time frame analysis down to what i will be looking at for Entry.

15.12.25 Daily ForecastPairs on Watch -
FX:EURNZD
FX:GBPJPY
FX:CADJPY
FX:GBPCHF
A short overview of the instruments I am looking at for today, multi-timeframe analysis down to what I will be looking at for an entry. Enjoy!

Eurnzd outlookBearish on this pair this week due to the overall bearish trend. Price can just keep falling from that point this week cause liq has been swept and D supply has been mitigated.
In order to increase the reward to the risk I've set my 2 orders above that high.
Manage risk if interested
EURNZD: Overbought Market & Pullback 🇪🇺🇳🇿
EURNZD went overbought after a strong bullish wave.
The market started to lose momentum, approaching
a key daily resistance cluster.
A bearish engulfing candle formation on 30 minutes time frame
indicates a local strength of the sellers.
There is a high chance to see a pullback at least to 2.0275
❤️Please, support my work with like, thank you!❤️
I am part of Trade Nation's Influencer program and receive a monthly fee for using their TradingView charts in my analysis.

EURNZD Bearish Setup – Downtrend ContinuesEURNZD is showing bearish momentum. Targeting 2.01753 (TP1) and 2.01528 (TP2) with a stop at 2.02043. Monitor price action for continuation while managing risk.

NZDEUR, Major BULL-Flag-Formation, Targets Objections!Hello There!
Welcome to my new analysis of NZDEUR. In recent times I have spotted many gems within the forex market. With NZDEUR I have analyzed the underlying dynamics and spotted important determinations that have the potential to elevate NZDEUR into a massive bullish breakout development with expanding price-action dynamics and activation of important target-zones. In this case, NZDEUR is a considerable long-side opportunity, and when continuing with a total-return approach as I am doing it the best is to also consider other short-side opportunities in the market.
When looking at my chart NZDEUR moved forward with completing a highly important formation here which is this major ascending channel formation and NZDEUR continued with an appropriate breakout above the upper boundary confirming the boundary as the main support level together with the 65EMA and 35EMA. Furthermore, NZDEUR has the main structure support within the range marked in orange in my chart. NZDEUR already bounced several times in these important support zones and is now building a greatly determined bull-flag formation above the prevalent support levels.
Taking all the major factors into consideration here the next time the final bull-flag completion breakout of NZDEUR should be considered. Once the final bull flag has been completed as marked in my chart with the final bullish bull-flag breakout setup this is going to be the origin of the major wave-E expansion movements toward the upside dynamics, and once this final breakout has shown up it is going to activate the initial minimum target-zone as marked in my chart at 0.5708, above this the second target-zone will be at 0.57382, and the final target-zone will be within the 0.577 level.
Thank you everybody for watching my idea about NZDEUR. Support from your side is greatly appreciated.
“I always knew I was going to be rich. I don't think I ever doubted it for a minute. ”
VP

EURNZD is in The Selling Trend Due to BreakoutHello Traders
In This Chart EURNZD 4 HOURLY Forex Forecast By FOREX PLANET
today EURNZD analysis 👆
🟢This Chart includes EURNZD market update)
🟢What is The Next Opportunity on EURNZD Market
🟢how to Enter to the Valid Entry With Assurance Profit
This CHART is For Trader's that Want to Improve Their Technical Analysis Skills and Their Trading By Understanding How To Analyze The Market Using Multiple Timeframes and Understanding The Bigger Picture on the Charts

EURNZD Trading IdeaBased on Simple Technical Analysis ( Trendline + Support & Resistance )
Risk Disclaimer:
Please be advised that I am not telling anyone how to spend or invest their money. Take all of my analysis as my own opinion, as entertainment, and at your own risk. I assume no responsibility or liability for any errors or omissions in the content of this page, and they are for educational purposes only. Any action you take on the information in this analysis is strictly at your own risk. There is a very high degree of risk involved in trading. Past results are not indicative of future returns. Good luck :-)

EUR-NZD Local Long! Buy!
Hello,Traders!
EURNZD taps into a well-defined horizontal demand zone after a strong bearish leg, suggesting downside momentum is losing strength. The reaction from demand hints at smart money absorption, with sell-side liquidity likely mitigated. A corrective bullish move toward the next internal liquidity pocket is expected before any continuation. Time Frame 3H.
Buy!
Comment and subscribe to help us grow!
Check out other forecasts below too!
Disclosure: I am part of Trade Nation's Influencer program and receive a monthly fee for using their TradingView charts in my analysis.
