EURNZD: sellers remain in control - upside still rejectedEURNZD confirmed weakness above resistance once again. Breakout attempt failed, price returned below supply and trend line. Every bullish push is absorbed, indicating sellers still dominate. H4 structure stays bearish: failed breakout followed by BOS down, weak buyer on retest.
FVG above and supply zone remain untouched, acting as liquidity cap. Lack of momentum up and return into range support continuation toward 2.0050 and then 1.9750, where previous accumulation and liquidity cluster sit.
Plan: look for shorts on pullback into FVG with weak orderflow, targets 2.0050 and 1.9750. Bullish scenario only above 2.0230 with strong momentum and follow-through — then buy pullback toward 2.0400.
When market teases breakout but every rally dies instantly — trend continuation is still in play. Confirmation first, assumptions later.
New Zealand Dollar/Euro
No trades
Market insights


EURNZD – Rising Wedge Breakdown | Bearish Continuation SetupEURNZD has completed a rising wedge structure on the 4H timeframe and has broken down with a clean lower–timeframe flag retest. Price rejected key resistance, confirming sellers stepping back into control after distribution at the top of the structure.
After the initial impulsive sell from the wedge, price formed a corrective flag and retested the previous structure support–turned–resistance, offering a high-probability continuation setup.
Key Technical Points
Clear rising wedge formation + breakout
Bearish flag retest confirming continuation structure
Lower-high formation inside bearish market context
Liquidity grab above recent minor swing followed by rejection
Targeting major support zone near 1.9617
Entry: Retest of structure & bearish flag
Stop Loss: Above structure / corrective flag high
Take Profit: Major support zone at 1.9617–1.9640
Bias: Bearish unless price reclaims structure high with momentum.
This setup is aligned with bearish trend continuation structure following distribution at the wedge top. Looking for a continuation leg toward the previous demand zone. Monitoring reaction as price approaches target area for partials and trail stop accordingly.
📌 Risk management first — trade the structure and follow momentum confirmation.

SellWe have two reversal pattern rising channel and head and shoulders we will take a sell immediately if price go to right shoulder if we see confirmation in lower timeframe

SellWe have left shoulder and head we are waiting for left shoulder to sell the pattern head and shoulders

EURNZD Long From SupportHello Traders
In This Chart EURNZD 4 HOURLY Forex Forecast By FOREX PLANET
today EURNZD analysis 👆
🟢This Chart includes EURNZD market update)
🟢What is The Next Opportunity on EURNZD Market
🟢how to Enter to the Valid Entry With Assurance Profit
This CHART is For Trader's that Want to Improve Their Technical Analysis Skills and Their Trading By Understanding How To Analyze The Market Using Multiple Timeframes and Understanding The Bigger Picture on the Charts


EURNZD found a strong support area near 2.0080EURNZD found a strong support area near 2.0080
The price has already reacted, indicating the presence of bulls in that area. EURNZD is positioned to rise again.
Today the ECB left interest rates unchanged as expected at 2.15% Main Refinancing Operations Rate and Deposit Rate at 2%. This was a slightly aggressive message. However, the focus will be on President Largard's comments.
So far EURNZD is inclined to rise, but any negative comments can easily lower it. You should know this in advance.
You may find more details in the chart!
Thank you and Good Luck!
❤️PS: Please support with a like or comment if you find this analysis useful for your trading day❤️

[EURNZD] Trade ideaLong opportunity on this pair after FOMC the move should be clean. Targeting the previous high and probably even higher next ...
Great Trade !

eurnzd buy signal. Don't forget about stop-loss.
Write in the comments all your questions and instruments analysis of which you want to see.
Friends, push the like button, write a comment, and share with your mates - that would be the best THANK YOU.
P.S. I personally will open entry if the price will show it according to my strategy.
Always make your analysis before a trade

Eurnzd at major support long ? Or short ? Eurnzd reached the resistance which is its support now and price may go up from here and it lines well with trendline support price pulled back . If it’s fake breakout then price may fall down play accordingly

EURNZD 12HThe price is currently located within a key support zone, where the ascending trendline overlaps with the Fibonacci retracement levels of 0.5 and 0.618.
This confluence can act as a strong support area and potentially trigger a bullish move toward the specified target zone.

EURNZD: buy setupEURNZD: buy setup. I see a possible scenario for EURNZD. Wait for a clear breakout.
Cheers


EURNZD potential for the upside.Currently taking long positions upon the retest of the 1h low that formed after retesting the 4h broken structure.Use proper risk management should you decide to join me.

EURNZD – Short-Term Buy Opportunity
EURNZD is currently trading within a range, with 2.02600 acting as resistance and 2.01700 as support. The price has recently closed above the 50-period moving average, and the MACD momentum has shifted to the bullish side on the H1 timeframe.
This setup suggests a potential short-term buying opportunity to capture some upside movement.
However, once the current bullish move completes, I’ll be watching for short setups, as the market appears to be forming a bear flag pattern, indicating that further selling pressure may follow in the next phase.

Bearish drop off?EUR/NZD has rejected off the resistance level, which is an overlap resistance that aligns with the 38.2% Fibonacci retracement, and could drop from this level to our take profit.
Entry: 2.02391
Why we like it:
There is an overlap resistance level, which is an overlap resistance that aligns with the 38.2% Fibonacci retracement
Stop loss: 2.03580
Why we like it:
There is a pullback resistance that lines up with the 61.8% Fibonacci retracement.
Take profit: 2.00466
Why we like it:
There is a swing low support that aligns with the 61.8% Fibonacci projection.
Enjoying your TradingView experience? Review us!
Please be advised that the information presented on TradingView is provided to Vantage (‘Vantage Global Limited’, ‘we’) by a third-party provider (‘Everest Fortune Group’). Please be reminded that you are solely responsible for the trading decisions on your account. There is a very high degree of risk involved in trading. Any information and/or content is intended entirely for research, educational and informational purposes only and does not constitute investment or consultation advice or investment strategy. The information is not tailored to the investment needs of any specific person and therefore does not involve a consideration of any of the investment objectives, financial situation or needs of any viewer that may receive it. Kindly also note that past performance is not a reliable indicator of future results. Actual results may differ materially from those anticipated in forward-looking or past performance statements. We assume no liability as to the accuracy or completeness of any of the information and/or content provided herein and the Company cannot be held responsible for any omission, mistake nor for any loss or damage including without limitation to any loss of profit which may arise from reliance on any information supplied by Everest Fortune Group.

EURNZD: Another Gap 🇪🇺🇳🇿
There is a high chance that EURNZD will fill a gap down
opening soon.
A bullish breakout of a falling trend line on an hourly time frame
indicates a strong buying pressure.
Expect a rise to 2.0226
❤️Please, support my work with like, thank you!❤️
I am part of Trade Nation's Influencer program and receive a monthly fee for using their TradingView charts in my analysis.

EURNZD Under Pressure! SELL!
My dear subscribers,
My technical analysis for EURNZD is below:
The price is coiling around a solid key level - 2.0233
Bias - Bearish
Technical Indicators: Pivot Points High anticipates a potential price reversal.
Super trend shows a clear sell, giving a perfect indicators' convergence.
Goal - 2.0208
My Stop Loss - 2.0248
About Used Indicators:
By the very nature of the supertrend indicator, it offers firm support and resistance levels for traders to enter and exit trades. Additionally, it also provides signals for setting stop losses
Disclosure: I am part of Trade Nation's Influencer program and receive a monthly fee for using their TradingView charts in my analysis.
———————————
WISH YOU ALL LUCK


EUR/NZD Swing Plan: Dynamic Support Fuels Bulls😂 Steal the Pips with EUR/NZD: The Great "Thief" Swing Strategy! 💰📈
Asset: EUR/NZD (Euro vs. New Zealand Dollar)
Market: ForexStrategy: Swing/Day Trading with a Bullish "Thief" Layering Plan 😎
📊 Market Analysis & Setup
The EUR/NZD is primed for a bullish breakout! 🚀 The Hull Moving Average (HMA) has confirmed a strong bullish trend, with price action retesting the 786 Fibonacci level, acting as dynamic support.
This setup screams opportunity for savvy traders ready to "steal" some pips! 🕵️♂️
🗺️ Wealth Strategy Map
Trend Confirmation: Bullish momentum validated by the Hull Moving Average (HMA) with a clean retest of the 786 Fib level as dynamic support. 📈
Market Context: Strong bullish structure with potential to hit a liquidity pool near resistance. Watch for traps at overbought levels!
Thief Strategy: A layering approach using multiple buy limit orders to maximize entry precision and capitalize on pullbacks. 🧠
🕵️♂️ The "Thief" Entry Plan
This strategy uses a layered entry approach to stack the odds in your favor. Place buy limit orders at the following levels:
🎯 1.98000
🎯 1.98500
🎯 1.99000
🎯 1.99500
🎯 2.00000
Pro Tip: Feel free to add more layers based on your risk appetite and market conditions. The more layers, the merrier the "heist"! 😜
Flexible Entry: You can enter at any price level within this range, depending on your style. Just keep an eye on price action to confirm momentum.
🛑 Stop Loss (SL)
Thief SL: Set at 1.97000 to protect your capital from unexpected reversals.
Note: Dear Ladies & Gentlemen (Thief OGs), this SL is a suggestion. Adjust it based on your risk tolerance and account size. Trade at your own risk, and always secure your loot! 💼
🎯 Take Profit (TP) Target
Target Zone: Aim for 2.04000, where we expect a strong resistance zone, potential overbought conditions, and a liquidity pool that could trigger a trap.
Escape Plan: Exit with your profits before the market turns! This is a high-probability zone, so don’t get greedy — grab your pips and run! 🏃♂️
Note: As always, Thief OGs, this TP is a guide. Set your targets based on your strategy and risk management. Take the money when it’s there! 💸
🔍 Related Pairs to Watch
Keep an eye on these correlated pairs (priced in USD) to gauge broader market sentiment:
FX:EURUSD : A strong EUR/USD often supports bullish moves in EUR/NZD due to Euro strength. Watch for similar bullish patterns or divergences.
FX:NZDUSD : Weakness in NZD/USD can amplify EUR/NZD’s bullish momentum. Monitor for bearish signals in NZD/USD to confirm our setup.
OANDA:AUDNZD : As a closely related antipodean pair, AUD/NZD can provide clues about NZD weakness. A rising AUD/NZD may align with our bullish EUR/NZD outlook.
Key Correlation Insight: EUR/NZD often moves inversely to NZD/USD due to the NZD component. Confirm Euro strength across pairs for higher conviction! 📊
🚨 Risk Disclaimer
Trading is a high-stakes game, Thief OGs! Always manage your risk, use proper position sizing, and never bet the farm. The market is full of traps, so stay sharp and trade responsibly. 😎
✨ “If you find value in my analysis, a 👍 and 🚀 boost is much appreciated — it helps me share more setups with the community!”
#️⃣ #EURNZD #ForexTrading #SwingTrading #ThiefStrategy #HullMovingAverage #Fibonacci #PipHeist #TradingView

EURNZD| Confirmation in Key Discounted ZoneHigher timeframes show strong bullish structure, with recent highs already broken in previous weeks. Instead of remapping completely, we’ve refined previous markings and updated key levels to reflect the current flow.
Our focus remains on continuation from the higher timeframe perspective, with mid-timeframe structure carefully mapped and refined. Price is currently interacting with the lighter orange zone, roughly at the 50% equilibrium — a pivotal area where movement could go either way.
While a breach of the lower high on lower timeframes could occur, our preference is waiting for a deeper mitigation in the darker orange zone beneath the 50% equilibrium, ideally creating a spike for clean lower-timeframe confirmation.
Once we see that mitigation, we’ll monitor lower timeframe reactions to validate bullish continuation before taking entries. Until then, we remain disciplined: monitoring, following structure, and letting smart money lead the way.
Let’s keep going. 🔥

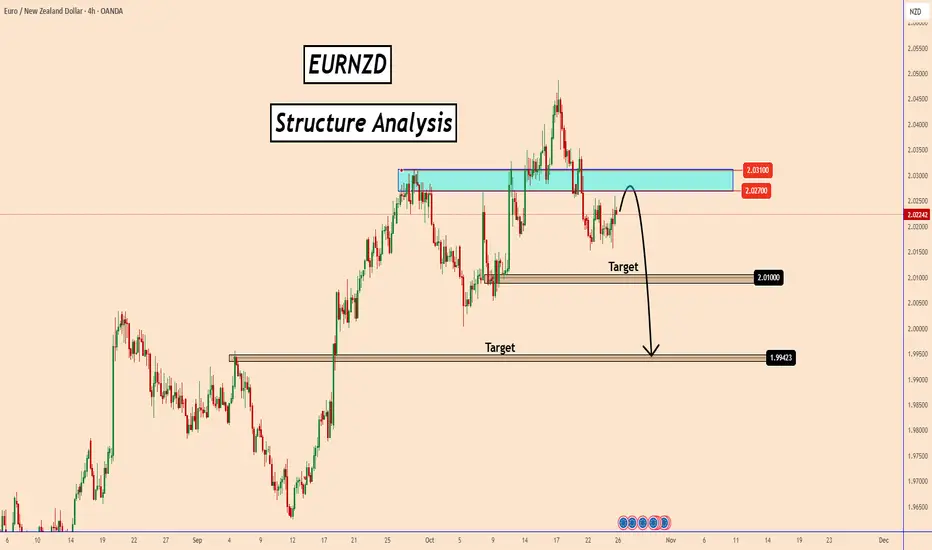
EURNZD Structure Signals Potential Downside MoveEURNZD Structure Signals Potential Downside Move
EURNZD is currently testing a key resistance zone between 2.0270 and 2.0310, an area that has acted as a strong supply zone in the past. The pair has shown multiple rejections around this level, suggesting that buyers are losing momentum and sellers may soon regain control.
The price structure indicates a potential bearish reversal if the pair fails to break and close above the resistance area. The first target for the downside move lies near 2.0100, followed by the second and more significant target around 1.9940, where strong demand previously pushed the price higher.
If bearish momentum strengthens from the current structure, EURNZD could continue to drop toward those levels in the coming days.
You may find more details in the chart!
Thank you and Good Luck!
❤️PS: Please support with a like or comment if you find this analysis useful for your trading day❤️