AUDJPY UPTRENDjpy moving up together
overal previous trend is going up
audjpy seems to be the best digest
its clear sign to buy
NZDJPY trade ideas

NZDJPY: Free Trading Signal
NZDJPY
- Classic bullish pattern
- Our team expects retracement
SUGGESTED TRADE:
Swing Trade
Buy NZDJPY
Entry - 88.612
Stop - 88.524
Take - 88.757
Our Risk - 1%
Start protection of your profits from lower levels
Disclosure: I am part of Trade Nation's Influencer program and receive a monthly fee for using their TradingView charts in my analysis.
❤️ Please, support our work with like & comment! ❤️

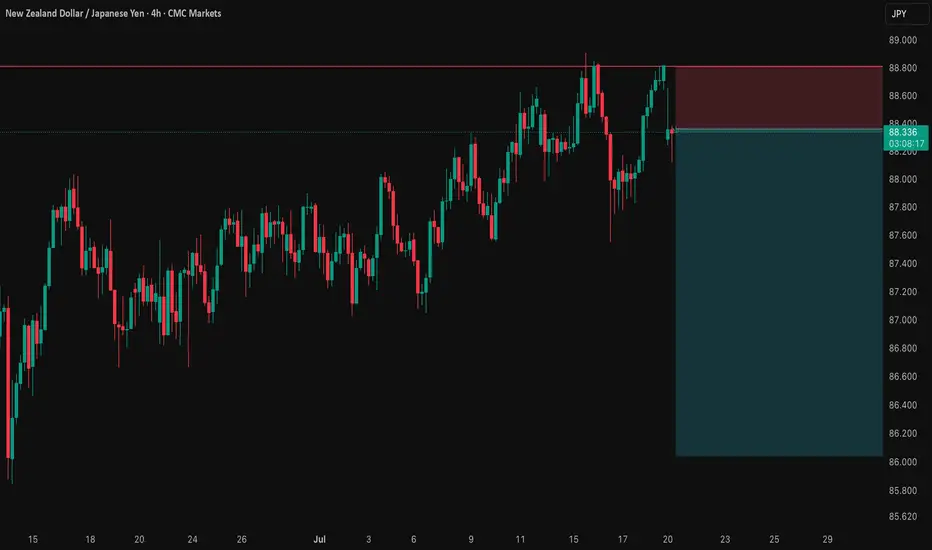
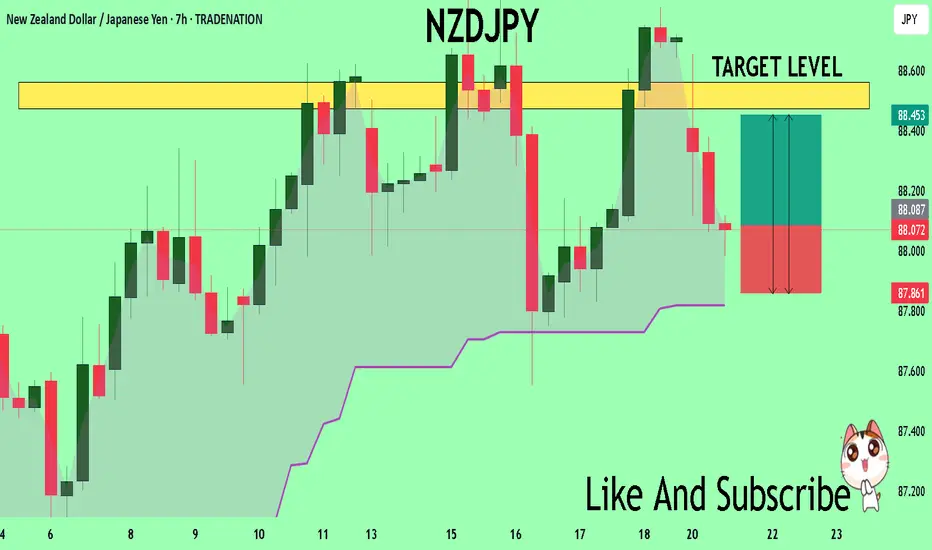
NZD_JPY SHORT FROM RESISTANCE|
✅NZD_JPY is going up now
But a strong resistance level is ahead at 88.900
Thus I am expecting a pullback
And a move down towards the target of 88.572
SHORT🔥
✅Like and subscribe to never miss a new idea!✅
Disclosure: I am part of Trade Nation's Influencer program and receive a monthly fee for using their TradingView charts in my analysis.

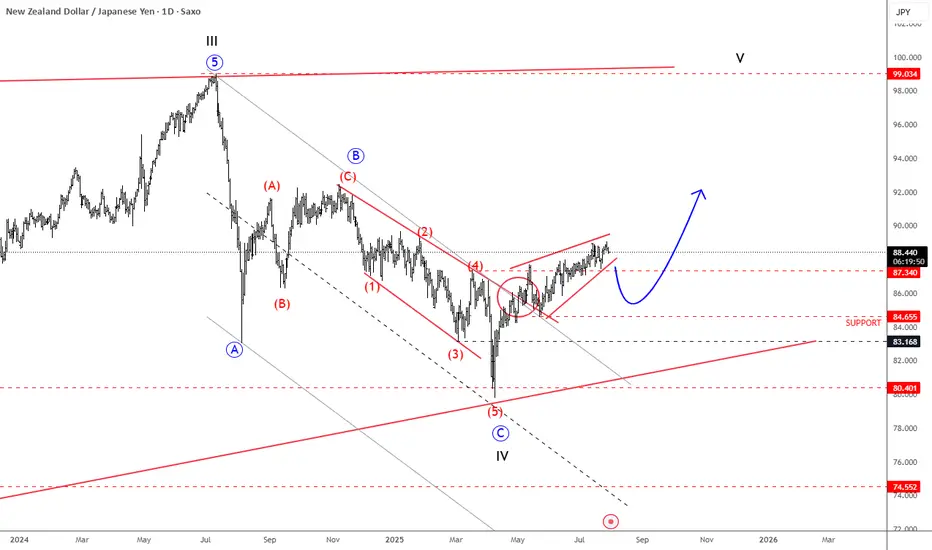
NZDJPY Is Back To Bullish ModeNZDJPY Is Back To Bullish Mode from technical and Elliott wave perspective, as we see it breaking back above trendline after a corrective decline.
NZDJPY is nicely recovering over the last few weeks after a strong rebound from 80.40 support, a key level going back to March 2023. Notice that it’s recovering after a three-wave ABC corrective decline that belongs to a higher degree wave IV correction. Current recovery looks to be in five waves, as a leading diagonal; so its a motive wave structure that already pushed above the 87.34 resistance, which is a strong bullish signal, suggesting more upside ahead. Of course, short-term pullbacks are always possible and welcome, and in that case, the 86 – 84 area could act as a nice support. But overall, we think that sooner or later the pair will target the 90 or even 92 levels, which are still possible this year. Wave V is eyeing even 100 area.
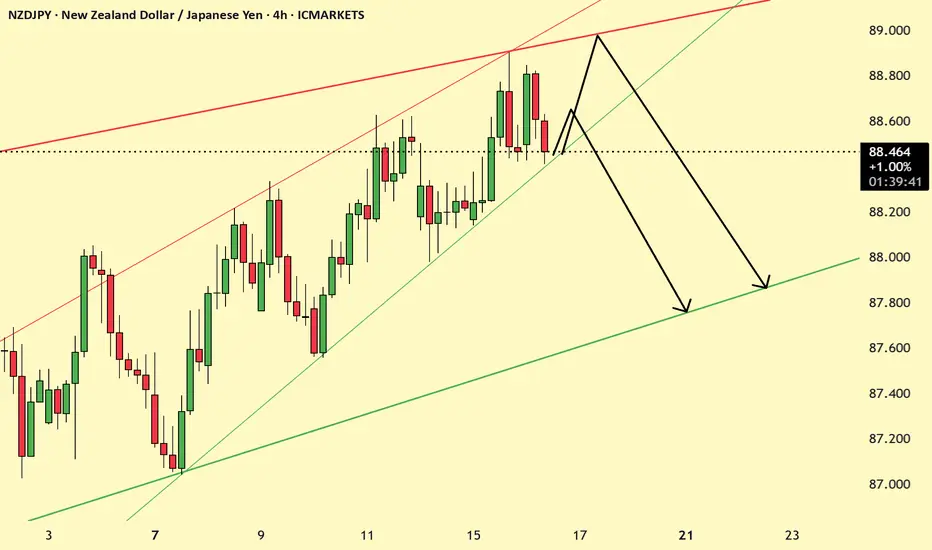
NZD-JPY Resistance Ahead! Sell!
Hello,Traders!
NZD-JPY is trading in an
Uptrend but the pair is locally
Overbought so after the pair
Hits the horizontal resistance
Level of 88.900 we will be
Expecting a local bearish
Move down
Sell!
Comment and subscribe to help us grow!
Check out other forecasts below too!
Disclosure: I am part of Trade Nation's Influencer program and receive a monthly fee for using their TradingView charts in my analysis.

NZDJPY: Long Trade Explained
NZDJPY
- Classic bullish setup
- Our team expects bullish continuation
SUGGESTED TRADE:
Swing Trade
Long NZDJPY
Entry Point - 87.616
Stop Loss - 87.361
Take Profit - 88.064
Our Risk - 1%
Start protection of your profits from lower levels
Disclosure: I am part of Trade Nation's Influencer program and receive a monthly fee for using their TradingView charts in my analysis.
❤️ Please, support our work with like & comment! ❤️


NZDJPY Massive sell coming up ahead.Theres a high probability of a sell on NZDJPY after the retest on H4
NZDJPY Set To Fall! SELL!
My dear subscribers,
My technical analysis for NZDJPY is below:
The price is coiling around a solid key level - 88.786
Bias - Bearish
Technical Indicators: Pivot Points Low anticipates a potential price reversal.
Super trend shows a clear sell, giving a perfect indicators' convergence.
Goal - 88.284
My Stop Loss - 89.075
About Used Indicators:
By the very nature of the supertrend indicator, it offers firm support and resistance levels for traders to enter and exit trades. Additionally, it also provides signals for setting stop losses
Disclosure: I am part of Trade Nation's Influencer program and receive a monthly fee for using their TradingView charts in my analysis.
———————————
WISH YOU ALL LUCK
NZD_JPY RISING SUPPORT AHEAD|LONG|
✅NZD_JPY went down from
The resistance just as I predicted
In my previous analysis but now
The pair is approaching a rising
Support line from where we will
Be expecting a local bullish rebound
LONG🚀
✅Like and subscribe to never miss a new idea!✅
Disclosure: I am part of Trade Nation's Influencer program and receive a monthly fee for using their TradingView charts in my analysis.

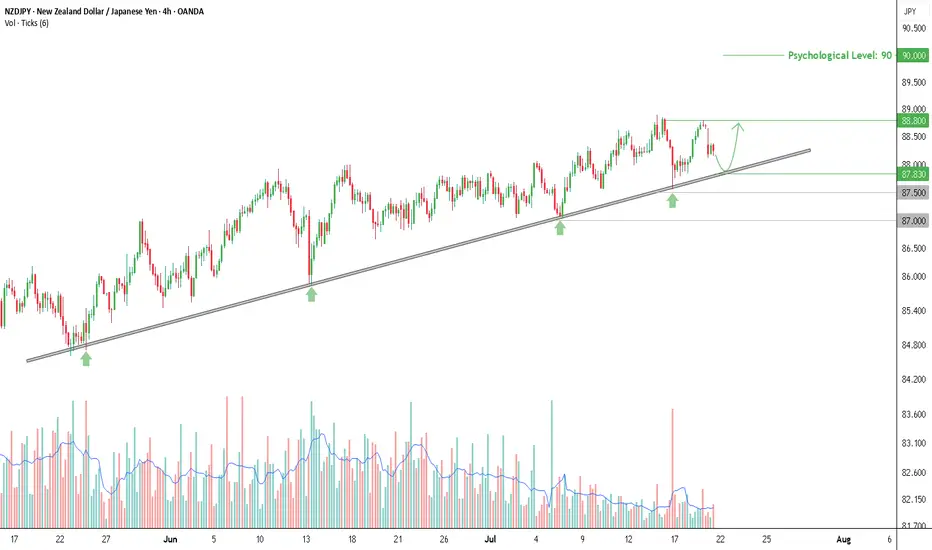
Buy Opportunity on NZDJPY, Testing Trendline with Rising VolumeThe NZDJPY chart on the 4-hour timeframe shows a consistent uptrend pattern, supported by a well-respected ascending trendline that has been tested multiple times since late May 2025. Rebounds from this trendline are marked by green arrows on the chart, indicating a strong reaction zone. Each time price touches the trendline, trading volume tends to increase—signaling active buying interest from market participants.
Currently, price is pulling back toward the trendline support area around 87.830, which could once again act as a bounce point, just like in previous sessions. As long as this trendline holds, the rebound scenario remains dominant and offers a potential opportunity for a long (buy) setup.
Entry & Take Profit
If price bounces from the trendline area, a buy entry can be considered around 87.83, with an initial take profit target at 88.80—the nearest local resistance level and previous consolidation zone.
Should the bullish momentum continue and break above 88.80, the next upside target could reach the psychological level of 90.00.
Stop Loss
As a risk boundary, a closing price below 87.50 can be used as a stop loss (SL) level, as it would indicate a potential breakdown of the higher low structure that has been forming.
If the trendline fails and price drops further, a deeper decline may extend toward the 87.00 area, which is a previously established horizontal support.
Additional Confirmation
It’s recommended to wait for bullish price action signals around the trendline area before entering a position, such as a bullish engulfing pattern, pin bar, or rejection candle. Also, monitor for a spike in volume as price approaches support, as increased volume often indicates strong buying interest.
As long as the trendline holds, the upward bounce scenario remains valid and should be considered for short- to medium-term buy strategies. The 87.83–87.90 zone is a key area to watch for the next market reaction.
Disclaimer: This analysis is part of a trading plan and does not constitute investment advice. Always use strict risk management and consider potential losses in every trade decision.
NZD_JPY PULLBACK EXPECTED|SHORT|
✅NZD_JPY has been growing recently
And the pair seems locally overbought
So as the pair has approached
A horizontal resistance of 88.900
Price fall is to be expected
SHORT🔥
✅Like and subscribe to never miss a new idea!✅
Disclosure: I am part of Trade Nation's Influencer program and receive a monthly fee for using their TradingView charts in my analysis.

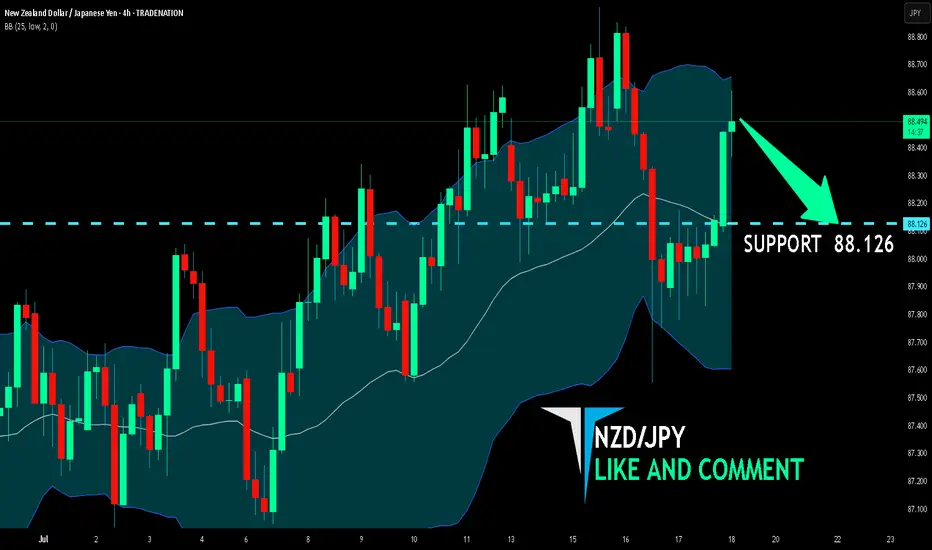
NZD/JPY BEARS ARE STRONG HERE|SHORT
Hello, Friends!
NZD/JPY pair is trading in a local uptrend which we know by looking at the previous 1W candle which is green. On the 4H timeframe the pair is going up too. The pair is overbought because the price is close to the upper band of the BB indicator. So we are looking to sell the pair with the upper BB line acting as resistance. The next target is 88.126 area.
Disclosure: I am part of Trade Nation's Influencer program and receive a monthly fee for using their TradingView charts in my analysis.
✅LIKE AND COMMENT MY IDEAS✅
NZDJPY wait for possible brekdownNZDJPY is trading in a channel pattern the price has rejected from the same level twice and is likely breakdown the trendline support enter when it retests.
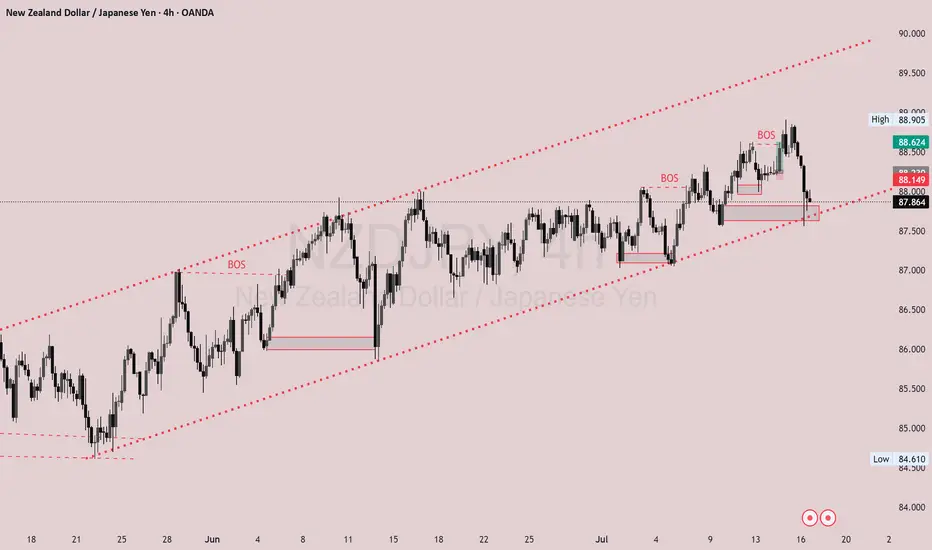
NZD/JPYhis is NZD/JPY on the 4H timeframe, and here’s what stands out:
Market Structure:
- The pair is currently respecting an ascending channel.
- Multiple Breaks of Structure (BOS) confirm bullish intent.
- Price is now testing the lower trendline of the channel — a key demand zone.
What you can do:
- Watch for bullish rejection or a candlestick confirmation (like bullish engulfing or pin bar) at the trendline.
- If confirmed, you can enter long (buy) targeting the upper channel.
- Place your stop loss just below the trendline.
NZDJPY - BullishI have a bullish bias on NZDJPY based on the following factors:
- Seasonality - NZDJPY have a probability to remain towards end of Jul, early Aug
- COT report:
- For NZD, since start of Jun, non-commercial positions on the short side have significantly decreased and longs have increased
- For JPY, since start of Jun, non-commercial positions on the long side have significantly decreased and shorts have increased
- Forex Fundamentals (Summary 3 Score) - NZD score is increasing in the last few months, whereas JPY score is decreasing in the last few months
- Fundamental News - US and EU have agreed on a trade deal with 15% tariff. This is risk on indications for the global markets since it indicates certainty going forward
Technicals:
- NZDJPY - in an uptrend on 4H and D with no divergence on either timeframes. However, price is approaching a strong resistance zone which is our TP target.

NZD/JPY BEARS ARE STRONG HERE|SHORT
Hello, Friends!
Previous week’s green candle means that for us the NZD/JPY pair is in the uptrend. And the current movement leg was also up but the resistance line will be hit soon and upper BB band proximity will signal an overbought condition so we will go for a counter-trend short trade with the target being at 88.302.
Disclosure: I am part of Trade Nation's Influencer program and receive a monthly fee for using their TradingView charts in my analysis.
✅LIKE AND COMMENT MY IDEAS✅


NzdjpyNzd dollar looks set for a return upwards after correction of uptrend downwards and a buy order placed now at 88.000 after hitting dynamic support level on the 3hr and 2 hr chart, also hit and bounce off my fibonacci 0.382 level says to me a rise up to 88.498 where I will be taking profits 📈

NZDJPY Set To Grow! BUY!
My dear friends,
My technical analysis for NZDJPY is below:
The market is trading on 88.079 pivot level.
Bias - Bullish
Technical Indicators: Both Super Trend & Pivot HL indicate a highly probable Bullish continuation.
Target - 88.472
Recommended Stop Loss - 87.861
About Used Indicators:
A pivot point is a technical analysis indicator, or calculations, used to determine the overall trend of the market over different time frames.
Disclosure: I am part of Trade Nation's Influencer program and receive a monthly fee for using their TradingView charts in my analysis.
———————————
WISH YOU ALL LUCK
NZD/JPY SHORTNZD/JPY SHORT " break of a resistance area and retest it + 50 ema dynamic support + 50% fib retracement + risk on environment"


NZD/JPY: A Data-Driven Short SignalBefore I post a trade, I put it through a rigorous, multi-step analysis. Here’s exactly what I did for this NZD/JPY setup to build a data-driven case.
I Started with the 'Why': The Fundamental Story 📰
First, I identified the powerful divergence between the dovish RBNZ and the hawkish BoJ. This gave me my core bearish thesis for the pair.
I Challenged My Idea with Data: The Stress Test 🧠
A good story isn't enough. So, I ran this bearish idea through my mathematical models . My goal was to find any hidden risks and see if the hard data supported my fundamental view.
What My Analysis Revealed: A Warning and a Confirmation ⚠️
The data came back with two critical insights:
Confirmation: The models strongly validated the bearish direction with a high degree of mathematical probability.
Warning: They exposed a hidden danger—a standard entry had a very high probability of getting stopped out in the current market.
I Engineered the Solution: The Optimized Plan 🛠️
This is the most important step. I used these data insights to build a new trade plan from the ground up. The entry, stop loss, and take profit below are not guesses; they are the output of my analysis, specifically designed to navigate the risk the data uncovered.
The result is a trade with a huge 5.15-to-1 Risk-to-Reward ratio , where my fundamental view is now backed by a data-driven execution strategy. Let's get into it. 👇
The Complete Trade Plan
Strategy & Trade Parameters ✅
📉 Pair: NZD/JPY
👉 Direction: Short
⛔️ Entry: 88.35800
🎯 Take Profit: 86.04347
🛡️ Stop Loss: 88.80723
⚖️ Risk-Reward: 5.15
This setup represents my ideal trading approach: forming a strong fundamental thesis and then using disciplined, mathematical analysis to define the execution. The result is a plan where the direction is clear and the risk is precisely managed. Trade safe.