NZDUSD H4 | Bullish Bounce Off PullbackMomentum: Bullish
Price has bounced off the buy entry, which is acting as a pullback support. This level aligns with the 38.2% Fibonacci retracement, adding significant confluence and strength to the zone.
Buy Entry: 0.5743
Overlap support
Slightly above the 38.2% Fibonacci retracement
Stop Loss: 0.5710
Pullback support invalidation
Near the 50% Fibonacci retracement
Take Profit: 0.5822
Swing high resistance
High Risk Investment Warning
Stratos Markets Limited (tradu.com ), Stratos Europe Ltd (tradu.com ):
CFDs are complex instruments and come with a high risk of losing money rapidly due to leverage. 70% of retail investor accounts lose money when trading CFDs with this provider. You should consider whether you understand how CFDs work and whether you can afford to take the high risk of losing your money.
Stratos Global LLC (tradu.com ): Losses can exceed deposits.
Please be advised that the information presented on TradingView is provided to Tradu (‘Company’, ‘we’) by a third-party provider (‘TFA Global Pte Ltd’). Please be reminded that you are solely responsible for the trading decisions on your account. Any information and/or content is intended entirely for research, educational and informational purposes only and does not constitute investment or consultation advice or investment strategy. The information is not tailored to the investment needs of any specific person and therefore does not involve a consideration of any of the investment objectives, financial situation or needs of any viewer that may receive it. Past performance is not a reliable indicator of future results. Actual results may differ materially from those anticipated in forward-looking or past performance statements. We assume no liability as to the accuracy or completeness of any of the information and/or content provided herein and the Company cannot be held responsible for any omission, mistake nor for any loss or damage including without limitation to any loss of profit which may arise from reliance on any information supplied by TFA Global Pte Ltd.
New Zealand Dollar / U.S. Dollar
No trades
Market insights

NZDUSD SELLNZDUSD - DISTRIBUTION
I see NZDUSD going lower as there's just to much supply currently, as well as the distribution that has occurred, which is in its final stages (phase D/E).... we should see an expansion playout soon enough

#NZDUSD: Three Targets, Swing Buy, Ready For Next Big MoveDear Traders
NZDUSD Chart Analysis SMC+ICT💭📊
🔺The price was rejected at 0.5580, a ‘discounted zone’ price, which was reversed without consolidation or accumulation. The price then moved in an impulse pattern and encountered strong resistance at 0.58320.
🔺A rejection at 0.58320 presents a favourable opportunity for traders to optimise the next significant price impulse. This analysis suggests a potential reversal from 0.5710.
Entry, Take Profit And Stop Loss👨💻📈
🔺 The entry between the blue and red horizontal lines indicates a significant volume zone and can be considered a discounted buying opportunity.
🔺A stop loss can be placed at the red horizontal line or increased based on your own analysis.
🔺We recommend targeting take profit first at the outset. As the price crosses our take profit level, you can consider adjusting the take profit area.
Like And Comment❤️
Team Setupsfx_🏆

NZDUSD – H4 Analysis....NZDUSD – H4 Analysis (Based on My chart)
Market Structure
Overall bullish trend on H4.
Price has reached a strong resistance / supply zone (yellow area).
Rejection visible → corrective pullback expected toward trendline & support.
Ichimoku cloud below price → pullback, not full reversal (for now).
📉 Sell (Correction) Setup
Sell Zone: 0.5830 – 0.5850
🎯 Target Points
Target 1: 0.5740
Target 2: 0.5620 (extended correction target)
❌ Invalidation
A strong H4 close above 0.5860 will invalidate the sell correction idea.
📌 Summary (Signal Style)
Pair: NZDUSD
TF: H4
Bias: Sell (Pullback / correction)
Targets: 0.5740 → 0.5620

NZDUSD Forming Continuation StructureNZDUSD is showing a healthy bullish continuation structure after a strong impulsive move to the upside. The market previously printed a clean higher high sequence, confirming trend strength, followed by a controlled pullback inside a descending channel. This type of corrective price action typically reflects profit-taking rather than trend reversal, especially when momentum remains supported above key structure levels.
Technically, the recent breakout from the falling channel signals renewed buyer interest and continuation potential. Price respecting higher lows while compressing inside the channel indicates accumulation before expansion. As long as NZDUSD holds above the channel breakout zone, the bullish bias remains intact, with upside continuation favored toward previous highs and liquidity resting above the recent swing high.
From a fundamentals perspective, NZD strength is supported by stabilization in risk sentiment and expectations that New Zealand monetary conditions remain relatively firm compared to USD. Meanwhile, the US dollar has shown periods of weakness driven by shifting rate expectations, softer inflation components, and fluctuating risk appetite. This macro backdrop aligns well with the technical bullish structure now developing on NZDUSD.
Overall, market structure, momentum, and fundamentals are aligned for further upside continuation. Pullbacks into former resistance turned support may offer favorable risk-to-reward opportunities, while sustained price acceptance above current levels keeps the bullish scenario valid. As long as the higher low structure remains intact, NZDUSD stays positioned for continuation rather than reversal.

NZDUSDThe idea is structured around a 1W FVG → 1D OB → 4H (LI) → 1W FP, with an acceptable RR.
An alternative scenario will be considered if price tests the 1D OB and forms confirmation on the 4H timeframe.

18.12.25 Daily ForecastPairs on Watch -
FX:GBPAUD
FX:NZDUSD
A short overview of the instruments I am looking at for today, multi-timeframe analysis down to what I will be looking at for an entry. Enjoy!

Potential bearish drop?Kiwi (NZD/USD) has reacted off the pivot and could drop to the 1st support, which acts as a pullback support.
Pivot: 0.5839
1st Support: 0.5816
1st Resistance: 0.5853
Disclaimer:
The opinions given above constitute general market commentary and do not constitute the opinion or advice of IC Markets or any form of personal or investment advice.
Any opinions, news, research, analyses, prices, other information, or links to third-party sites contained on this website are provided on an "as-is" basis, are intended to be informative only, and are not advice, a recommendation, research, a record of our trading prices, an offer of, or solicitation for, a transaction in any financial instrument and thus should not be treated as such. The information provided does not involve any specific investment objectives, financial situation, or needs of any specific person who may receive it. Please be aware that past performance is not a reliable indicator of future performance and/or results. Past performance or forward-looking scenarios based upon the reasonable beliefs of the third-party provider are not a guarantee of future performance. Actual results may differ materially from those anticipated in forward-looking or past performance statements. IC Markets makes no representation or warranty and assumes no liability as to the accuracy or completeness of the information provided, nor any loss arising from any investment based on a recommendation, forecast, or any information supplied by any third party

NZDUSD H4 | Bullish Continuation SetupMomentum: Bullish
The price is falling towards the buy entry, which aligns with the 23.6% Fibonacci retracement.
Buy entry: 0.5822
Overlap support
Stop loss: 0.5807
Overlap support
38.2% Fibonacci retracement
Take profit: 0.5848
Swing high resistance
High Risk Investment Warning
Stratos Markets Limited (tradu.com ), Stratos Europe Ltd (tradu.com ):
CFDs are complex instruments and come with a high risk of losing money rapidly due to leverage. 70% of retail investor accounts lose money when trading CFDs with this provider. You should consider whether you understand how CFDs work and whether you can afford to take the high risk of losing your money.
Stratos Global LLC (tradu.com ): Losses can exceed deposits.
Please be advised that the information presented on TradingView is provided to Tradu (‘Company’, ‘we’) by a third-party provider (‘TFA Global Pte Ltd’). Please be reminded that you are solely responsible for the trading decisions on your account. Any information and/or content is intended entirely for research, educational and informational purposes only and does not constitute investment or consultation advice or investment strategy. The information is not tailored to the investment needs of any specific person and therefore does not involve a consideration of any of the investment objectives, financial situation or needs of any viewer that may receive it. Past performance is not a reliable indicator of future results. Actual results may differ materially from those anticipated in forward-looking or past performance statements. We assume no liability as to the accuracy or completeness of any of the information and/or content provided herein and the Company cannot be held responsible for any omission, mistake nor for any loss or damage including without limitation to any loss of profit which may arise from reliance on any information supplied by TFA Global Pte Ltd.

NZDUSD: Bullish Momentum For 2 Weeks! Buy The Dip!Welcome back to the Weekly Forex Forecast for the week of Dec. 15 -19th.
In this video, we will analyze the following FX market: NZDUSD
NZDUSD is bearish on the HTFs, but it has started moving higher against a weakened USD.
The Daily shows the order flow is bullish, so there is no reason to sell this market in the short term.
Wait for the pullback, and by the dip.
Enjoy!
May profits be upon you.
Leave any questions or comments in the comment section.
I appreciate any feedback from my viewers!
Like and/or subscribe if you want more accurate analysis.
Thank you so much!
Disclaimer:
I do not provide personal investment advice and I am not a qualified licensed investment advisor.
All information found here, including any ideas, opinions, views, predictions, forecasts, commentaries, suggestions, expressed or implied herein, are for informational, entertainment or educational purposes only and should not be construed as personal investment advice. While the information provided is believed to be accurate, it may include errors or inaccuracies.
I will not and cannot be held liable for any actions you take as a result of anything you read here.
Conduct your own due diligence, or consult a licensed financial advisor or broker before making any and all investment decisions. Any investments, trades, speculations, or decisions made on the basis of any information found on this channel, expressed or implied herein, are committed at your own risk, financial or otherwise.

How to Use Candlesticks in a High-Probability Way | Tutorial #1In this tutorial, we break down candlestick analysis in a clear, structured, and practical way—focused on probability, context, and confirmation , not guessing.
You’ll learn what candlesticks really represent , how to read market intent behind them, and how to use them correctly within a high-probability trading framework.
🔍 What are candlesticks?
Candlesticks visually represent price behavior, showing the battle between buyers and sellers within a specific time period. Each candle tells a story—but only when read in context.
📘 Candlestick Types Covered in This Tutorial
📌 1) Shrinking Candlesticks
➡️ What is a shrinking candle?
Shows loss of momentum and potential market pause or reversal.
📌 2) Inside Bar Candlestick
➡️ What is an inside bar candle?
Indicates consolidation and compression before expansion.
📌 3) Takuri Line Candlestick
➡️ What is a Takuri Line candle?
A strong bullish rejection candle with a long lower wick.
📌 4) Hanging Man Candle
➡️ What is a hanging man candle?
Warns of potential bearish reversal after an uptrend.
📌 5) Inverted Hammer
➡️ What is an inverted hammer candle?
Shows buyer reaction after downside pressure.
📌 6) Shooting Star
➡️ What is a shooting star candle?
Signals seller dominance near highs.
📌 7) Spinning Top Candle
➡️ What is a spinning top candle?
Represents indecision between buyers and sellers.
📌 8) Spinning Bottom Candle
➡️ What is a spinning bottom candle?
Indicates uncertainty after downside movement.
📌 9) Doji Candle
➡️ What is a doji candle?
Shows balance—often a warning sign before a shift.
📌 10) Engulfing Candle
➡️ What is an engulfing candle?
Strong momentum candle that fully absorbs the previous one.
📌 11) Momentum Candlestick
➡️ What is a momentum candle?
Large-bodied candle showing aggressive participation.
📌 12) Change Color Candle
➡️ What is a change color candle?
Occurs after minimum 5 candles of one color , followed by a candle of the opposite color—often signaling momentum shift.
🧠 Best Practice
Candlesticks work best when multiple candles stack together, forming a story—not when traded individually.
This tutorial shows real chart examples of candle clustering and how to interpret them properly.
⚠️ Important Note
Candlesticks alone are NOT enough.
They should be combined with:
--> Support & Resistance
--> Areas of Confluence
--> Chart Patterns
--> Trendlines
--> Indicators
--> Other high quality traits
This is how high-probability setups are built.
👍 Want PART 2?
Leave a like and a comment below.
Follow for high-quality trading education and clean technical logic.
⚠️ DISCLAIMER
This content is for educational purposes only and does not constitute financial advice.
Trading involves risk—always conduct your own analysis.
I am not responsible for any decisions or losses based on this material.

Bullish bounce off pullback support?Kiwi (NZD/USD) is falling towards the pivot and could bounce to the 1st resistance which acts as an overlap resistance.
Pivot: 0.5682
1st Support: 0.5584
1st Resistance: 0.5838
Dow Jones (US30) is falling towards the pivot, which is a pullback support and could rise to the 161.8% Fibonacci extension.
Pivot: 47,063.30
1st Support: 45,135.60
1st Resistance: 50,049.13
Disclaimer:
The opinions given above constitute general market commentary and do not constitute the opinion or advice of IC Markets or any form of personal or investment advice.
Any opinions, news, research, analyses, prices, other information, or links to third-party sites contained on this website are provided on an "as-is" basis, are intended to be informative only, and are not advice, a recommendation, research, a record of our trading prices, an offer of, or solicitation for, a transaction in any financial instrument and thus should not be treated as such. The information provided does not involve any specific investment objectives, financial situation, or needs of any specific person who may receive it. Please be aware that past performance is not a reliable indicator of future performance and/or results. Past performance or forward-looking scenarios based upon the reasonable beliefs of the third-party provider are not a guarantee of future performance. Actual results may differ materially from those anticipated in forward-looking or past performance statements. IC Markets makes no representation or warranty and assumes no liability as to the accuracy or completeness of the information provided, nor any loss arising from any investment based on a recommendation, forecast, or any information supplied by any third party

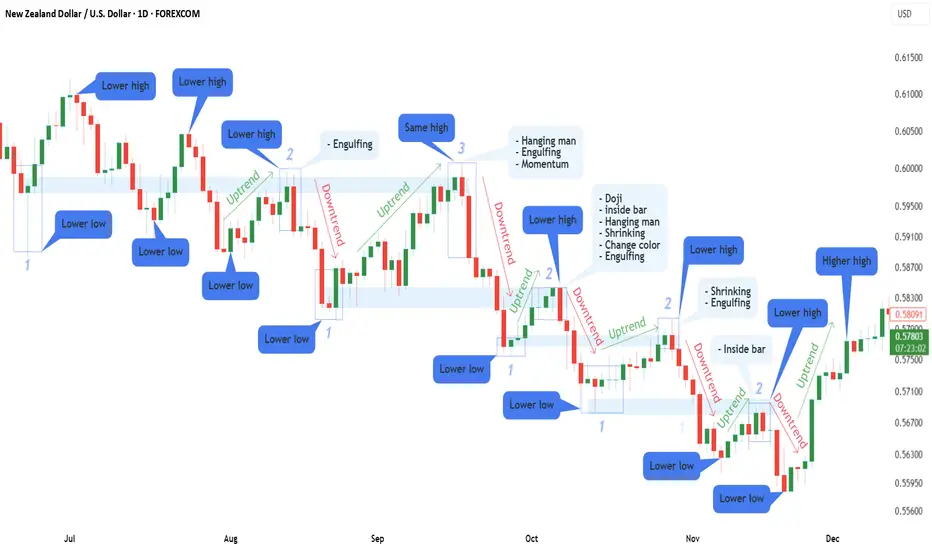
How to Use Candlesticks in a High-Probability Way | Tutorial #4Candlesticks + Support & Resistance in a Downtrend (Context Matters)
In this part, we move beyond isolated candlesticks and place them into real market context.
This tutorial focuses on combining candlesticks with Support & Resistance within a downtrend , which is where high-probability setups are actually formed.
⚠️ Important note:
This part is slightly more advanced than the previous three tutorials.
If something on the chart is unclear, feel free to ask in the comments — I’ll do my best to answer everyone.
Don’t worry if it feels complex at first.
We are just scratching the surface — from here, the real trading logic begins.
Strongly recommended:
Review Tutorials #1–#3 first.
Each part builds on the previous one, and this structure will continue throughout the series.
📌 Chart Explanation (NZDUSD Example)
I’m using NZDUSD again , the same pair from Part 1, to keep everything consistent and easier to follow.
On the chart, you can see:
1️⃣ Candlesticks
→ They show price reactions when reversals or rejections occur.
2️⃣ Support & Resistance Zones
→ Key areas where price previously reacted.
3️⃣ Numbers (1–3)
→ Represent multiple touches of support and resistance, increasing their importance.
4️⃣ Market Structure
→ Lower Highs + Lower Lows = Downtrend context
5️⃣ Directional Arrows
→ Visual guidance for trend direction and corrections.
🧠 Why Context Changes Everything
Up to now, we worked mainly with candlesticks and trend direction.
Now we add the most important missing piece for high-probability trading:
👉 Support & Resistance
Candlesticks do not create signals on their own.
They become powerful only when they appear at the right location within market structure.
(If Support & Resistance is not fully clear yet, I’ve already published Part 1 of that tutorial — feel free to ask in the comments, and I’ll gladly make Part 2.)
📈 Finding Trade Opportunities — Step by Step
(Using all 4 tutorials together)
1️⃣ Identify a downtrend
→ Lower highs & lower lows
2️⃣ Draw Support & Resistance zones
3️⃣ Wait for candlestick stacking
→ As explained in previous tutorials (clusters, sequences, pressure buildup)
🔥 Bonus Confirmation
If, after candlesticks stack together, you see:
an Engulfing candle , or
a Momentum candle
that’s a strong sign that buyers or sellers are stepping in aggressively.
This is where probability increases , not because of one candle — but because everything aligns.
🛡 Risk Management Reminder
No setup is guaranteed.
Always apply proper risk management and position sizing.
If you’re still learning or testing these concepts, it is strongly recommended to practice on a demo account first before risking real capital.
Trading is a process, not a shortcut to fast profits.
Focus on consistency, discipline, and execution — not outcomes.
🧠 Continuing the Series
If anything on the chart is unclear, feel free to ask in the comments — I’ll do my best to help.
This tutorial is part of a structured series where each part builds on the previous one.
Following simply helps you keep track of future lessons.
⚠️ DISCLAIMER
This content is for educational purposes only and does not constitute financial advice.
Trading involves risk — always conduct your own analysis.
I am not responsible for any decisions or losses based on this material.
NZDUSD Update: Kiwi Is Looking For More Upside After CorrectionWe talked about the Kiwi(NZDUSD) back in October, where we mentioned and highlighted a bottom formation within an ending diagonal / wedge pattern for wave C of an ABC corrective decline.
As you can see today, Kiwi is nicely bouncing and recovering after RBNZ cut interest rates in November, and forecasts suggest the broader committee believes the nadir has been hit for the easing cycle. So the Kiwi is coming up as no room for cuts, for now. Notice it can be now bottom after the wedge pattern into wave C, due to an impulsive recovery, which we see it as a wave 1 of a new five-wave bullish cycle. So seems like more upside is coming within wave 3 of a five-wave bullish cycle, but ideally after the current corrective setback in wave 2 with supports at 0.5750 – 0.5700.
The reason Kiwi could see more upside into late 2025 and early 2026 is due to a bullish stock market, which still has room for gains. S&P 500 and NZD/USD (Kiwi) have been in a tight positive correlation since the November lows. Therefore, if the S&P 500 is set to resume its bullish trend, the Kiwi could easily follow.

NZD-USD Local Short! Sell!
Hello,Traders!
NZDUSD is trading into a well-defined horizontal supply zone after a strong impulsive bullish leg. Price is now tapping into premium, where sell-side interest previously caused sharp displacement. A reaction from this area may trigger a bearish response, with liquidity resting below recent higher lows likely to be targeted. Time Frame 7H.
Sell!
Comment and subscribe to help us grow!
Check out other forecasts below too!
Disclosure: I am part of Trade Nation's Influencer program and receive a monthly fee for using their TradingView charts in my analysis.

Could we see a reversal from here?Kiwi (NZD/USD) is rising towards the pivot and could reverse to the 1st support, which acts as a pullback support.
Pivot: 0.5806
1st Support: 0.5780
1st Resistance: 0.5818
Disclaimer:
The opinions given above constitute general market commentary and do not constitute the opinion or advice of IC Markets or any form of personal or investment advice.
Any opinions, news, research, analyses, prices, other information, or links to third-party sites contained on this website are provided on an "as-is" basis, are intended to be informative only, and are not advice, a recommendation, research, a record of our trading prices, an offer of, or solicitation for, a transaction in any financial instrument and thus should not be treated as such. The information provided does not involve any specific investment objectives, financial situation, or needs of any specific person who may receive it. Please be aware that past performance is not a reliable indicator of future performance and/or results. Past performance or forward-looking scenarios based upon the reasonable beliefs of the third-party provider are not a guarantee of future performance. Actual results may differ materially from those anticipated in forward-looking or past performance statements. IC Markets makes no representation or warranty and assumes no liability as to the accuracy or completeness of the information provided, nor any loss arising from any investment based on a recommendation, forecast, or any information supplied by any third party

NZDUSD SHORT Market structure bearish on HTFs DH
Entry at Daily AOi
Weekly Rejection At AOi
Daily Rejection at AOi
Potential Head And Shoulder forming on the Daily
Previous Structure point Daily
Around Psychological Level 0.58000
Touching EMA H4
H4 Candlestick rejection
Rejection from Previous structure
Potential Head And Shoulder forming on the H4
TP: WHO KNOWS!
Entry 90%
REMEMBER : Trading is a Game Of Probability
: Manage Your Risk
: Be Patient
: Every Moment Is Unique
: Rinse, Wash, Repeat!
: Christ is King.


NZDUSD - TIME TO BUY NOWNZDUSD was in a recent downtrend for the last few weeks and was struggling to stay bullish, but recently it has just broken a strong resistance trend line which it tested several times and failed to break through. NZDUSD is very likely to hit the next major resistance zone which is market as the "TAKE PROFIT" LEVEL. There are many clear signs of new bullish movements. TIME TO BUY NZDUSD now

NZD/USD Trend Shift Confirmed | Pullback → Reversal Setup📈 NZD/USD – “THE KIWI”
Forex Market Trade Opportunity Guide (Swing / Day Trade)
🧠 Market Bias
BULLISH 🟢
Bullish plan confirmed with:
🔺 Triangular Moving Average pullback
🕯️ Heikin Ashi Doji candle → momentum pause + reversal signal
🔄 Trend structure shift indicating buyers stepping in
This combination signals controlled accumulation, not emotional chasing.
🎯 Entry Strategy
Entry: Any price level
➡️ PLEASE NOTE: Thief Using Layer (or) Any Price Level Entry
🔹 Layering Strategy (Multiple Buy Limits):
📍 0.57400
📍 0.57500
📍 0.57600
📍 0.57700
➡️ You may increase or adjust layers based on your own risk management.
📌 Why layering?
It reduces emotional entries, improves average price, and aligns with institutional-style execution.
🛑 Stop Loss
Thief SL: 0.57300
⚠️ Dear Ladies & Gentlemen (Thief OG’s),
Adjust your SL according to your own strategy, capital, and risk profile.
📎 This SL is a reference, not a recommendation.
🎯 Target / Exit Logic
Target: 0.58500
🚔 Moving Average acts as a “Police Barricade”
Strong dynamic resistance
Overbought conditions likely
Potential bull trap + corrective reaction
➡️ Kindly escape with profits near resistance zones.
⚠️ Dear Ladies & Gentlemen (Thief OG’s),
I am not recommending using only my TP.
Profit-taking is your responsibility.
🔗 RELATED PAIRS TO WATCH (Correlation Insight)
💵 USD-Related
TVC:DXY (US Dollar Index):
⬇️ Weak DXY = ⬆️ NZD/USD bullish continuation
$EUR/USD:
Strength here often confirms USD weakness
$AUD/USD:
Strong positive correlation with NZD (commodity-linked currencies)
🧾 Commodity Link
$XAU/USD (Gold):
Risk-on flows into commodities often support NZD strength
📌 If AUD/USD and EUR/USD stay bid while DXY weakens, NZD/USD bullish bias strengthens.
🌍 ECONOMIC FACTORS TO CONSIDER BEFORE ENTRY
🇳🇿 New Zealand (NZD Drivers)
📊 RBNZ Interest Rate Decisions
📉 Inflation (CPI) trends
🥛 Dairy prices & export demand
🇨🇳 China growth data (key NZ trade partner)
🇺🇸 United States (USD Drivers)
🏦 Federal Reserve policy outlook
📈 CPI / Core PCE inflation data
👷 NFP & unemployment data
📉 Bond yields & risk sentiment
🌐 Macro Environment
Risk-ON → NZD strengthens
Risk-OFF → USD demand increases
📌 Always align technical bias with macro flow.
✅ Final Notes
✔️ Technical confirmation present
✔️ Structured risk via layering
✔️ Macro alignment improves probability
❌ No emotional entries
❌ No blind TP/SL copying
💬 If this setup aligns with your view, support with a LIKE ❤️ and SHARE your thoughts below.
📌 Trade smart. Trade disciplined. Let price do the talking.

NZDUSD bullish consolidation breakout support at 0.5746The NZDUSD remains in a bullish trend, with recent price action showing signs of a breakout within the broader uptrend.
Support Zone: 0.5746 – a key level from previous consolidation. Price is currently testing or approaching this level.
A bullish rebound from 0.5746 would confirm ongoing upside momentum, with potential targets at:
0.5835 – initial resistance
0.5870 – psychological and structural level
0.5910 – extended resistance on the longer-term chart
Bearish Scenario:
A confirmed break and daily close below 0.5746 would weaken the bullish outlook and suggest deeper downside risk toward:
0.5725 – minor support
0.5690 – stronger support and potential demand zone
Outlook:
Bullish bias remains intact while the NZDUSD holds above 0.5746 A sustained break below this level could shift momentum to the downside in the short term.
This communication is for informational purposes only and should not be viewed as any form of recommendation as to a particular course of action or as investment advice. It is not intended as an offer or solicitation for the purchase or sale of any financial instrument or as an official confirmation of any transaction. Opinions, estimates and assumptions expressed herein are made as of the date of this communication and are subject to change without notice. This communication has been prepared based upon information, including market prices, data and other information, believed to be reliable; however, Trade Nation does not warrant its completeness or accuracy. All market prices and market data contained in or attached to this communication are indicative and subject to change without notice.

NZDUSD outlookAs we can see NZDUSD is still bearish on the 1h timeframe and gave nice sell opportunities.
I will look for another chance to sell until we reached the blue marked zones. If reached, I would look for buy opportunities.

NZDUSD H4 | Bearish Reaction Off Pullback ResistanceMomentum: Bearish
Price is currently below the ichimoku cloud.
Sell entry: 0.57632
- Strong pullback resistance
- 50% Fib retracement
- 78.6% Fib projection
- Fair value gap
Stop Loss: 0.57829
- Multi-swing high resistance
Take Profit: 0.57409
- Multi-swing low support
High Risk Investment Warning
Stratos Markets Limited (tradu.com/uk ), Stratos Europe Ltd (tradu.com/eu ):
CFDs are complex instruments and come with a high risk of losing money rapidly due to leverage. 70% of retail investor accounts lose money when trading CFDs with this provider. You should consider whether you understand how CFDs work and whether you can afford to take the high risk of losing your money.
Stratos Global LLC (tradu.com/en ): Losses can exceed deposits.
Please be advised that the information presented on TradingView is provided to Tradu (‘Company’, ‘we’) by a third-party provider (‘TFA Global Pte Ltd’). Please be reminded that you are solely responsible for the trading decisions on your account. Any information and/or content is intended entirely for research, educational and informational purposes only and does not constitute investment or consultation advice or investment strategy. The information is not tailored to the investment needs of any specific person and therefore does not involve a consideration of any of the investment objectives, financial situation or needs of any viewer that may receive it. Past performance is not a reliable indicator of future results. Actual results may differ materially from those anticipated in forward-looking or past performance statements. We assume no liability as to the accuracy or completeness of any of the information and/or content provided herein and the Company cannot be held responsible for any omission, mistake nor for any loss or damage including without limitation to any loss of profit which may arise from reliance on any information supplied by TFA Global Pte Ltd.
