NZDUSD Review October 22 2025Short-term price movement ideas.
The price has fully played out according to yesterday’s scenario, and we have now reached the nearest area of interest — from which further downside movement can be expected in the form of a weekly FVG.
During the FVG test, we also saw a daily liquidity sweep that has already been partially confirmed on the 4H timeframe.
From here, we should expect either a 4H structure break or a retest of the already-formed area of interest with confirmation on a lower timeframe, in order to consider opening a short position.
Be flexible, adapt to the market, and the results will come quickly. Good luck to everyone.
New Zealand Dollar / U.S. Dollar
No trades
Trade ideas

NZDUSD H1 | Potential Bearish Reversal off Key Fibonacci LevelKIWI (NZD/USD) is rising towards the sell entry which is a pullback resistance that aligns with the 138.2% Fibonacci extension and could reverse from this level to the take profit.
Sell entry is at 0.5767, whichis a pullback resistance that lines up with the 138.2% Fibonacci extension.
Stop loss is at 0.5782, whichis a pullback resistance.
Take profit is at 0.5727, whichis a pullback support.
Stratos Markets Limited (tradu.com):
CFDs are complex instruments and come with a high risk of losing money rapidly due to leverage. 68% of retail investor accounts lose money when trading CFDs with this provider. You should consider whether you understand how CFDs work and whether you can afford to take the high risk of losing your money.
Stratos Europe Ltd (tradu.com ):
CFDs are complex instruments and come with a high risk of losing money rapidly due to leverage. 70% of retail investor accounts lose money when trading CFDs with this provider. You should consider whether you understand how CFDs work and whether you can afford to take the high risk of losing your money.

NZDUSD Forming Bearish ContinuationNZDUSD on the 4H timeframe is currently showing a clear bearish continuation structure after a sharp impulsive drop. The pair has formed a rising wedge pattern, which typically signals a potential downside breakout. Price has been consolidating between 0.5720 and 0.5760, and momentum appears to be fading near the wedge resistance, suggesting sellers may soon regain control. If a clean breakout occurs below the lower trendline, it could trigger further downside continuation toward the 0.5650–0.5600 support area.
Fundamentally, the New Zealand dollar remains under pressure due to softer domestic data and the Reserve Bank of New Zealand’s cautious tone regarding future rate hikes. Meanwhile, the US dollar is staying firm amid steady economic performance and a resilient labor market, supported by expectations that the Federal Reserve will maintain higher interest rates longer than previously anticipated. This macro backdrop continues to favor the USD over NZD in the short term.
If bearish momentum continues and price breaks decisively below 0.5720, traders may look for short opportunities targeting the next major support zones. Until then, the pair remains within a corrective structure, but overall sentiment supports the bearish outlook, aligning with both technical and fundamental direction for potential profit setups.

NZDUSD short we see dollar strength coming in at the start of the week.
we see price had a massive impulse more down.
created a retracement and a continuation pattern, a rising wedge.
which broke out. now expecting a move to the downside

NZDUSD: Is it ready to push up?From a Fundamental point of view, if the situation between US and China calms down, AUD and NZD should benefit. From technical point of view and based on WTW Concept, OANDA:NZDUSD most likely will be going up even if it breaks the low.
WTW 4 Golder Rules:
1) Do not jump in
2) Do not over risk/trade
3)Do not trade without Stop Loss
4) Never ever add to a losing position!
Trade with care
We Trade Waves
WTW Team
Disclosure: We are part of Trade Nation's Influencer program and receive a monthly fee for using their TradingView charts in our analysis.

NZDUSD: Time to Fall! 🇳🇿🇺🇸
NZDUSD may drop lower significantly, following a confirmed breakout
of a support line of a symmetrical triangle pattern.
With a high probability, the price will reach 0.569 level soon.
❤️Please, support my work with like, thank you!❤️
I am part of Trade Nation's Influencer program and receive a monthly fee for using their TradingView charts in my analysis.

NZDUSD Review October 21 2025Short-term price movement ideas.
The price has formed a weekly short FVG, serving as the main zone for the continuation of the downward movement. At the moment, we still have a daily liquidity grab to the upside and confirmed volume support. Inside the daily zone, there are several local lows acting as triggers for potential price movement. If one of these lows is swept and confirmed on a lower timeframe, a long position can then be considered with the target at the weekly FVG.
Be flexible, adapt to the market, and the results will come quickly. Good luck to everyone.

RBNZ stuck between growth & inflation - what’s next for Kiwi?New Zealand’s inflation rate is no longer falling. The annual inflation rate rose to 3%, hitting the top of the Reserve Bank of New Zealand’s target band and marking a 15-month high, up from 2.7% previously.
Because this increase was in line with forecasts, it is unlikely to stop the RBNZ from cutting rates further.
Markets expect the central bank to lower the Official Cash Rate once more next month, its final decision of the year, bringing it to 2.25%.
However, there is a risk that lower rates could overstimulate inflation. That tension is possibly reflected in the New Zealand dollar. The NZD has possibly found support as traders weighed the possibility that this might be the last in the current cycle. On the chart, NZDUSD has bounced from the 0.5650 area, its lowest since early 2024, before recovering toward 0.5740.
If inflation remains sticky and the RBNZ turns more cautious, the kiwi could strengthen back toward 0.5850. But if economic data continue to deteriorate and rate cuts proceed as planned, renewed weakness toward 0.5600 or lower remains a possibility.

NZDUSD LONGNZDUSD - Accumulation
Data out of china has been positive.
price is cheap (area's worth buying)
It seems we've entered the last phases of the accumulation so i'll be waiting for a break and a re-test to begin looking for some long positions

NZD-USD Free Signal! Sell!
Hello,Traders!
NZDUSD Price will soon be reacting from a horizontal supply area to collect liquidity. Smart money may look to drive price lower toward the internal sell-side liquidity resting near 0.5740. Expect continuation if the level holds.
-------------------
Stop Loss: 0.5758
Take Profit: 0.5741
Entry: 0.5751
Time Frame: 3H
-------------------
Sell!
Comment and subscribe to help us grow!
Check out other forecasts below too!
Disclosure: I am part of Trade Nation's Influencer program and receive a monthly fee for using their TradingView charts in my analysis.

BULLS in or OUT on NZDUSDLooking at the pennant structure, a break and retest may truly affirm that NU might buy more in the near future terms. This is just a technical revelation and not a trading advice.

NZDUSD: Bullish Anticipation..NZDUSD have been scaling on a momentum region of lower high and lows, which the pair is currently at the support zone and price slowly heading up. there is a chance of bullish at the moment in regard to the trendline structure.
Meanwhile we keep a close look at 0.5968 as the next partial resistance.
Hello traders, what is your idea on this ?
Thanks for reading.

NZDUSD Bearish continuation resistance at 0.5760 The NZDUSD pair is currently trading with a bearish bias, aligned with the broader downward trend. Recent price action shows a retest of the falling resistance, suggesting a continuation of the selling pressure within the downtrend.
Key resistance is located at 0.5760, a prior consolidation zone. This level will be critical in determining the next directional move.
A bearish rejection from 0.5760 could confirm the resumption of the downtrend, targeting the next support levels at 0.5680, followed by 0.5660 and 0.5630 over a longer timeframe.
Conversely, a decisive breakout and daily close above 0.5760 would invalidate the current bearish setup, shifting sentiment to bullish and potentially triggering a move towards 0.5780, then 0.5800.
Conclusion:
The short-term outlook remains bearish unless the pair breaks and holds above 0.5760. Traders should watch for price action signals around this key level to confirm direction. A rejection favours fresh downside continuation, while a breakout signals a potential trend reversal or deeper correction.
This communication is for informational purposes only and should not be viewed as any form of recommendation as to a particular course of action or as investment advice. It is not intended as an offer or solicitation for the purchase or sale of any financial instrument or as an official confirmation of any transaction. Opinions, estimates and assumptions expressed herein are made as of the date of this communication and are subject to change without notice. This communication has been prepared based upon information, including market prices, data and other information, believed to be reliable; however, Trade Nation does not warrant its completeness or accuracy. All market prices and market data contained in or attached to this communication are indicative and subject to change without notice.


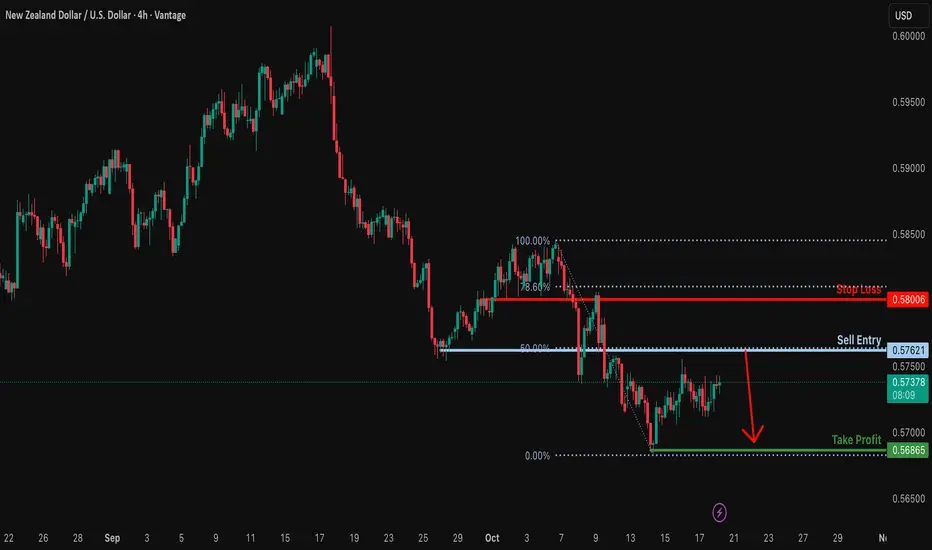
Bearish continution?NZD/USD is rising towards a resistance level, which is a pullback resistance that aligns with the 50% Fibonacci retracement. Price could reverse from this level towards our take profit target.
Entry: 0.5762
Why we like it:
This level aligns with a pullback resistance and the 50% Fibonacci retracement.
Stop Loss: 0.5800
Why we like it:
It is placed just above a pullback resistance near the 78.6% Fibonacci retracement, offering protection against false breakouts.
Take Profit: 0.5686
Why we like it:
This level coincides with a swing low support, providing a potential target for a bearish reversal.
Enjoying your TradingView experience? Review us!
Please be advised that the information presented on TradingView is provided to Vantage (‘Vantage Global Limited’, ‘we’) by a third-party provider (‘Everest Fortune Group’). Please be reminded that you are solely responsible for the trading decisions on your account. There is a very high degree of risk involved in trading. Any information and/or content is intended entirely for research, educational and informational purposes only and does not constitute investment or consultation advice or investment strategy. The information is not tailored to the investment needs of any specific person and therefore does not involve a consideration of any of the investment objectives, financial situation or needs of any viewer that may receive it. Kindly also note that past performance is not a reliable indicator of future results. Actual results may differ materially from those anticipated in forward-looking or past performance statements. We assume no liability as to the accuracy or completeness of any of the information and/or content provided herein and the Company cannot be held responsible for any omission, mistake nor for any loss or damage including without limitation to any loss of profit which may arise from reliance on any information supplied by Everest Fortune Group.
NZD/USD Recovers, Are Gains Just Getting Started?Market Analysis: NZD/USD Recovers, Are Gains Just Getting Started?
NZD/USD is also correcting losses and might recover if there is a clear move above 0.5760.
Important Takeaways for NZD/USD Analysis Today
- NZD/USD is attempting a recovery wave above 0.5700.
- There was a break above a major bearish trend line with resistance near 0.5720 on the hourly chart of NZD/USD.
NZD/USD Technical Analysis
On the hourly chart of NZD/USD, the pair also followed a similar pattern and declined from the 0.5800 zone. The New Zealand Dollar gained bearish momentum and traded below 0.5750 against the US Dollar.
The pair even dropped below the 50-hour simple moving average and tested 0.5680. A low was formed near 0.5682, and the pair is now attempting a fresh increase. It is back above 0.5700 and the 50-hour simple moving average.
Besides, there was a break above a major bearish trend line with resistance near 0.5720. The pair tested the 50% Fib retracement level of the downward wave from the 0.5806 swing high to the 0.5682 low.
On the upside, the pair is facing a barrier near 0.5745. The next key breakout zone sits near the 61.8% Fib retracement at 0.5760. If there is a move above 0.5760, the pair could rise toward 0.5805. Any more gains might open the doors for a move to 0.5850.
On the downside, immediate support on the NZD/USD chart is near 0.5730. The next key area for the bulls might be 0.5710. If there is a downside break below 0.5710, the pair could extend the decline toward 0.5680. The main target for the bears below 0.5680 might be 0.5620.
This article represents the opinion of the Companies operating under the FXOpen brand only. It is not to be construed as an offer, solicitation, or recommendation with respect to products and services provided by the Companies operating under the FXOpen brand, nor is it to be considered financial advice.

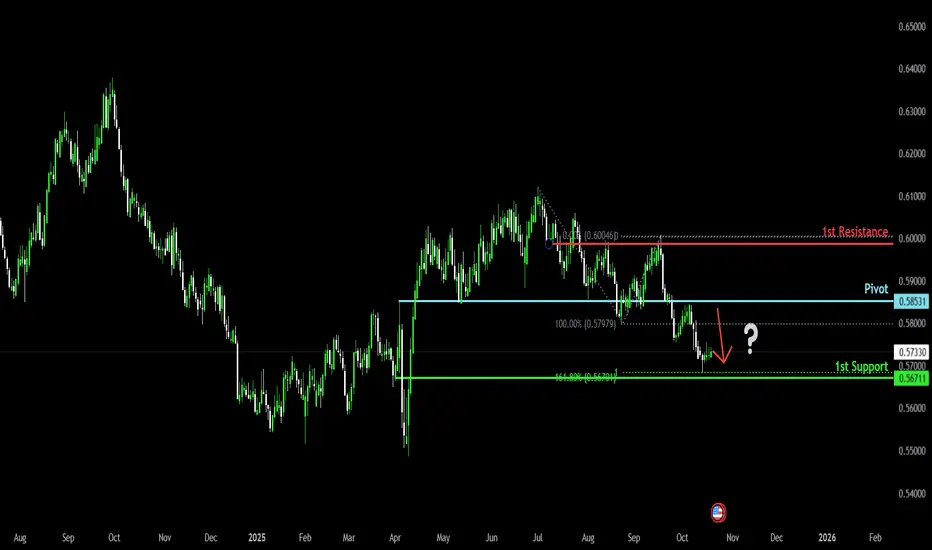
Bearish continuation setup?The Kiwi (NZD/USD) is rising towards the pivot which is an overlap resistance and could reverse to the 1st support.
Pivot: 0.5853
1st Support: 0.5671
1st Resistance: 0.5988
Disclaimer:
The above opinions given constitute general market commentary, and do not constitute the opinion or advice of IC Markets or any form of personal or investment advice.
Any opinions, news, research, analyses, prices, other information, or links to third-party sites contained on this website are provided on an "as-is" basis, are intended only to be informative, is not an advice nor a recommendation, nor research, or a record of our trading prices, or an offer of, or solicitation for a transaction in any financial instrument and thus should not be treated as such. The information provided does not involve any specific investment objectives, financial situation and needs of any specific person who may receive it. Please be aware, that past performance is not a reliable indicator of future performance and/or results. Past Performance or Forward-looking scenarios based upon the reasonable beliefs of the third-party provider are not a guarantee of future performance. Actual results may differ materially from those anticipated in forward-looking or past performance statements. IC Markets makes no representation or warranty and assumes no liability as to the accuracy or completeness of the information provided, nor any loss arising from any investment based on a recommendation, forecast or any information supplied by any third-party.
NZD/USD 4H SetupPrice is showing bullish momentum after holding above key support.
Currently expecting a retest of the 0.5730–0.5740 zone before continuation toward the 0.5800 resistance area.
Setup: Buy on retracement
📈 Target: 0.5807
📉 Stop Loss: 0.5710

NZDUSD bearish move to h2 supportBased on the breakout observed on the 1-hour timeframe and its confirmation 15-minute chart — which itself was validated by the M3 structure break within the highlighted golden zone — we expect the price to continue its decline toward the h2 support level.
This setup provides a strong risk-to-reward ratio, as illustrated on the chart.
As always — stay patient, follow your plan, and trust your analysis.

Nzd/Usd - Breakout Setup Loading – Big Move Ahead?Price is currently trading around 0.57235, showing clear consolidation between well-defined supply and demand zones.
🔴 Resistance Zone (Supply): 0.57400 - 0.57480
🟢 Support Zone (Demand): 0.57100 - 0.57180
Scenario 1 – Bullish Breakout:
If price breaks and holds above the resistance zone, we could see a bullish continuation towards the next target at 0.57750+. Watch for a confirmed retest and bullish structure to enter long positions.
Scenario 2 – Bearish Rejection:
If price fails to break the resistance and moves below the support zone, this could trigger a move towards the next demand level around 0.56800, completing the bearish target.
Key Notes:
Consolidation suggests an imminent breakout.
Wait for confirmation and avoid chasing moves without structure or retest.
Volume and momentum can help confirm direction once a breakout occurs.
Bias: Neutral until breakout — prepare for both scenarios.

NZDUSD – Bullish Reversal Setup | Daily Analysis🧭 Market Context
NZDUSD has been in a consistent downtrend since mid-July, forming lower highs and lower lows.
Recently, price has reached a major daily demand zone (0.5610–0.5680), where buyers previously stepped in aggressively.
Momentum is starting to slow, suggesting potential buyer interest and the possibility of a short-term bullish correction.
📊 Technical Breakdown
Structure: Market structure remains bearish overall, but the pair is currently testing a key demand zone.
Liquidity Sweep: Price grabbed liquidity below the previous swing low, then bounced — a possible smart money accumulation signal.
FVG (Fair Value Gap): There’s an unfilled imbalance around 0.5800–0.5850, which may attract price back up.
Volume & Candlestick Behavior: Rejection wicks near the lows and slowing bearish candles indicate seller exhaustion.
💡 Trade Plan
Entry Zone: 0.5720 – 0.5660 (confirmation entry on demand reaction)
Stop-Loss: Below 0.5610 (structure break / demand invalidation)
Take-Profit Targets:
🎯 TP1: 0.5800 (FVG / structure retest)
🎯 TP2: 0.5945 (major resistance zone)
🧠 Bias & Outlook
Bullish short-term, expecting a corrective move to fill inefficiencies above before potential continuation of the broader downtrend.
If price fails to hold above 0.5610, bearish momentum may resume.
🔍 Summary
NZDUSD is showing signs of a potential reversal from key daily demand after an extended bearish run.
Buyers are likely to target inefficiency zones around 0.5800–0.5940 before deciding the next major move.
This setup offers a medium-term swing buy opportunity with clean structure and strong technical confluence.
Disclaimer:
This analysis is for educational purposes only. Always conduct your own analysis and manage risk responsibly.

NZD/USD| Bearish Structure & Premium OB
Bias: Bearish
4H Overview:
• High timeframe structure is bearish — price broke significant highs and major lows, confirming downward momentum.
30M–5M Refinement:
• Midterm structure mapped.
• Buy-side liquidity spotted above in premium OB zones.
• Waiting for buy-side liquidity to be taken before potential entry.
Lower Timeframe Focus:
• Let smart money dictate direction — monitor for reaction before entries.
Mindset Note:
Patience is key — allow structure and liquidity to confirm before acting.

NZDUSD BUYUSD/NZD Analysis 🧠📉
Price formed a Head and Shoulders pattern and just showed a Break of Structure (BOS) to the downside. I’m now waiting for a retracement back to the neckline / POI for a possible sell setup. Once price returns, I’ll look for an engulfing candle or any strong bearish confirmation to secure the best entry for this trade.
