Bearish reversal off pullback resistance?The Kiwi (NZD/USD) is reacting off the pivot and could reverse to the pullback support.
Pivot: 0.5889
1st Support: 0.5789
1st Resistance: 0.5987
Risk Warning:
Trading Forex and CFDs carries a high level of risk to your capital and you should only trade with money you can afford to lose. Trading Forex and CFDs may not be suitable for all investors, so please ensure that you fully understand the risks involved and seek independent advice if necessary.
Disclaimer:
The above opinions given constitute general market commentary, and do not constitute the opinion or advice of IC Markets or any form of personal or investment advice.
Any opinions, news, research, analyses, prices, other information, or links to third-party sites contained on this website are provided on an "as-is" basis, are intended only to be informative, is not an advice nor a recommendation, nor research, or a record of our trading prices, or an offer of, or solicitation for a transaction in any financial instrument and thus should not be treated as such. The information provided does not involve any specific investment objectives, financial situation and needs of any specific person who may receive it. Please be aware, that past performance is not a reliable indicator of future performance and/or results. Past Performance or Forward-looking scenarios based upon the reasonable beliefs of the third-party provider are not a guarantee of future performance. Actual results may differ materially from those anticipated in forward-looking or past performance statements. IC Markets makes no representation or warranty and assumes no liability as to the accuracy or completeness of the information provided, nor any loss arising from any investment based on a recommendation, forecast or any information supplied by any third-party.
NZDUSD trade ideas

NZDUSD LONG 4HBullish Trend after bullish divergence.
Respecting Trendline
taking Instant entry and SL below last HL

Scalping Buy Trade on NZD USDI entered a quick scalping long position on NzD USD from the 30-minute chart.

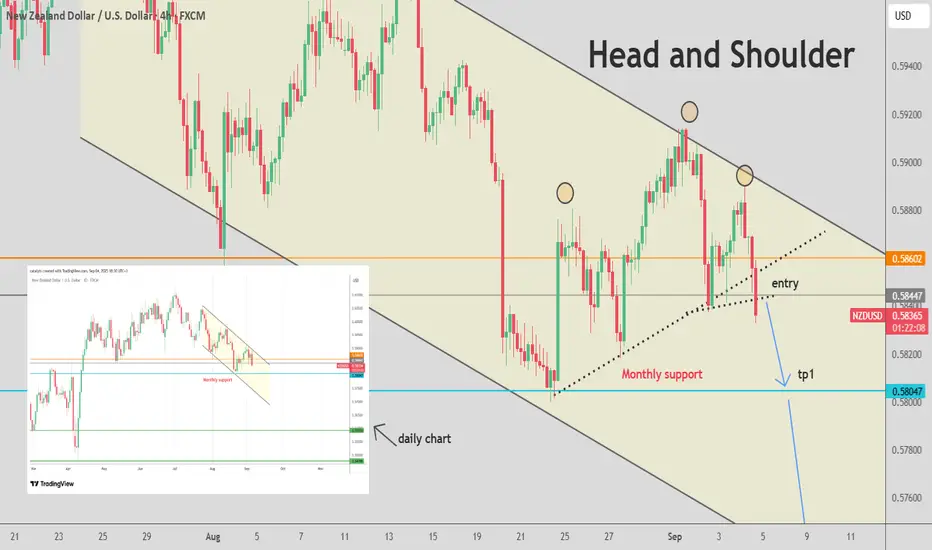
NZDUSD--Head and Shoulder--monthly bullish
--weekly bullish
--daily bullish
--tp and entry levels are as shown on chart
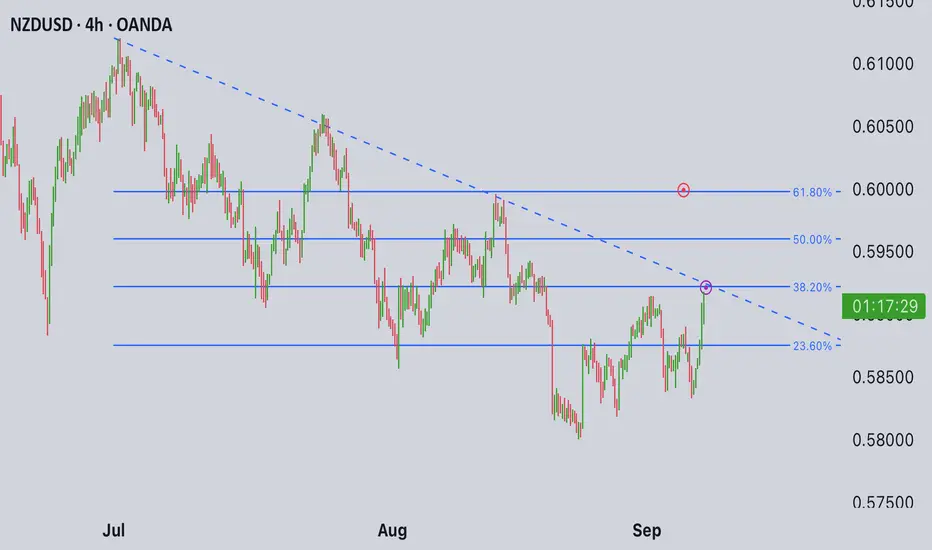
NZDUSDthis pair are in downtrent, we have a retracement to our fibo 50 and 60 zone and there we have good retracement also we have head and shoulder pattern, so might go down after this and in D timeframe we need to fill a cable and to go to our buy point 0.56600, GL...

NZDUSD Pauses as Traders Await Key U.S. DataThe NZDUSD pair has entered a consolidation phase after rebounding from the lower low area of the descending channel (image 1). The Kiwi Dollar gained some strength earlier this week as the U.S. Dollar softened, but momentum has since stalled as traders wait for U.S. GDP and the PCE Price Index.
Why the Kiwi Stalled
Fed Signals: Comments from New York Fed President John Williams suggested potential rate cuts ahead, pushing USD lower and lifting NZD temporarily.
Wait-and-See Mode: With GDP and inflation reports looming, traders are reluctant to take aggressive positions.
What to Watch This Week
U.S. GDP: Stronger growth = USD strength; weaker growth = Kiwi relief rally.
PCE Price Index: The Fed’s preferred inflation gauge. Stubborn inflation could delay rate cuts, while softer data would likely weaken USD.
Risk Sentiment: NZD remains a “risk-sensitive” currency, so global equities and commodity flows will also play a role.
Short-Term Trading Setup ⚡
Bias: Rebound from lower channel, cautious upside.
Entry Zone: 0.5850 – 0.5875.
Target: 0.5960 (mid-channel resistance).
Stop Loss: Below 0.5800.
RR: ~1:3.
If U.S. data surprises stronger, watch for a retest of 0.5800 as key support.
Final Summary
NZDUSD is caught between a soft USD outlook from potential Fed easing and cautious sentiment ahead of U.S. data. Traders should watch GDP and PCE closely — they’re likely to set the next big move.
For now, the Kiwi holds near the channel’s lower boundary, offering tactical rebound setups, but the bigger picture still points to a downtrend unless a breakout confirms.
👉 Follow me for more 1:5 RR trade ideas and real-time FX setups.

NZDUSD Channel Down targeting 0.57500.The NZDUSD pair has been trading within a Channel Down since the July 01 High and right now it is on its latest Bullish Leg.
The 1D RSI has already touched its Lower Highs trend-line, so that's an indication that the Bullish Leg might have topped already, given also the fact that the price has almost touched the 0.618 Fibonacci retracement level also, marginally above which all previous Lower Highs have been made.
As a result, we can expect the new Bearish Leg to decline by as much as -3.13% (according to the declining rate on every Bearish Leg), with our fair Target placed at 0.57500.
-------------------------------------------------------------------------------
** Please LIKE 👍, FOLLOW ✅, SHARE 🙌 and COMMENT ✍ if you enjoy this idea! Also share your ideas and charts in the comments section below! This is best way to keep it relevant, support us, keep the content here free and allow the idea to reach as many people as possible. **
-------------------------------------------------------------------------------
💸💸💸💸💸💸
👇 👇 👇 👇 👇 👇

NZDUSD H1 | Could the Kiwi reverse from here?Based on the H1 chart analysis, we could see the price rise to the sell entry, which is a pullback resistance and could reverse to the downside.
Sell entry is at 0.5879, which is a pullback resistance.
Stop loss is at 0.5896, which is a pullback resistance.
Take profit is at 0.5852, which is a pullback support.
High Risk Investment Warning
Trading Forex/CFDs on margin carries a high level of risk and may not be suitable for all investors. Leverage can work against you.
Stratos Markets Limited (tradu.com ):
CFDs are complex instruments and come with a high risk of losing money rapidly due to leverage. 65% of retail investor accounts lose money when trading CFDs with this provider. You should consider whether you understand how CFDs work and whether you can afford to take the high risk of losing your money.
Stratos Europe Ltd (tradu.com ):
CFDs are complex instruments and come with a high risk of losing money rapidly due to leverage. 66% of retail investor accounts lose money when trading CFDs with this provider. You should consider whether you understand how CFDs work and whether you can afford to take the high risk of losing your money.
Stratos Global LLC (tradu.com ):
Losses can exceed deposits.
Please be advised that the information presented on TradingView is provided to Tradu (‘Company’, ‘we’) by a third-party provider (‘TFA Global Pte Ltd’). Please be reminded that you are solely responsible for the trading decisions on your account. There is a very high degree of risk involved in trading. Any information and/or content is intended entirely for research, educational and informational purposes only and does not constitute investment or consultation advice or investment strategy. The information is not tailored to the investment needs of any specific person and therefore does not involve a consideration of any of the investment objectives, financial situation or needs of any viewer that may receive it. Kindly also note that past performance is not a reliable indicator of future results. Actual results may differ materially from those anticipated in forward-looking or past performance statements. We assume no liability as to the accuracy or completeness of any of the information and/or content provided herein and the Company cannot be held responsible for any omission, mistake nor for any loss or damage including without limitation to any loss of profit which may arise from reliance on any information supplied by TFA Global Pte Ltd.
The speaker(s) is neither an employee, agent nor representative of Tradu and is therefore acting independently. The opinions given are their own, constitute general market commentary, and do not constitute the opinion or advice of Tradu or any form of personal or investment advice. Tradu neither endorses nor guarantees offerings of third-party speakers, nor is Tradu responsible for the content, veracity or opinions of third-party speakers, presenters or participants.

Kiwi Dollar Seems to be resuming its new bearish trendNZDUSD is on the verge of continuing its downward motion. Traders can take part of this descension as shown on the charts.

Bearish reversal for the Kiwi?The price has rejected off the pivot and could drop to the 1st support which acts as a pullback support.
Pivot: 0.5888
1st Support: 0.5839
1st Resistance: 0.5911
Risk Warning:
Trading Forex and CFDs carries a high level of risk to your capital and you should only trade with money you can afford to lose. Trading Forex and CFDs may not be suitable for all investors, so please ensure that you fully understand the risks involved and seek independent advice if necessary.
Disclaimer:
The above opinions given constitute general market commentary, and do not constitute the opinion or advice of IC Markets or any form of personal or investment advice.
Any opinions, news, research, analyses, prices, other information, or links to third-party sites contained on this website are provided on an "as-is" basis, are intended only to be informative, is not an advice nor a recommendation, nor research, or a record of our trading prices, or an offer of, or solicitation for a transaction in any financial instrument and thus should not be treated as such. The information provided does not involve any specific investment objectives, financial situation and needs of any specific person who may receive it. Please be aware, that past performance is not a reliable indicator of future performance and/or results. Past Performance or Forward-looking scenarios based upon the reasonable beliefs of the third-party provider are not a guarantee of future performance. Actual results may differ materially from those anticipated in forward-looking or past performance statements. IC Markets makes no representation or warranty and assumes no liability as to the accuracy or completeness of the information provided, nor any loss arising from any investment based on a recommendation, forecast or any information supplied by any third-party.

NZDUSD in bearish parallel channelby zooming out the picture becomes clear in which the current upward movement is actually a retracement in a bearish trend as soon as price hit the drawn sell area look for bearish confluences like bearish div on shorter TFs etc.

NZD/USD Watchlist – Pullback Setup DevelopingReport from the War Room:
NZD/USD is showing early signs of a pullback setup forming. Price is inching toward a key support/resistance zone—a natural battlefield where previous fighters have clashed.
Conditions We’re Watching:
Approach to the battlefield (SR zone) — we won't engage until control appears.
Volume strength at the zone — not just size, but conviction. Are the troops showing up?
Momentum alignment — the artillery needs to back the move.
Engulfing candle confirmation before entry — the commander's nod to launch the attack.
When these signals align, that’s our go-to moment. Until then, the War Room holds. No setup. No trade. Zero hesitation.
War Room Doctrine:
No structure = no battle.
Aligned execution is victory.
Take your watchlist, watch how the setup forms, and prepare. The strike happens when the troops align.
⚠️ Educational purposes only. This is not financial advice. Manage your own risk.


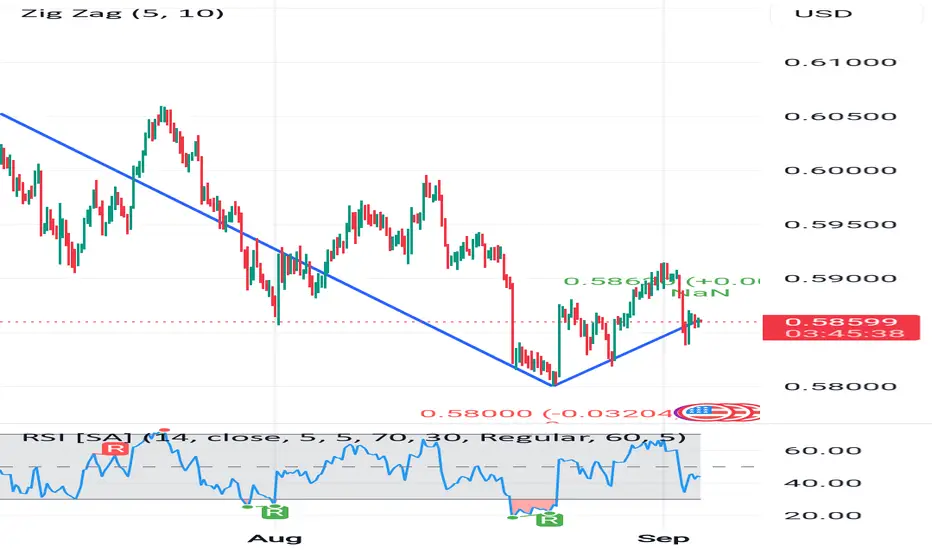
NZD/USD 4H Chart Analysis – Key Levels and RSI InsightsThe NZD/USD pair is currently trading around 0.5861 after recently bouncing from the 0.5800 support zone. On the 4H chart, price action shows a strong rejection at the recent low, followed by a short-term bullish correction.
🔑 Key Technical Levels
Support Zone: 0.5800 – Strong buying pressure observed here.
Resistance Zone: 0.5900 – Price failed to break this level in the last attempt.
Current Price: 0.5861
📉 Trend Analysis
The ZigZag indicator highlights a dominant downtrend from above 0.6000, followed by a corrective move. The price is now consolidating between 0.5800 and 0.5900, suggesting indecision in the market.
📊 RSI Indicator (14)
The RSI is hovering around the 40–50 range, showing neutral momentum. Previously, RSI touched oversold levels near 30, sparking the recent bounce. As of now, there’s no clear overbought or oversold signal, meaning traders should watch closely for confirmation.
📌 Trading Plan
Bullish Scenario: A breakout above 0.5900 could open the path toward 0.5950 – 0.6000.
Bearish Scenario: If price breaks below 0.5800, the next target could be 0.5750.
✅ Conclusion
NZD/USD is in a consolidation phase after a strong downtrend. Traders should keep an eye on the 0.5800 support and 0.5900 resistance levels for the next directional move. RSI suggests neutrality, so waiting for a breakout or confirmation is wise before entering new trades.

NZDUSD: Bullish Continuation is Expected! Here is Why:
The charts are full of distraction, disturbance and are a graveyard of fear and greed which shall not cloud our judgement on the current state of affairs in the NZDUSD pair price action which suggests a high likelihood of a coming move up.
Disclosure: I am part of Trade Nation's Influencer program and receive a monthly fee for using their TradingView charts in my analysis.
❤️ Please, support our work with like & comment! ❤️

NZDUSDBounce from a weekly support. Daily broke resistance trendline. H4 broke resistance zone around 0.59400 and now making a retest. Will target 0.61000 as 1st target and overall at 0.63500.

NZDUSDPrice action trading is a methodology where traders make decisions based on the interpretation of actual price movements on a chart, rather than relying primarily on lagging indicators. It involves observing and analyzing candlestick patterns, trend lines, support and resistance levels, and volume to identify potential trading opportunities and manage risk. The focus is on understanding the story the market is telling through its price behavior.

NZDUSD Consolidation above the Key resistance NZD/USD The pair is consolidating just below a key resistance zone, but the bullish market structure remains intact The USD is undergoing a short-term counter-trend correction, providing temporary pressure on NZD/USD. Market sentiment for risk currencies (like NZD) remains relatively positive, especially on expectations of policy easing (interest rate cuts) that could support growth and risk assets.
If NZD/USD holds above support during this consolidation phase and breaks through its upper resistance, it could trigger a move toward 0.6050. Until then, the market may remain choppy due to the USD’s corrective strength.
You may find more details in the chart.
Trade wisely best of Luck Buddies.
Ps; Support with like and comments for better analysis.

NZD/USD TRADE SETUP CHECK NOW📉 NZD/USD TRADE SETUP – CHECK NOW
🔑 Potential Entry Zone: 0.59682 – 0.59744
❌ Stop Loss (Invalidation Level): 0.598824
🎯 Target Levels:
✔️ TP1 – 0.59551
✔️ TP2 – 0.59456
✔️ TP3 – 0.59299
💡 This is my personal market outlook based on chart structure & price action. Always apply proper risk management.
⚠️ Disclaimer: This is not financial advice. Content is shared for educational and informational purposes only.

The Deviation Extreme: NZDUSD's Overextension Signals## Technical Confluence Matrix
**Bearish Alignment:**
• **Market Structure**: Sellers proved dominance at Point 3
• **Statistical Extreme**: Outside LRC 2nd deviation
• **Mathematical Resistance**: 2-sigma band rejection at Point 4
• **Price Memory**: Return to proven seller territory
• **Momentum Divergence**: Bearish divergence on both RSI and MFI - price makes higher high while indicators make lower highs
• **Oscillator Extremes**: RSI and MFI both in overbought territory, confirming overextension
• **Bollinger Band Pierce**: Price has poked above the upper Bollinger Band - a classic reversal signal when combined with divergences
• **Momentum Divergence**: Bearish divergence on both RSI and MFI - price makes higher high while indicators make lower highs
• **Oscillator Extremes**: RSI and MFI both in overbought territory (not oversold), confirming overextension
• **Bollinger Band Pierce**: Price# The Deviation Extreme: NZDUSD's Overextension Signals Reversal
## Seller Dominance Established (Points 1→3)
The journey from **Point 1 to Point 3** tells a clear story of power transfer. When sellers from Point 2 successfully pushed price below the buyers' stronghold at Point 1, they didn't just win a battle - they **established objective dominance**. Point 3's new low proves these sellers possess superior firepower in this local market structure.
**Point 4** marks the critical retest - price has returned to these proven sellers' territory, setting up what could be a decisive rejection.
## The Linear Regression Channel Anomaly
Price has done something statistically rare: **closed outside the 2nd standard deviation of the Linear Regression Channel (LRC)**. This isn't just overbought - it's a mathematical extreme that historically precedes violent reversals.
**Key observations:**
• Price breached the 2-sigma boundary = 95% statistical extreme
• We're waiting for the catalyst: a pause or bearish candle to confirm exhaustion
• When price ventures this far from mean, the snap-back is often intense
## Standard Deviation Validation
The **2nd standard deviation band** isn't arbitrary - it's catching multiple critical market turns:
• **Point 3 low** - perfectly contained
• **Point 4 high** - precise rejection point
• Multiple other turning points align with these bands
This repeated respect for the 2-sigma levels increases reliability exponentially. When multiple independent pivot points honor the same mathematical boundary, it becomes a **high-probability reversal zone**.
## The Overextension Thesis
Markets operate on a principle of mean reversion - what goes up must come down, especially when stretched to extremes. Currently, NZDUSD exhibits classic overextension symptoms:
• **Statistical stretch**: Outside 2nd deviation channel
• **Structural resistance**: At proven sellers' zone (Point 4)
• **Mathematical ceiling**: 2-sigma band capping upside
• **Momentum warning**: Need bearish confirmation candle
## Technical Confluence Matrix
**Bearish Alignment:**
• **Market Structure**: Sellers proved dominance at Point 3
• **Statistical Extreme**: Outside LRC 2nd deviation
• **Mathematical Resistance**: 2-sigma band rejection at Point 4
• **Price Memory**: Return to proven seller territory
## Risk Parameters
This setup offers clear, mathematically-defined risk levels:
**Entry Trigger**: Bearish candle or pause at current levels (0.59683)
**Stop Loss**: Above Point 2 at 0.60530 (0.89% risk)
**Target**: 0.57678 (4.49% reward)
**Risk/Reward Ratio**: 1:5.05
**Invalidation**: Sustained close above Point 2 with momentum
The 1:5 risk/reward ratio makes this an asymmetric opportunity where risking $1 targets $5 in potential profit.
## The Probability Edge
When price closes outside the 2nd standard deviation channel:
• **68% of price action** occurs within 1 standard deviation
• **95% of price action** occurs within 2 standard deviations
• Current position = **5% probability zone**
This mathematical edge, combined with proven seller resistance, creates an asymmetric short opportunity.
---
**Bottom Line:** The convergence of statistical overextension (outside 2-sigma LRC), structural resistance (proven sellers at Point 4), and mathematical boundaries (2nd standard deviation bands) creates a high-probability reversal setup. We're simply waiting for the bearish catalyst to confirm exhaustion at these extreme levels.

NZDUSD_LONG IDEANZDUSD is bullish on higher time frames now it has broken its trendline after the accumulation. Firstly the divergence formed is diluted by forming new higher high on the chart as well as in RSI which is a strong bullish signal. Put buy limit on the recent high which has been broken recently.
