NZDUSD Will Move Lower! Sell!
Here is our detailed technical review for NZDUSD.
Time Frame: 1h
Current Trend: Bearish
Sentiment: Overbought (based on 7-period RSI)
Forecast: Bearish
The market is approaching a significant resistance area 0.578.
Due to the fact that we see a positive bearish reaction from the underlined area, I strongly believe that sellers will manage to push the price all the way down to 0.577 level.
P.S
The term oversold refers to a condition where an asset has traded lower in price and has the potential for a price bounce.
Overbought refers to market scenarios where the instrument is traded considerably higher than its fair value. Overvaluation is caused by market sentiments when there is positive news.
Like and subscribe and comment my ideas if you enjoy them!
New Zealand Dollar / U.S. Dollar
No trades
Market insights

NZDUSD to find buyers at market price?NZDUSD - 24h expiry
There is no clear indication that the upward move is coming to an end.
Although we remain bullish overall, a correction is possible with plenty of room to move lower without impacting the trend higher.
Risk/Reward would be poor to call a buy from current levels.
A move through 0.5800 will confirm the bullish momentum.
The measured move target is 0.5875.
We look to Buy at 0.5775 (stop at 0.5740)
Our profit targets will be 0.5850 and 0.5875
Resistance: 0.5800 / 0.5825 / 0.5850
Support: 0.5775 / 0.5750 / 0.5725
Risk Disclaimer
The trade ideas beyond this page are for informational purposes only and do not constitute investment advice or a solicitation to trade. This information is provided by Signal Centre, a third-party unaffiliated with OANDA, and is intended for general circulation only. OANDA does not guarantee the accuracy of this information and assumes no responsibilities for the information provided by the third party. The information does not take into account the specific investment objectives, financial situation, or particular needs of any particular person. You should take into account your specific investment objectives, financial situation, and particular needs before making a commitment to trade, including seeking, under a separate engagement, as you deem fit.
You accept that you assume all risks in independently viewing the contents and selecting a chosen strategy.
Where the research is distributed in Singapore to a person who is not an Accredited Investor, Expert Investor or an Institutional Investor, Oanda Asia Pacific Pte Ltd (“OAP“) accepts legal responsibility for the contents of the report to such persons only to the extent required by law. Singapore customers should contact OAP at 6579 8289 for matters arising from, or in connection with, the information/research distributed.


Sell trade on NZDUSDAs we can see that NZDUSD is close to resistance it will fall if it doesnt break it.
If it falls it can fall till 5700

Hard rally after sharp retrace.Bull market to be underway in near term, but thinking it will retrace sharply from 57.9 down to 56.1ish. Retrace possibly due to a sell in the Chinese markets.

Heading into multi swing high resistance?Kiwi (NZD/USD) is rising towards the pivto which acts as a multi swing high resistance and couldreverse to the 1st support whichis a pullback support.
Pivot: 0.5802
1st Support: 5730
1st Resistance: 0.5841
Disclaimer:
The opinions given above constitute general market commentary and do not constitute the opinion or advice of IC Markets or any form of personal or investment advice.
Any opinions, news, research, analyses, prices, other information, or links to third-party sites contained on this website are provided on an "as-is" basis, are intended to be informative only, and are not advice, a recommendation, research, a record of our trading prices, an offer of, or solicitation for, a transaction in any financial instrument and thus should not be treated as such. The information provided does not involve any specific investment objectives, financial situation, or needs of any specific person who may receive it. Please be aware that past performance is not a reliable indicator of future performance and/or results. Past performance or forward-looking scenarios based upon the reasonable beliefs of the third-party provider are not a guarantee of future performance. Actual results may differ materially from those anticipated in forward-looking or past performance statements. IC Markets makes no representation or warranty and assumes no liability as to the accuracy or completeness of the information provided, nor any loss arising from any investment based on a recommendation, forecast, or any information supplied by any third party

Sell Zone Ahead for NZDUSDAfter reaching a low just under the 0.56 figure — just above the 2025 lows — OANDA:NZDUSD finally found support and began reversing to the upside. The pair then broke above the falling-wedge resistance, confirming short-term bullish momentum.
At the time of writing the price is 0.5782, and is approaching the 0.5850 major resistance zone.
Given:
- the significance of this resistance level,
- the prevailing long-term bearish trend,
- and the broader fundamental landscape,
I believe 0.5850 offers an attractive sell zone for a longer-term swing trade.
A rejection from this area could send the pair back toward the lows.

NZD/USD Price Outlook – Trade Setup📊 Technical Structure
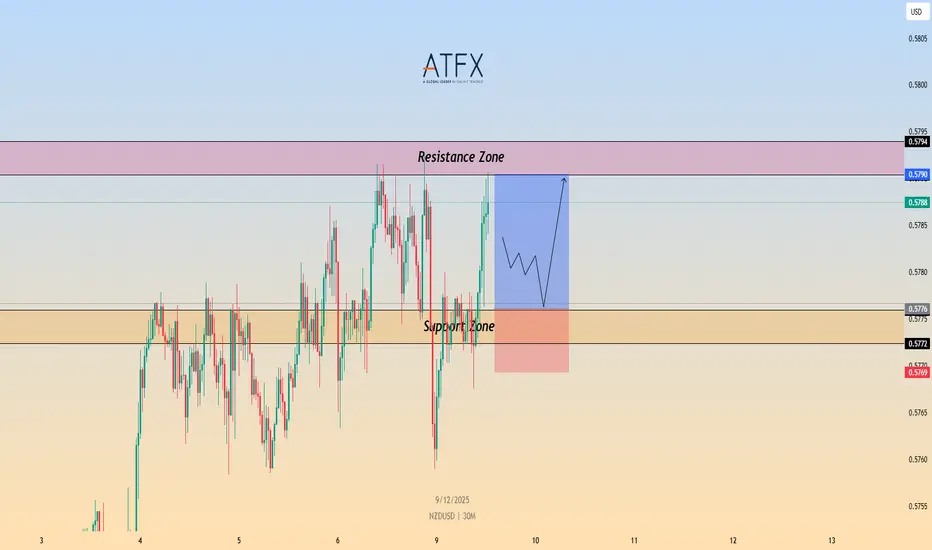
OANDA:NZDUSD NZD/USD is trading slightly softer around 0.5775, holding above the 0.5772–0.5776 support zone while repeatedly failing to sustain a break above the 0.5790–0.5794 resistance area. The pair remains range-bound ahead of major US employment data and the FOMC rate decision, with price action showing a tightening consolidation pattern.
As long as NZD/USD holds above the support band, dips may continue to attract buyers for another attempt toward the resistance zone. A clean break below 0.5769 would invalidate the bullish scenario and expose deeper downside. Conversely, a breakout above 0.5794 could trigger short-covering momentum toward higher levels.
🎯 Trade Setup
Idea: Buy dips near support and target a retest of the resistance zone.
Entry: 0.5772 – 0.5776
Stop Loss: 0.5769
Take Profit 1: 0.5790
Take Profit 2: 0.5794
Risk–Reward Ratio: ~1 : 2.12
Bullish bias remains valid as long as price holds above 0.5772–0.5776 A 30M/1H close below 0.5769 invalidates the setup.
🌐 Macro Background
Markets expect the Fed to cut rates by 25 bps on Wednesday, but traders fear a hawkish cut — meaning the Fed cuts once but signals fewer cuts ahead. This supports the USD in the short term, weighing on NZD/USD.
China, New Zealand’s largest trading partner, posted its largest trade surplus since June, reflecting stronger export performance. A strong China surplus is generally positive for the Kiwi, but this effect is being overshadowed by Fed-related USD strength.
Later today, traders will focus on the delayed US ADP four-week average and JOLTS job openings data. Stronger-than-expected numbers could further support the USD, while softer data may help NZD/USD stabilize near support.
🔑 Key Technical Levels
Resistance Zone: 0.5790 – 0.5794
Support Zone: 0.5776 – 0.5772
Invalidation Level: 0.5769 (30M/1H close below)
📌 Trade Summary
NZD/USD is consolidating below 0.5800 as markets await US employment data and the Fed decision. The technical structure supports buying dips into the support zone, targeting a move toward 0.5790–0.5794. A break below 0.5769 invalidates the bullish setup and suggests a shift in momentum.
⚠️ Disclaimer
This analysis is for reference only and does not constitute trading advice. Trading involves significant risk, and proper risk management is essential.
NZDUSD - Bearish BiasToday's bias on NZDUSD is Bearish based on my Daily Bias Model (Wick Rejection Scenario).
Here’s the breakdown:
The previous daily candle traded above the high of the candle before it.
But instead of closing outside the range, it closed back inside the previous day’s range.
And importantly, it did NOT take the previous day’s low.
This confirms a bearish wick-rejection profile, suggesting downside delivery is more likely today, at least hunting for the Previous 1D Low (DOL).
📌To sum it all up, Bias for today: 🔻 Bearish
Expecting a minor retracement into an Internal Range Liquidity (In this case the 1h FVG, or the 15m short term high as shown in the video), before hunting the main DOL (Previous daily low).
Wish you the best in your trading day :D
#NZDUSD #Forex #FX #SMC #ICT #PriceAction
#DailyBias #ForexAnalysis #SmartMoneyConcepts
#Bearish #MarketStructure #Forextoday
#USD #NZD #FXTrader #ForexTraders #TradingView

NZDUSD - great time to buy nowNZDUSD was in a recent downtrend for the last few weeks and was struggling to stay bullish, but recently it has just broken a strong resistance trend line which it tested several times and failed to break through. NZDUSD is very likely to hit the next major resistance zone which is market as the "TAKE PROFIT" LEVEL. There are many clear signs of new bullish movements. Time to buy NZDUSD..

NZDUSD, Bullish breakout retest of 0.5660The NZDUSD remains in a bullish trend, with recent price action showing signs of a breakout within the broader uptrend.
Support Zone: 0.5660 – a key level from previous consolidation. Price is currently testing or approaching this level.
A bullish rebound from 0.5660 would confirm ongoing upside momentum, with potential targets at:
0.5790 – initial resistance
0.5816 – psychological and structural level
0.5840 – extended resistance on the longer-term chart
Bearish Scenario:
A confirmed break and daily close below 0.5660 would weaken the bullish outlook and suggest deeper downside risk toward:
0.5640 – minor support
0.5610 – stronger support and potential demand zone
Outlook:
Bullish bias remains intact while the NZDUSD holds above 0.5660 A sustained break below this level could shift momentum to the downside in the short term.
This communication is for informational purposes only and should not be viewed as any form of recommendation as to a particular course of action or as investment advice. It is not intended as an offer or solicitation for the purchase or sale of any financial instrument or as an official confirmation of any transaction. Opinions, estimates and assumptions expressed herein are made as of the date of this communication and are subject to change without notice. This communication has been prepared based upon information, including market prices, data and other information, believed to be reliable; however, Trade Nation does not warrant its completeness or accuracy. All market prices and market data contained in or attached to this communication are indicative and subject to change without notice.

NZDUZD - Sell Bias Price has rallied directly into a well-defined daily supply / resistance zone around 0.5780 – 0.5810, which also aligns with the prior trendline resistance from the larger bearish structure.
Let's see how it goes.

Stop Buying Breakouts. Start Buying What Smart Money Buys....📈 NZD/USD — 1H TECHNICAL OUTLOOK
Price action on NZD/USD is developing exactly as a clean bullish structure: higher highs, higher lows, and a controlled ascending channel. The market is respecting both the trendline and the support zone, giving us a high-probability continuation setup.
1️⃣ Market Structure Remains Bullish
NZD/USD continues to build a clear ascending structure, with every corrective swing respecting the red resistance trendline. After multiple taps (circled areas), the market has finally broken above the structure, signaling bullish strength.
- Support is holding firml
- Each dip is bought aggressively
- Lower volatility pullbacks show accumulation, not distribution
This is exactly what you want in a trend continuation trade.
2️⃣ Entry Zone
Entry Zone aligns perfectly at the trendline retest, combining:
- Break of structure
- Pullback into former resistance (now support)
- Confluence with minor rising trendline
This is a textbook “break–retest–continuation” pattern.
Aggressive traders enter immediately at retest.
Conservative traders wait for a confirmation candle above the trendline.
Both approaches are valid with strong R:R.
3️⃣ Stop-Loss Zone (Smart Money Placement)
The SL Zone sits below:
- Trendline support
- Last higher low
- Retest rejection zone
If price breaks below this level, the bullish structure is invalid so the SL placement is perfect.
4️⃣ Take-Profit Zone
TP Zone is strategically placed at the next liquidity cluster and previous rejection area.
If structure holds, price is likely to sweep these highs.
This gives the setup a clean 2–3R potential.
➡️ Primary Scenario
Price pulls back into the Entry Zone, forms a higher low, then continues pushing upward into the TP Zone.
This is the highest-probability path given current momentum.
⚠️ Alternative Scenario
A break below the SL Zone would signal weakness and may drive price back toward the broader SUPPORT block. Until then, buyers remain in control.

AI Revolution: How the Retail Trader Can Finally WinA step-by-step guide for traders who want to stop staring at charts and start letting AI do the heavy lifting.
For years, trading meant one thing:
Sit at your desk.
Stare at charts.
Wait.
Hope.
React.
Repeat.
But in 2025, that’s ancient history.
AI has changed everything.
Now any retail trader — even a complete beginner — can create a TradingView strategy, test it, refine it, and fully automate execution to MT5 or cTrader using webhooks… without writing a single line of code.
If you can type instructions, you can build an automated trading system.
Here’s the full blueprint — updated with the crucial Step 0 that most people don’t even know exists.
⭐ STEP 0 — Build Your Master AI Prompt (The Secret Weapon)
Before you write a single strategy rule…
Before you ask AI to code…
Before you try to automate anything…
You MUST build a Master Prompt.
This is the “operating system” for the AI — it tells the model:
how to write the Pine Script
how to structure entries & exits
how to format alerts
how to avoid compile errors
how to respond when you paste broken code
how to preserve your logic perfectly
Without a Master Prompt, AI guesses.
With a Master Prompt, AI produces clean, professional, error-free trading systems consistently.
Here’s the master prompt you’ll use:
🔥 MASTER PROMPT (Copy + Paste Into ChatGPT Before Giving Your Strategy Rules)
You are now my expert TradingView Pine Script v5 strategist, quant developer, and compiler-level debugging assistant.
Your job is to:
1. Build a complete TradingView strategy() script based on the rules I give you.
2. Ensure the script compiles with ZERO errors.
3. Write clean, structured, commented code using professional conventions.
4. Include:
– strategy.entry()
– strategy.exit() with SL & TP
– Input parameters
– alertcondition() for webhook automation
5. Structure alerts so they work with strategy.order.action.
6. NEVER change my trading logic. Follow it EXACTLY.
7. If the code fails to compile:
– Identify the REAL root cause
– Fix only what’s necessary
– Return a fully corrected script
8. When I ask for improvements, optimize the code without altering the core idea.
After loading this master prompt, wait for my rules before generating the strategy.
Now your AI assistant is fully “trained” before it begins coding.
Once Step 0 is done?
The real fun begins.
🚀 STEP 1 — Decide What You Want Your Strategy To Do
Define the basics:
What triggers your entry?
What ends the trade?
What confirms the setup?
How much risk?
Example simple idea:
Buy when price closes above the 20 EMA after RSI oversold.
Sell when price closes below the 20 EMA after RSI overbought.
Stop = 1 ATR.
Take profit = 2 ATR.
Once you define this?
You're ready for the AI to code it.
🤖 STEP 2 — Use AI to Turn Your Idea Into a TradingView Strategy
Paste your Master Prompt.
Then paste your rules.
Example instruction:
“Build the strategy using my Master Prompt.
Here are the rules…”
AI outputs a ready-to-paste Pine Script.
If it errors?
You tell it:
“Fix all compile errors without changing my trading logic.”
This is the magic of Step 0 — the AI already understands exactly how to fix your code properly.
📊 STEP 3 — Backtest Directly on TradingView
Paste the script.
Add to chart.
Open Strategy Tester.
Check:
Win rate
Drawdown
Profit factor
Stability
Number of trades
If it sucks?
Ask AI:
“Improve this strategy’s performance. Keep the overall concept but add filters.”
AI gives you Version 2.
⚙️ STEP 4 — Turn Your Strategy Into Webhook Alerts
Click Alerts → Condition → Your Strategy Name
Choose:
Strategy Entry Long
Strategy Exit Long
Strategy Entry Short
Strategy Exit Short
Turn on Webhook URL.
Use structured JSON:
{
"signal": "{{strategy.order.action}}",
"symbol": "{{ticker}}",
"price": "{{close}}",
"position_size": "0.10"
}
Now TradingView is alert-ready.
🌐 STEP 5 — Send Alerts to MT5 or cTrader Using Webhooks
You need a bridge.
Best options:
PineConnector
TradeConnector
cTrader Open API bot
Make/Zapier → Python Server → MT5 EA
Example webhook:
{
"action": "BUY",
"symbol": "XAUUSD",
"lot": 0.10,
"sl": 50,
"tp": 100
}
🧠 STEP 6 — Use AI to Build the MT5 or cTrader Execution Robot
If you want a custom bot instead of PineConnector:
Ask:
“Write an MT5 EA that receives webhook commands in JSON format and executes market orders with SL and TP.”
Or:
“Write a cTrader cBot that listens for webhook signals and places trades automatically.”
AI builds your execution engine.
🔁 STEP 7 — Your Fully Automated Trading Pipeline
STEP 0 — Build your Master AI Prompt
STEP 1 — Define your strategy
STEP 2 — AI generates TradingView strategy
STEP 3 — Backtest & refine
STEP 4 — Create alert webhooks
STEP 5 — Bridge → MT5/cTrader
STEP 6 — AI builds execution bot
STEP 7 — Enjoy hands-free AI-powered trading
🎯 Final Thoughts — This Is the New Era
The trader who wins is the one who:
uses AI
automates everything
removes emotion
builds systems, not guesses
executes consistently
Tools like TradingView + AI + MT5/cTrader automation are the biggest level-up in retail history.
And it all starts with:
STEP 0 — Build your Master Prompt.
Let the fun begin

Forex: Weekly Review Overall sentiment has been positive ever since the market jumped on 'relatively dovish' comments from FED member WILLIAMS. And the positivity remained throughout the week starting Monday 1 December, backed up by another string of 'softish' US data and the (likely) incoming appointment of HASSETT to replace FED chair POWELL. (The theory being Hassett will push a dovish agenda).
The potential spanners in the works could be the upcoming FOMC meeting, is the market over exuberant expecting a rate cut? Will chair POWELL have one more hawkish twist in him?. And although subsided for now, AI bubble concerns still simmer in the background.
For now, I'll begin the new week looking for 'risk on' trades, the risk to any trade could be 'lackluster movement' ahead of Wednesday's decision.
The week didn't pass without the odd hiccup, namely negative UKRAINE war comments keeping geopolitical concerns on the markets mind. And 'hawkish' BOJ comments combined with president TAKACHI walking back some stimulus comments (in an attempt the calm the Japanese bond market) gave the JPY bouts of strength. I reiterate that the sooner the BOJ hike and declare the end of the hiking cycle, the better, we will likely get bouts of choppy JPY movement until then.
Following on from the previous week's positive CAD data, Friday's 'hot' Canadian jobs data keeps sentiment for the CAD bouyed, as ever, the risk to any CAD long trades would be its penchant for tracking the USD and oil.
On a personal note, it was a week of two trades, CAD JPY long which stopped out very quickly, aside from 'only' using a 15min stop loss, I could only surmise sentiment took a brief hit from Putin's negative comments. Wednesday's NZD USD long took an age and was eventually closed for a small profit, the fact I was still in the trade during Fridays 'hot' CAD data meant I had to sit that one out. Missing out on a trade due to already being in one does occasionally happen and is just something we have to accept.
I being the new week with a tentative 'risk on bias'. But with four central bank decisions, it could be a week of twists and turns ahead.

Could we see a reversal from here?NZD/USD is reacting off the resistance level, which is a pullback resistance and could reverse from this level to our take profit.
Entry: 0.5782
Why we like it:
There is a pullback resistance level.
Stop loss: 0.5804
Why we like it:
There is a swing high resistance level
Take profit: 0.5728
Why we like it:
There is a pullback support level that is slightly below the 23.2% Fibonacci retracement.
Please be advised that the information presented on TradingView is provided to Vantage (‘Vantage Global Limited’, ‘we’) by a third-party provider (‘Everest Fortune Group’). Please be reminded that you are solely responsible for the trading decisions on your account. There is a very high degree of risk involved in trading. Any information and/or content is intended entirely for research, educational and informational purposes only and does not constitute investment or consultation advice or investment strategy. The information is not tailored to the investment needs of any specific person and therefore does not involve a consideration of any of the investment objectives, financial situation or needs of any viewer that may receive it. Kindly also note that past performance is not a reliable indicator of future results. Actual results may differ materially from those anticipated in forward-looking or past performance statements. We assume no liability as to the accuracy or completeness of any of the information and/or content provided herein and the Company cannot be held responsible for any omission, mistake nor for any loss or damage including without limitation to any loss of profit which may arise from reliance on any information supplied by Everest Fortune Group.

NZD-USD Will Fall! Sell!
Hello,Traders!
NZDUSD is reacting from a horizontal supply area after sweeping buy-side liquidity sitting above previous swing highs, forming an SMC distribution setup that favors a corrective move toward the next inefficiency and demand pocket below. Time Frame 5H.
Sell!
Comment and subscribe to help us grow!
Check out other forecasts below too!
Disclosure: I am part of Trade Nation's Influencer program and receive a monthly fee for using their TradingView charts in my analysis.

NZD/USD Bearish Play — Trend Reversal + Structured Sell Zones🐻 BEARISH SWING TRADE SETUP | NZD/USD "The Kiwi"
Hey Traders! 👋 Here's a detailed swing trade analysis for the NZD/USD pair, focusing on a high-probability bearish continuation play. We're using a strategic layered entry method to optimize our risk.
📈 Trade Thesis & Market Context
A bearish structure is confirmed, and price is currently exhibiting a classic pullback towards a key dynamic resistance (Moving Average). This setup aims to capture the next leg down in line with the prevailing downtrend.
⚡ The "Thief" Layered Entry Strategy
This plan uses multiple limit orders to "scale in" to the position, averaging your entry price as the pullback unfolds.
🎯 Entry Zone (Sell Limit Orders):
Layer 1: 0.56500
Layer 2: 0.56400
Layer 3: 0.56300
💡 Pro Tip: You can increase or decrease the number of layers and adjust prices based on your own capital and risk management.
🚨 Risk Management (Your Responsibility!)
Stop Loss (SL): A suggested stop loss is above the recent structure at 0.56700.
⚠️ IMPORTANT NOTE: I am NOT recommending you use only my SL. You MUST adjust your stop loss based on your personal risk tolerance, account size, and strategy. The market is unpredictable; protect your capital first!
🎯 Profit Targets (Take Profit - TP)
Primary Target (TP): 0.55900
Rationale: This target aligns with a strong support zone, oversold conditions, and a potential liquidity pool ("trap"). The goal is to "escape" with profits before any significant bounce.
⚠️ REMINDER: Just like the SL, this is a suggested target. You are free to take profits earlier or adjust based on how price action develops. Manage your own trade!
🔍 Key Correlations & Pairs to Watch
Understanding the Kiwi's relationships is crucial for this trade's context.
AUD/USD ( OANDA:AUDUSD ): 🦘 The "Aussie" and "Kiwi" are highly correlated commodity brothers. A strong downtrend in AUD/USD often reinforces bearish momentum in NZD/USD.
USD/CNH ( FX:USDCNH ): 🇨🇳 China's economy is a major driver for New Zealand's exports (especially dairy). A stronger USD/CNH (weaker Yuan) can signal risk-off sentiment and pressure the NZD.
TVC:DXY (US Dollar Index): 🇺🇸 A strong overall US Dollar, as shown by a rising DXY, provides a strong tailwind for this bearish NZD/USD setup.

NZDUSD CORRECTION EXPECTED|SHORT|
✅NZDUSD price is reacting from a premium supply zone after engineering buy-side liquidity into the upper range, creating an ICT rejection that shifts short-term order-flow toward the demand block below where discount pricing awaits. Time Frame 6H.
SHORT🔥
✅Like and subscribe to never miss a new idea!✅

NZDUSD Is Bearish! Short!
Take a look at our analysis for NZDUSD.
Time Frame: 7h
Current Trend: Bearish
Sentiment: Overbought (based on 7-period RSI)
Forecast: Bearish
The market is testing a major horizontal structure 0.577.
Taking into consideration the structure & trend analysis, I believe that the market will reach 0.569 level soon.
P.S
Overbought describes a period of time where there has been a significant and consistent upward move in price over a period of time without much pullback.
Like and subscribe and comment my ideas if you enjoy them!

NZDUSD: Expecting Retracement after impulsive leg upPrice is currently in a short-term bullish structure after a strong impulsive leg.
And price has now reached a clear resistance zone. After such an expansion, the market often requires a "breather" to rebalance.
As price reached this zone, momentum has visibly decelerated. This behavior cleanly suggests that sellers are starting to step in. What is typical when price revisits a well-defined area like this one, that it often leads to either a deep pullback or a trend reversal.
My target would be around the 0.5747 level, a healthy, achievable pullback and technically well aligned with normal market behavior.
So for me, the market is in a decision area. If price fails to break, the probability favors a corrective drop. That move would be considered a healthy pullback within a bullish trend rather than an immediate trend reversal.
Another possible scenario is that price breaks through the zone with strong momentum and then successfully retests it as support, after which bullish continuation is likely to follow.
This is not the spot to chase long positions, and it is also not the place to short blindly without clear confirmation.

Trade closed manually It was a slow burner and almost hit the profit target but I've eventually closed my NZD USD trade for a small +0.7 profit (to avoid weekend risk).
All in all, the positive narrative remains, meaning until something changes, I'll continue looking for 'risk on trades' short USD, JPY (BOJ rate hike chatter being a risk) and also, short CHF appears viable again. (It's now all eyes on next week's fed meeting).
Side note that positive data boosted the CAD today and would have made a nice trade for anyone at the charts at the time and not already in a trade.
Wishing you a lovely weekend

NZDUSD H1 | Bullish Bounce Off Key SupportMomentum: Bullish
Price is currently above the ichimoku cloud.
Buy entry: 0.5754
- Strong pullback support
- 38.2% Fib retracement
- 61.8% Fib projection
Stop Loss: 0.57339
- Swing low support
Take Profit: 0.57767
- Multi-swing high resistance
High Risk Investment Warning
Stratos Markets Limited (tradu.com/uk ), Stratos Europe Ltd (tradu.com/eu ):
CFDs are complex instruments and come with a high risk of losing money rapidly due to leverage. 70% of retail investor accounts lose money when trading CFDs with this provider. You should consider whether you understand how CFDs work and whether you can afford to take the high risk of losing your money.
Stratos Global LLC (tradu.com/en ): Losses can exceed deposits.
Please be advised that the information presented on TradingView is provided to Tradu (‘Company’, ‘we’) by a third-party provider (‘TFA Global Pte Ltd’). Please be reminded that you are solely responsible for the trading decisions on your account. Any information and/or content is intended entirely for research, educational and informational purposes only and does not constitute investment or consultation advice or investment strategy. The information is not tailored to the investment needs of any specific person and therefore does not involve a consideration of any of the investment objectives, financial situation or needs of any viewer that may receive it. Past performance is not a reliable indicator of future results. Actual results may differ materially from those anticipated in forward-looking or past performance statements. We assume no liability as to the accuracy or completeness of any of the information and/or content provided herein and the Company cannot be held responsible for any omission, mistake nor for any loss or damage including without limitation to any loss of profit which may arise from reliance on any information supplied by TFA Global Pte Ltd.
