GER40: Breaks Out of Corrective ChannelGER40: Breaks Out of Corrective Channel
GER40 has successfully broken out of the corrective descending channel, signaling a potential continuation of the broader bullish trend.
The current consolidation above support suggests a bullish continuation scenario, with buyers defending the breakout area. As long as price holds above this zone, upside momentum remains intact.
Key upside targets are located around 24,410 and 24,640, which align with prior supply and resistance zones. A clean break and hold above the local consolidation range could open the way for a move toward these levels.
You may find more details in the chart!
Thank you and Good Luck!
PS: Please support with a like or comment if you find this analysis useful for your trading day
Market insights

Germany 40 Bullish Bias | Buy the Dip Strategy📌 GER40 / DAX40 — Germany 40 Bullish Swing Trade Playbook
🇩🇪 ASSET OVERVIEW
📊 GER40 / DAX40 (Germany 40 Index)
🕰️ Trade Type: Swing Trade
💼 Market: European Equity Index CFD
🔍 The DAX40 represents Germany’s top 40 blue-chip companies, making it highly sensitive to:
🇪🇺 Eurozone economic sentiment
🏭 Industrial & export demand
🇺🇸 US equity market direction
🧠 MARKET STRUCTURE ANALYSIS
🟢 Overall Bias: BULLISH
📈 Why Bullish?
✅ Higher highs & higher lows intact
✅ Price holding above key dynamic support
✅ Buyers stepping in on every dip
📌 This confirms trend continuation, not reversal.
📉 TECHNICAL CONFIRMATION
📐 Indicator Used: HULL Moving Average (HMA)
🔑 Why HULL MA matters?
⚡ Faster than EMA & SMA
📊 Reduces lag during strong trends
🔁 Excellent for pullback entries
🟢 Current Condition:
✔️ Price has pulled back into the HULL MA
✔️ No structure break
✔️ Indicates healthy correction, not weakness
🎯 ENTRY STRATEGY (DETAILED)
📌 Entry Method: Any Price Level (Layering Allowed)
🧩 Thief Strategy – Layered Buy Orders
This strategy spreads risk and improves average entry.
🟢 Buy Limit Layers
🟩 23900
🟩 24000
🟩 24100
🟩 24200
📌 Why Layering Works?
🧠 Reduces emotional entries
📉 Handles volatility smoothly
📊 Improves risk-to-reward ratio
⚠️ You may add or reduce layers depending on capital size and risk rules.
🛑 STOP LOSS LOGIC
🔴 Reference Stop Loss: 23700
🧠 Why this level?
📉 Below recent swing structure
❌ Break below = bullish structure invalid
🛡️ Protects capital if trend fails
⚠️ Important Reminder
❗ This SL is not mandatory
❗ Adjust SL based on:
Account size
Risk percentage
Personal strategy
🏁 TARGET & EXIT ZONE
🎯 Primary Target: 24700
🚨 Why Take Profits Here?
🚓 “Police Force Zone” → Strong historical resistance
📊 Overbought conditions expected
High probability of bull trap / profit booking
📌 Smart traders exit into strength, not greed.
🔗 RELATED MARKETS & CORRELATION ($ WATCHLIST)
🇺🇸 US30 / Dow Jones
🔗 Strong Positive Correlation
Both driven by industrial & manufacturing sectors
Dow strength = confidence for DAX upside
🇺🇸 NAS100
⚡ Risk-On Indicator
Tech rallies improve global risk sentiment
Supports European indices indirectly
🇫🇷 FRA40
🌍 Regional Confirmation
Confirms broader Eurozone equity strength
Weak FRA40 = caution for DAX longs
💶 EUR/USD
💱 Inverse Sensitivity
📈 Strong EUR → pressure on German exporters
📉 Weak EUR → boosts DAX upside
📌 Always monitor EUR moves before major DAX pushes.
⚠️ RISK DISCLOSURE
❗ This idea is educational, not financial advice
❗ SL & TP are reference levels only
❗ You control your own risk & execution
👍 ENGAGEMENT CALL
💙 Like if this helps
💬 Comment your bias
⭐ Save for later
🔔 Follow for structured index setups

DAX Just confirmed the start of a very strong Bear Cycle.DAX (DE40) has been practically trading sideways since June 2025, a fair range on short-term time-frames but a tight one on long-term ones such as the 1M (monthly) that we are looking at today.
We posted this chart 2 months ago warning of a potential multi-year Top for the market's 16-year Channel Up (this time we view it on 1M instead on 1W) and only last month, it hit its 1W MA50 (blue trend-line) for the first time since the April low.
We don't need to mention again the specifics of this pattern's cyclical behavior, such as why Phase 3 seems to have already topped due to hitting the 1.618 and 2.236 Fibonacci extensions on two different measurements. Those where analyzed extensively on the previous publication.
But what we do want to bring to you is that the 1M RSI has been trading downwards since hitting its 80.00 Resistance, a level that was last tested in 2007! This is a clear Bearish Divergence on a wide scale and couple with the fact that the 1M MACD just completed a Bearish Cross, all the basic conditions for a Cycle Top have been met. As you can see, since the 2008 U.S. Housing Crisis, every 1M MACD Bearish Cross was formed on a market Top and signaled an aggressive correction.
As a result, we expect 2026 to be a Bear Cycle, and Phase 4 historically has corrected to at least the 0.382 Fibonacci retracement level, while also hitting the 1W MA200 (orange trend-line). Our 18800 long-term Target fulfills both conditions. Notice also that the 1M RSI has a 14-year Support trend-line as well at 39.00. If this gets hit, it is historically the most optimal signal to buy for the long-term regardless of the price the market will be at the moment.
---
** Please LIKE 👍, FOLLOW ✅, SHARE 🙌 and COMMENT ✍ if you enjoy this idea! Also share your ideas and charts in the comments section below! This is best way to keep it relevant, support us, keep the content here free and allow the idea to reach as many people as possible. **
---
💸💸💸💸💸💸
👇 👇 👇 👇 👇 👇

GER40 Holds Key Fibonacci Support – Upside Continuation LikelyThe GER40 chart indicates that a larger A-B-C corrective structure has been completed at the recent low, marked as (C), after which the index began a fresh impulsive upward move. From that bottom, price has formed a clean five-wave advance, confirming the start of a new bullish cycle. The recent pullback appears to be a normal Wave 2 correction, which has respected the 0.5–0.618 Fibonacci support zone, a typical area where corrections end. This suggests the correction is likely complete and the market is preparing for Wave 3, which is usually the strongest and fastest upward wave. As long as price holds above the Wave 2 low, the bullish Elliott Wave structure remains valid. Overall, the setup favors continued upside toward higher highs in the coming sessions.
Stay tuned!
@Money_Dictators
Thank you :)

GER40 / LONG / 18.12.25GER40, LONG, 18.12.25
Entry reasons:
Testing of the order flow on the daily timeframe
Inversion of the 4-hour imbalance
4-hour liquidity sweep within the daily imbalance
30% retracement of the bearish impulse

DAX Rebound Signals Potential Upside After Key Support HoldGerman DAX was very non-directional, basically since June of 2025 and what I see is some very nasty moves on both sides of the market, but what got our attention recently is that the price has stopped at key support levels around 23k to 23300 area, from where we can see a very interesting and strong rebound. What is most important is that this rebound is coming after only three waves down from all-time highs, so it can be part of a WXY complex correction here in a fourth wave on a daily chart. Of course there can be some other labelings as well, but with any approach you will probably come out with the same idea that this whole price action in this five to six month range is corrective, and whenever we see a correction we know that sooner or later it should be fully retraced, meaning the price could already be headed back toward the highs from current levels.
Bounce looks impulsive, and it may have formed a bullish setup formation with waves 1 and 2, so we think that more gains are coming within wave 3, especially if breaks back above 24500 bullish confirmation level.

DAX potentially gearing up for a big breakout soonWith all major risk events now out of the way for the year, can we finally see the German DAX come out of its multi month consolidation in the days ahead? Recent price action has been bullish, albeit inside a wide consolidation range. But the downside has been limited and that gives the bulls the confidence needed to stick around and await a potential breakout in the coming weeks. The lengthy consolidation near record highs is usually a positive sign as it shown the buying pressure is building while the sellers haven't made any major ground. But rather than pre-empting it, let's wait for a clean breakout first, so this is one to watch for the holiday period and into early parts of 2026.
Germany's record fiscal spending is likely to give Europe's largest economy a major boost, which could then lead to further stock market gains. Well that is the hope anyway.
Key levels highlighted on the chart.
By Fawad Razaqzada, market analyst with FOREX.com

GER40 / LONG / 22.12.25GER40, LONG, 22.12.25
Entry reasons:
Sweep of 1H liquidity within the 4H imbalance
Inversion of the bearish 1H imbalance
V-shaped reversal (retracement/buyback over 30%)

GER30 FIRST LONG THEN SHORTHere is a good Cypher Pattern forming.
We are a bit late for BUY but still worth pulling the trigger.
At the cypher level we SELL for TP1 and TP2
Note: These are for my personal studies. Pls. be careful
I appreciate your comments
Thx

DAX corrective pullback support at 23870The DAX remains in a bullish trend, with recent price action showing signs of a breakout within the broader uptrend.
Support Zone: 23870 – a key level from previous consolidation. Price is currently testing or approaching this level.
A bullish rebound from 23870 would confirm ongoing upside momentum, with potential targets at:
24300 – initial resistance
24450 – psychological and structural level
24560 – extended resistance on the longer-term chart
Bearish Scenario:
A confirmed break and daily close below 23870 would weaken the bullish outlook and suggest deeper downside risk toward:
23712 – minor support
23600 – stronger support and potential demand zone
Outlook:
Bullish bias remains intact while the DAX holds above 23870. A sustained break below this level could shift momentum to the downside in the short term.
This communication is for informational purposes only and should not be viewed as any form of recommendation as to a particular course of action or as investment advice. It is not intended as an offer or solicitation for the purchase or sale of any financial instrument or as an official confirmation of any transaction. Opinions, estimates and assumptions expressed herein are made as of the date of this communication and are subject to change without notice. This communication has been prepared based upon information, including market prices, data and other information, believed to be reliable; however, Trade Nation does not warrant its completeness or accuracy. All market prices and market data contained in or attached to this communication are indicative and subject to change without notice.

DAX Short set-up in M15!Following a strong bullish move, the DAX shows short-term weakness on the M15 chart. Price is trading below a key intraday support zone, which may indicate a potential short scenario. A pullback toward the former support area around 24,240–24,250 can be observed as a possible reaction zone. If this area acts as resistance, a continuation toward the next support near 24,170 comes into focus.

GER30 | 15M Outlook | BullishWe are currently making higher highs and higher lows. Since we already got a liquidity sweep of the 15m swing high, I would like to see price pull back into the 15m demand, which would also take out internal liquidity, and fill a bullish fvg. From there, I would enter based on lower timeframe confirmation. I would not take this trade if price continues up from here closing above the current swing high.
Trade Safe -Remzy

$DAX Breaking HigherOn 3 Dec, I called for an easy 500 pts move in DAX to the trendline (), hit, price came down, re-tested my daily algo zone, and rebounded. Price has broken above the descending trendline, looking for a move higher to new ATH

GER30 H4 | Bullish Momentum To ExtendMomentum: Bullish
The price has bounced off the buy entry, which aligns with the 38.2% Fibonacci retracement.
Buy entry: 24,207.41
Pullback support
38.2% Fibonacci retracement
Stop loss: 24,088.31
Pullback support
61.8% Fibonacci retracement
Take profit: 24,476.05
Multi swing high resistance
Stratos Markets Limited (tradu.com ), Stratos Europe Ltd (tradu.com ):
CFDs are complex instruments and come with a high risk of losing money rapidly due to leverage. 70% of retail investor accounts lose money when trading CFDs with this provider. You should consider whether you understand how CFDs work and whether you can afford to take the high risk of losing your money.
Stratos Global LLC (tradu.com ): Losses can exceed deposits.
Please be advised that the information presented on TradingView is provided to Tradu (‘Company’, ‘we’) by a third-party provider (‘TFA Global Pte Ltd’). Please be reminded that you are solely responsible for the trading decisions on your account. Any information and/or content is intended entirely for research, educational and informational purposes only and does not constitute investment or consultation advice or investment strategy. The information is not tailored to the investment needs of any specific person and therefore does not involve a consideration of any of the investment objectives, financial situation or needs of any viewer that may receive it. Past performance is not a reliable indicator of future results. Actual results may differ materially from those anticipated in forward-looking or past performance statements. We assume no liability as to the accuracy or completeness of any of the information and/or content provided herein and the Company cannot be held responsible for any omission, mistake nor for any loss or damage including without limitation to any loss of profit which may arise from reliance on any information supplied by TFA Global Pte Ltd.

DAX Free Signal! Sell!
Hello,Traders!
DAX taps into a well-defined horizontal supply area after a strong bullish leg, showing clear sell-side imbalance and distribution behavior. The rejection suggests smart money offloading at premium, with downside liquidity resting below recent structure as the next draw on price.
--------------------
Stop Loss: 24,485
Entry: 24,334
Take Profit: 24,202
Time Frame: 4H
--------------------
Sell!
Comment and subscribe to help us grow!
Check out other forecasts below too!
Disclosure: I am part of Trade Nation's Influencer program and receive a monthly fee for using their TradingView charts in my analysis.

Potential bullish rise?DAX40 (DE40) has bounced off the pivot and could rise to the 1st resistance, which acts as a swing high resistance.
Pivot: 24,210.89
1st Support: 24,102.79
1st Resistance: 24,434.34
Disclaimer:
The opinions given above constitute general market commentary and do not constitute the opinion or advice of IC Markets or any form of personal or investment advice.
Any opinions, news, research, analyses, prices, other information, or links to third-party sites contained on this website are provided on an "as-is" basis, are intended to be informative only, and are not advice, a recommendation, research, a record of our trading prices, an offer of, or solicitation for, a transaction in any financial instrument and thus should not be treated as such. The information provided does not involve any specific investment objectives, financial situation, or needs of any specific person who may receive it. Please be aware that past performance is not a reliable indicator of future performance and/or results. Past performance or forward-looking scenarios based upon the reasonable beliefs of the third-party provider are not a guarantee of future performance. Actual results may differ materially from those anticipated in forward-looking or past performance statements. IC Markets makes no representation or warranty and assumes no liability as to the accuracy or completeness of the information provided, nor any loss arising from any investment based on a recommendation, forecast, or any information supplied by any third party

DAX Resistance overhead The DAX remains in a bullish trend, with recent price action showing signs of a breakout within the broader uptrend.
Support Zone: 23973 – a key level from previous consolidation. Price is currently testing or approaching this level.
A bullish rebound from 23973 would confirm ongoing upside momentum, with potential targets at:
24640 – initial resistance
24775 – psychological and structural level
24943 – extended resistance on the longer-term chart
Bearish Scenario:
A confirmed break and daily close below 23973 would weaken the bullish outlook and suggest deeper downside risk toward:
23860 – minor support
23760 – stronger support and potential demand zone
Outlook:
Bullish bias remains intact while the DAX holds above 23973. A sustained break below this level could shift momentum to the downside in the short term.
This communication is for informational purposes only and should not be viewed as any form of recommendation as to a particular course of action or as investment advice. It is not intended as an offer or solicitation for the purchase or sale of any financial instrument or as an official confirmation of any transaction. Opinions, estimates and assumptions expressed herein are made as of the date of this communication and are subject to change without notice. This communication has been prepared based upon information, including market prices, data and other information, believed to be reliable; however, Trade Nation does not warrant its completeness or accuracy. All market prices and market data contained in or attached to this communication are indicative and subject to change without notice.

Falling towards pullback support?DAX40 (DE40) is pulling back toward the pivot, which is acting as a key support. This level aligns with the 38.2% Fibonacci retracement, and price could potentially bounce toward the first resistance.
Pivot: 23,877.01
1st Support: 23,646.41
1st Resistance: 24,219.38
Disclaimer:
The opinions given above constitute general market commentary and do not constitute the opinion or advice of IC Markets or any form of personal or investment advice.
Any opinions, news, research, analyses, prices, other information, or links to third-party sites contained on this website are provided on an "as-is" basis, are intended to be informative only, and are not advice, a recommendation, research, a record of our trading prices, an offer of, or solicitation for, a transaction in any financial instrument and thus should not be treated as such. The information provided does not involve any specific investment objectives, financial situation, or needs of any specific person who may receive it. Please be aware that past performance is not a reliable indicator of future performance and/or results. Past performance or forward-looking scenarios based upon the reasonable beliefs of the third-party provider are not a guarantee of future performance. Actual results may differ materially from those anticipated in forward-looking or past performance statements. IC Markets makes no representation or warranty and assumes no liability as to the accuracy or completeness of the information provided, nor any loss arising from any investment based on a recommendation, forecast, or any information supplied by any third party

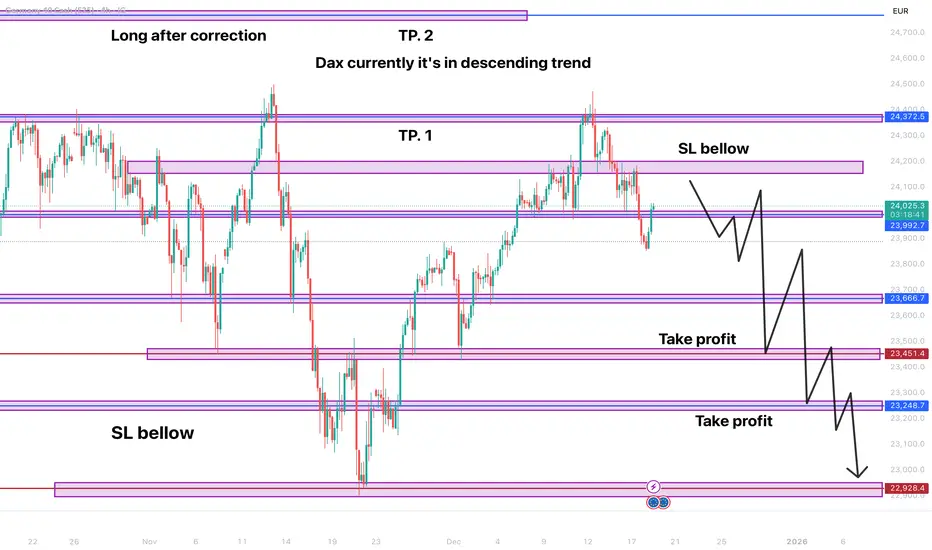
currently short on DAX-now It's a bearish sentiment in the market, and DAX started an bearish trend. In the chart are mentioned possible TP levels following previos data of the charter
Dax to the upside!Hi
on the 4h TF. Dax bounced strongly from the bottom to break a critical resistance level then went to the next resistance then broke through it to the upside and even bounced up from after it settled on with a pin bar 4H candle and that is the big view of the DAX based on the 4H TF.
3 TPs are there, however, if you accept and tolerate the bearish pullbacks on the journey to TP3, as long the last support level or (the above line) will not be broken by a 4H candle (closing price not by a wick) then TP3 will be your main and real target on DAX.
Fundamentally the next week will offer the Fed interest rate decision which has strong expectations of another rate cut! and may we see currently the preparation on the chart for that move!
Note:
Please do not share or copy my own work! It reflects my own vision and view to that index and it is advertised to not be taken as a legal advice for traders to follow, however, it is not more than an own opinion and analysis to be shared with you!
Good luck ;)

GER30 H4 | Bearish Drop Off Pullback ResistanceMomentum: Bullish
Price has reacted off the sell entry, which is now acting as pullback support.
Sell entry: 24,015.77
Pullback support
Stop loss: 24,479.29
Multi swing high resistance
Take profit: 23,595.36
Pullback support
Slightly above the 61.8% Fibonacci retracement
High Risk Investment Warning
Stratos Markets Limited (tradu.com ), Stratos Europe Ltd (tradu.com ):
CFDs are complex instruments and come with a high risk of losing money rapidly due to leverage. 70% of retail investor accounts lose money when trading CFDs with this provider. You should consider whether you understand how CFDs work and whether you can afford to take the high risk of losing your money.
Stratos Global LLC (tradu.com ): Losses can exceed deposits.
Please be advised that the information presented on TradingView is provided to Tradu (‘Company’, ‘we’) by a third-party provider (‘TFA Global Pte Ltd’). Please be reminded that you are solely responsible for the trading decisions on your account. Any information and/or content is intended entirely for research, educational and informational purposes only and does not constitute investment or consultation advice or investment strategy. The information is not tailored to the investment needs of any specific person and therefore does not involve a consideration of any of the investment objectives, financial situation or needs of any viewer that may receive it. Past performance is not a reliable indicator of future results. Actual results may differ materially from those anticipated in forward-looking or past performance statements. We assume no liability as to the accuracy or completeness of any of the information and/or content provided herein and the Company cannot be held responsible for any omission, mistake nor for any loss or damage including without limitation to any loss of profit which may arise from reliance on any information supplied by TFA Global Pte Ltd.

DAX / GER40 - TODAYDAX is still bearish until break last Daily
ibb.co
I waiting to entry after Red H1 with arrow and dot

DAX IDEADAX is fundamentally bullish. After hitting supply zone, Now retrace at fb level 0.32%. At 4hrs its a healthy demand zone. target to buy attempt at support zone.
As seasonality 10yr is bullish and crowed is on Bearish side.
SMA (20,50,100,200) all are on bullish signal.
