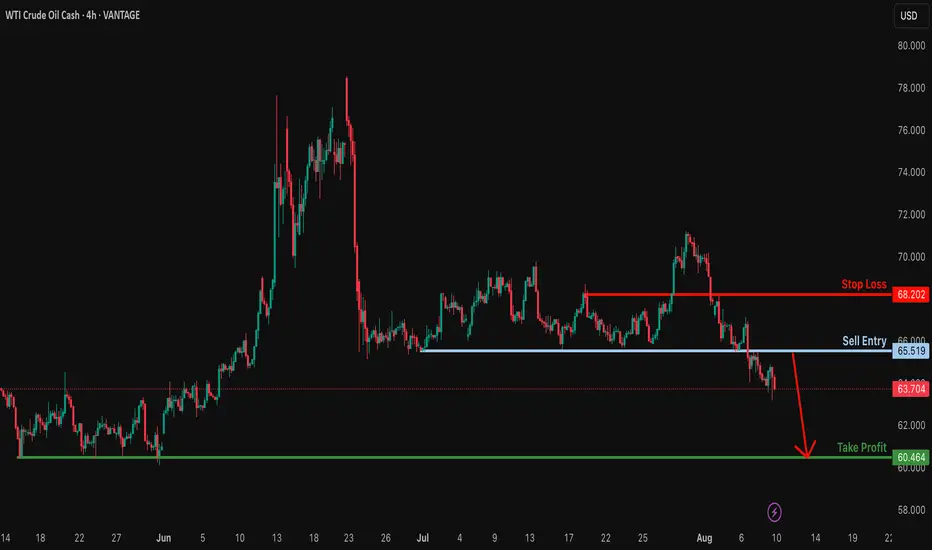
Bearish drop?USO/USD has reacted off the resistance level which is a pullback resistance and could potentially drop from this level to our take profit.
Entry: 65.51
Why we like it:
There is a pullback resistance.
Stop loss: 68.20
Why we like it:
There is a pullback resistance.
Take profit: 60.46
Why we like it:
There is a multi swing low support.
Enjoying your TradingView experience? Review us!
Please be advised that the information presented on TradingView is provided to Vantage (‘Vantage Global Limited’, ‘we’) by a third-party provider (‘Everest Fortune Group’). Please be reminded that you are solely responsible for the trading decisions on your account. There is a very high degree of risk involved in trading. Any information and/or content is intended entirely for research, educational and informational purposes only and does not constitute investment or consultation advice or investment strategy. The information is not tailored to the investment needs of any specific person and therefore does not involve a consideration of any of the investment objectives, financial situation or needs of any viewer that may receive it. Kindly also note that past performance is not a reliable indicator of future results. Actual results may differ materially from those anticipated in forward-looking or past performance statements. We assume no liability as to the accuracy or completeness of any of the information and/or content provided herein and the Company cannot be held responsible for any omission, mistake nor for any loss or damage including without limitation to any loss of profit which may arise from reliance on any information supplied by Everest Fortune Group.
OIL_CRUDE trade ideas
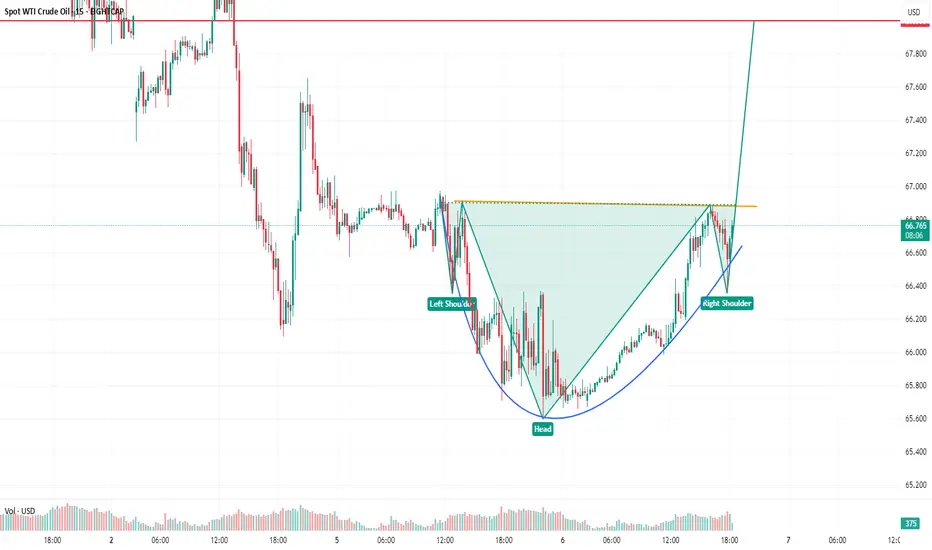
WTI Spot crudeinverted head and shoulder observed if breakout given target too in chart. Not a sebi registered analyst . No buy, sell and hold recommendation personal view.
WTI: Oil Markets on Edge Despite Trump Considering Major TariffsOil prices could drop if Trump backs down on tariffs on countries buying Russian oil, but short-term bullish catalysts, like geopolitical tensions and bullish speculative bets, may still push prices up before longer-term headwinds take hold.
----------------------------------------------------------------------------------------------------------------------
Trump’s threats of steep tariffs on countries buying Russian oil have sent oil prices surging, as traders fear a global supply crunch if Russian barrels are cut off.
But here’s the twist: Trump has a history of backing down or delaying tariffs after using them as leverage. When he does, oil prices usually fall, as the immediate risk of supply disruption fades.
If he caves in again by the deadline, which is 10 to 12 days from 4 August, or extends it, oil prices could drop. The bigger picture also appears bearish: OPEC+ is ramping up supply, global demand is slowing and expected to drop in H2, and inventories are rising (first glimpse by EIA, Wed).
But with the deadline falling around 14–16 August, 2025, short-term bullish catalysts could spark a rally up to the 38.2%-61.8 % Fibonacci retracement levels, positioning WTI better for declines (conditional on Trump!).
This content is not directed to residents of the EU or UK. Any opinions, news, research, analyses, prices or other information contained on this website is provided as general market commentary and does not constitute investment advice. ThinkMarkets will not accept liability for any loss or damage including, without limitation, to any loss of profit which may arise directly or indirectly from use of or reliance on such information.

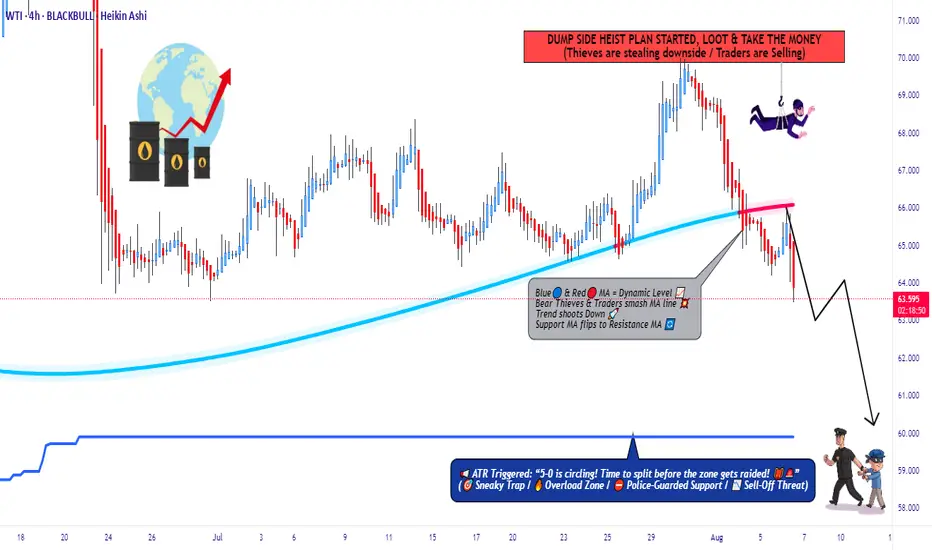
WTI Under Attack – Rob the Market with This Bear Setup🛢️💣 WTI Oil Short Raid: Bearish Heist Activated! 💣🛢️
📉 Thief Trader’s Limit-Layered Attack Plan 🔐
💥 Attention Market Robbers & Chart Breakers! 💥
We're about to break into the XTIUSD / US Oil Spot vault — Bearish style.
🚨 The Setup:
This ain’t your average breakout — we’re talking high-precision, multi-layered entries on a downside raid.
🧠 Thief Trader Strategy: Drop limit orders at key zones like trip wires. Let price walk into your trap.
🎯 Plan:
🧱 Entry: Any level after MA resistance confirmation.
Layer multiple limit orders — DCA-style — after trend shows weakness.
🛑 Stop Loss: 66.300 🔒
Protect your vault. Place SL just above major 4H rejection zone.
🎯 Target: 60.000 💰
Profit at exhaustion level. This is where bulls cry, and we cash out.
🧠 Robbery Logic Backed By:
COT Data 📊
Crude Oil Inventories 🛢️
Macro + Sentiment Flows 🌐
Technical MA Break + Retest Patterns 🎯
🔥 Why this isn’t a random short?
Because thieves do research — not guesswork.
Bulls have overextended. Oil’s price is reacting to strong supply pressure and weakening demand outlook.
⚠️ Risk Note:
No entry without trend confirmation.
No blind shots — place alerts and wait for the setup.
This is a sniper job, not a shotgun spray.
💬 Join the Robbery Crew
Smash that ❤️ & Boost if you're riding with the thieves!
Drop your charts, entries, or sniper shots in the comments 💬
We rob together. We win together.
🔔 Follow for more heist plans – next market break-in coming soon.
💰 Rob Smart. Trade Sharp. Exit Clean. 🏴☠️
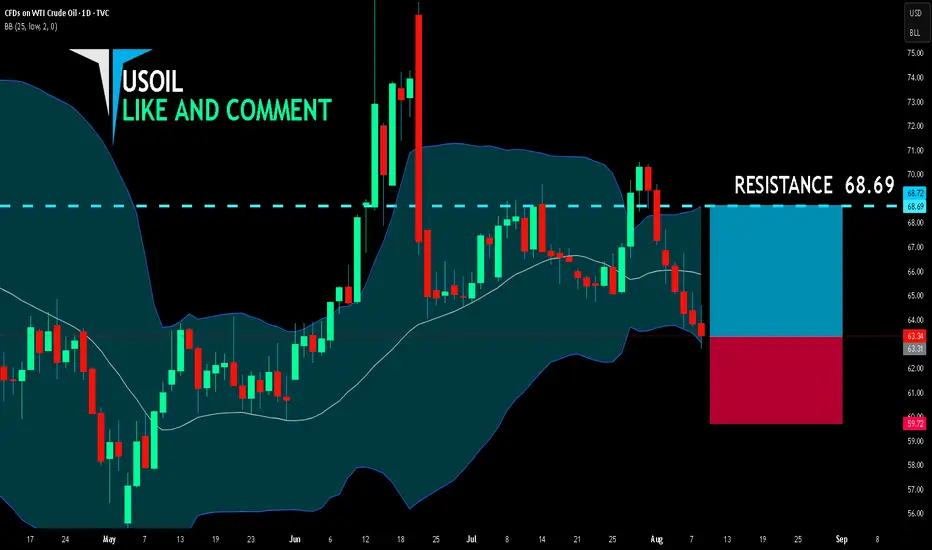
USOIL BEST PLACE TO BUY FROM|LONG
USOIL SIGNAL
Trade Direction: long
Entry Level: 63.31
Target Level: 68.69
Stop Loss: 59.72
RISK PROFILE
Risk level: medium
Suggested risk: 1%
Timeframe: 1D
Disclosure: I am part of Trade Nation's Influencer program and receive a monthly fee for using their TradingView charts in my analysis.
✅LIKE AND COMMENT MY IDEAS✅
Oil Faces Bearish Turn After Speculative SpikeOil Faces Bearish Turn After Speculative Spike
Since June 24, 2024, when oil prices reached $64 entered a 38-day bullish correction. Based on the chart, this move appears to be forming an ABC corrective pattern, which may now be nearing completion.
From here, a renewed decline is likely, with potential downside targets at $65, $60, and $56.
Geopolitical Speculation Oil prices jumped in recent days following President Donald Trump's heightened rhetoric toward Russia. His announcement of a tighter deadline to end the war in Ukraine, along with tariff threats targeting countries trading Russian oil, stirred market reactions.
However, this rally seems driven more by speculation, and oil may soon resume the bearish movement again.
You may find more details in the chart!
Thank you and Good Luck!
PS: Please support with a like or comment if you find this analysis useful for your trading day

Crude oil 4-hour channel and Bullish Shark pattern on 4-hour 1: Bullish Shark pattern on the 4-hour timeframe
2: Crude oil 4-hour channel
3: RSI indicator is currently in a low divergence state in the 4-hour cycle.
Wait for the reversal signal confirmation at the 4-hour level
or At the same time, the confirmation after the price breaks through the descending channel
can try long orders

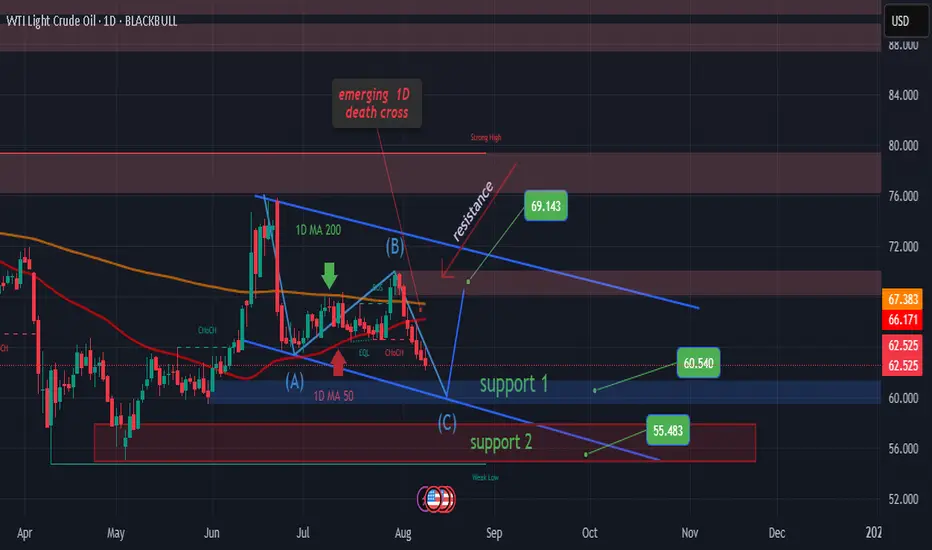
USOIL - EMERGING 1D DEATH CROSS ALERT
WTI Crude is breaking lower and is now forming its first 1D Death Cross since September 2024. While this setup is usually considered bearish, the last time it appeared, the market bottomed just two days later.
Currently, price is heading toward Support 1 ($60.54), with an extended bearish target at Support 2 ($55.48) if downside momentum accelerates. That said, the 1D RSI will be close to oversold by the time Support 1 is reached, increasing the probability of a rebound toward the Resistance zone at $69.29.
📉 Short-term bias: Bearish toward support
📈 Medium-term bias: Potential rebound once support is tested
#USOIL #WTI #CrudeOil #DeathCross #TechnicalAnalysis #Kaizo
USOIL Sellers In Panic! BUY!
My dear subscribers,
USOIL looks like it will make a good move, and here are the details:
The market is trading on 63.34 pivot level.
Bias - Bullish
My Stop Loss - 63.05
Technical Indicators: Both Super Trend & Pivot HL indicate a highly probable Bullish continuation.
Target - 63.89
About Used Indicators:
The average true range (ATR) plays an important role in 'Supertrend' as the indicator uses ATR to calculate its value. The ATR indicator signals the degree of price volatility.
Disclosure: I am part of Trade Nation's Influencer program and receive a monthly fee for using their TradingView charts in my analysis.
———————————
WISH YOU ALL LUCK

Us oil bullish setupI’m bullish and I was waiting for the pullback…its happening and I’m buying at the buy zones shown on the chart, stop will be the yellow line.


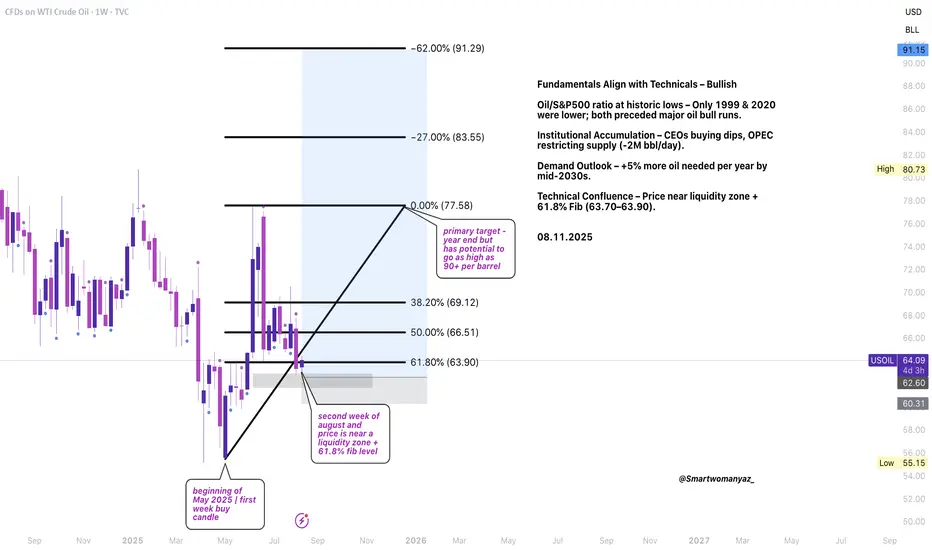
Fundamental + Technical Confirm Bullish TrendWhen news, insider positioning, and the weekly chart all align, I pay close attention and so should you.
Crude oil has built a strong bullish structure on the weekly timeframe, breaking above key resistance levels and holding higher lows. The recent OPEC+ decision to maintain a -2MM bbl/d production cut, combined with CEOs and major oil traders buying aggressively at every dip, provides strong fundamental confirmation of this trend.
In the U.S., gas prices are already trending upward which is another clear signal that the market is pricing in tighter supply and stronger demand.
From a technical perspective, price has cleared the 50% Fibonacci retracement and is now targeting the $77.50 zone in the short term. The medium-term projection sits near $90, with potential for higher if supply constraints persist. Pullbacks into support zones could present attractive re-entry opportunities for swing and position traders.
Bias: Bullish
Targets: $77.50 (short-term)
Chart: Weekly timeframe
If you agree with this outlook, drop your thoughts below or share this idea with others.
US OILHI GUYS,
We are in an order block of daily path chart pattern. three more swings up and down or buys and sells in this case intraday trades.
The chart above illustrates H4 entries on daily path . next week prepare to buy.

WTI Bull setupSwing trade
Bull points
- RSI div
- Wait for trend reversal
Put Buy stop on last Lower High or wait for HH and HL or reversal
RRR 1:1
Go for 1:2 manage your risk first...
Could Oil (WTI) Be Breaking Out of its Range?Oil (WTI) has moved back to the forefront of traders thinking this week after OPEC+’s weekend decision to raise September production by circa 550k barrels per day. They also put traders on notice that all options remain open regarding further production increases to replace another output layer, amounting to 1.66 million barrels per day that has been offline since 2023. A decision on what comes next is due to take place at a meeting scheduled for September 7th.
Perhaps unsurprisingly, this potential for extra production (supply) being unleashed into the market later in the year has led to some downside pressure for Oil this week. This is because it comes at a time of uncertainty surrounding Oil demand due to possible weaknesses in the global economy, created by President Trump’s tariff policies. Oil (WTI) prices have fallen 4.8% from opening levels on Monday to post a new 1 month low at 64.20 yesterday, a level that it currently holding (more on this in technical update below).
Looking forward, one of the challenges traders are facing for where Oil moves next is President Trump’s August 8th deadline for Russia to end the war with Ukraine or face fresh sanctions on its energy exports. President Trump has also suggested he would increase tariffs on countries buying Oil from Russia, including China, although right now India is his initial focal point in this regard and yesterday, he doubled tariffs on Indian goods (25% to 50%) due to the country’s purchases of Russian Oil. These new tariffs are due to start in 3 weeks’ time.
With so much uncertainty surrounding Oil prices, including reports of a possible meeting between President Trump and President Putin being scheduled at some stage next week, it could be useful to be prepared for a potential increase in Oil (WTI) price volatility.
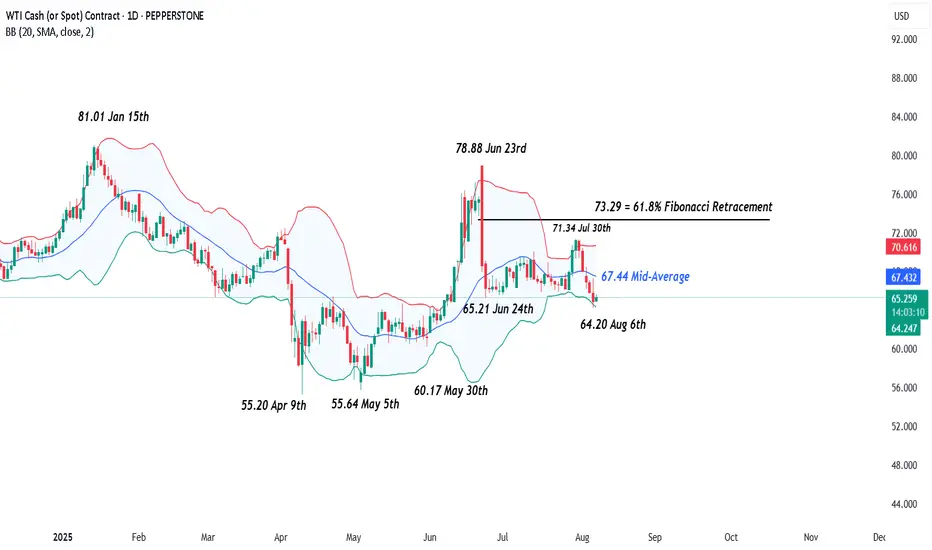
Technical Update: New Correction Lows Posted
Having seen the sharp sell-off in Oil between June 23rd and 24th 2025, a period of more balanced activity developed, as a reaction to over-extended downside conditions in price.
As the chart above shows, this resulted in a phase of sideways price activity between support marked by the 65.21 June 24th low, up to 71.34, which is equal to the July 30th failure high. However, price declines on Wednesday this week, have produced closes below 65.21, in the process of posting a new correction low at 64.20.
While communications between the US and Russia regarding the war in Ukraine are on-going, this type of break lower in the Oil price is no guarantee of future declines, so it could be helpful to assess what could be the potential support and resistance levels to focus on, just in case the outcome of these events lead to an increase in Oil price volatility.
Possible Next Support Levels:
As we have said above, the August 6th price weakness has seen a new correction low posted at 64.20, and this may now be viewed as the first support focus. Closes below 64.20 might then lead to a more extended decline in price.
Such moves would indicate the potential of further price weakness, with the next support possibly marked by the May 30th session low at 60.17, perhaps further towards 55.64 (May 5th low), if this level in turn gives way.
Potential Resistance Levels:
On the topside, within a period of price weakness, it can be the declining Bollinger mid-average that reflects the first possible resistance, and for Oil this currently stands at 67.44. Closing breaks above 67.44, if seen, could prompt further attempts to develop price strength to test higher resistance levels.
The first possible level would appear to be marked by 71.34, which is the July 30th session high. If this level was broken on a closing basis, it might then lead to tests of 73.29, which is equal to the 61.8% Fibonacci retracement of the June 23rd to June 24th sell-off.
The material provided here has not been prepared accordance with legal requirements designed to promote the independence of investment research and as such is considered to be a marketing communication. Whilst it is not subject to any prohibition on dealing ahead of the dissemination of investment research, we will not seek to take any advantage before providing it to our clients.
Pepperstone doesn’t represent that the material provided here is accurate, current or complete, and therefore shouldn’t be relied upon as such. The information, whether from a third party or not, isn’t to be considered as a recommendation; or an offer to buy or sell; or the solicitation of an offer to buy or sell any security, financial product or instrument; or to participate in any particular trading strategy. It does not take into account readers’ financial situation or investment objectives. We advise any readers of this content to seek their own advice. Without the approval of Pepperstone, reproduction or redistribution of this information isn’t permitted.
USOIL drops on rising supply and demand concernsUSOIL drops on rising supply and demand concerns
Oil prices fell Tuesday as OPEC+ planned a 547,000 bpd output increase for September, overshadowing potential Russian oil supply constraints from U.S. policies. Brent and WTI crude dropped to their lowest in a week, marking a fourth consecutive decline. OPEC+’s reversal of 2.5 million bpd cuts, combined with weak demand outlooks due to U.S. recession risks and China’s lack of new stimulus, pressured prices. Trump’s threatened 100% tariffs on Russian crude buyers like India, which imports 1.75 million bpd, heightened trade tensions but failed to lift oil prices. Analysts warn U.S. tariffs could further weaken global growth and fuel demand.
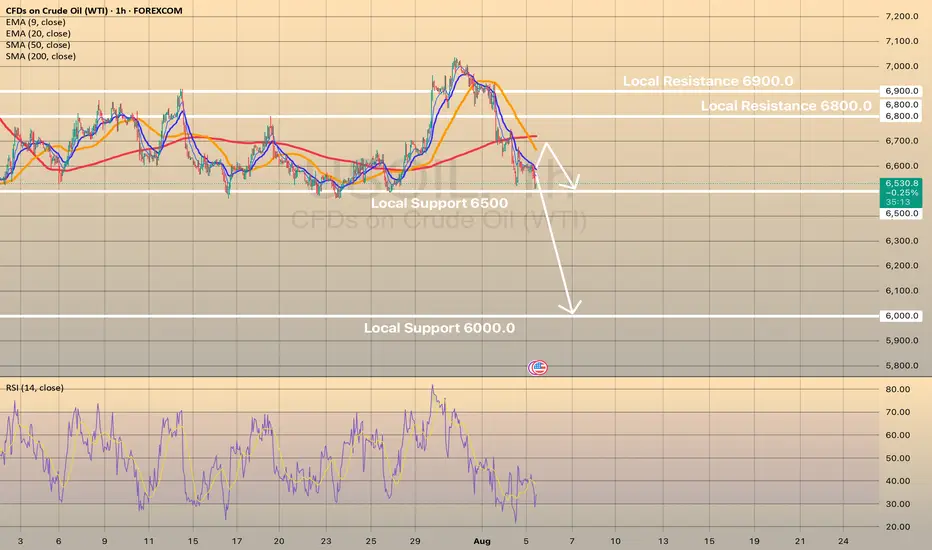
USOIL shows some in-moment strength on RSI on 1-h chart, the price may rebound towards sma200 at 6,700.00. However, in long-term perspective, low oil price is expected. Eventually, the price may decline towards level of 6,000.00.
USOIL BULLISH BIAS RIGHT NOW| LONG
USOIL SIGNAL
Trade Direction: long
Entry Level: 66.22
Target Level: 69.94
Stop Loss: 63.73
RISK PROFILE
Risk level: medium
Suggested risk: 1%
Timeframe: 9h
Disclosure: I am part of Trade Nation's Influencer program and receive a monthly fee for using their TradingView charts in my analysis.
✅LIKE AND COMMENT MY IDEAS✅

USOIL Bulls Seize a New OpportunityThe EIA crude oil inventory data is scheduled for release today and is expected to have a significant impact on USOIL prices. Based on the previously released API report, there’s a high probability that the EIA data will also be bullish.
From a technical perspective, USOIL is currently showing signs of a potential rebound. Therefore, for traders participating in USOIL today, it may be more favorable to adopt a bullish bias. If managed well around key support levels and timing, the setup could offer attractive profit opportunities.

USOIL Long trade Risking 1% to make 1.6% ProfitTVC:USOIL Long trade, with my back testing of this strategy, USOIL is long.
This is good trade.
Don't overload your risk like Greedy gambler!!!
Be Disciplined Trader, what what you can afford.
Use proper risk management
Looks like good trade.
Lets monitor.
Use proper risk management.
Disclaimer: only idea, not advice
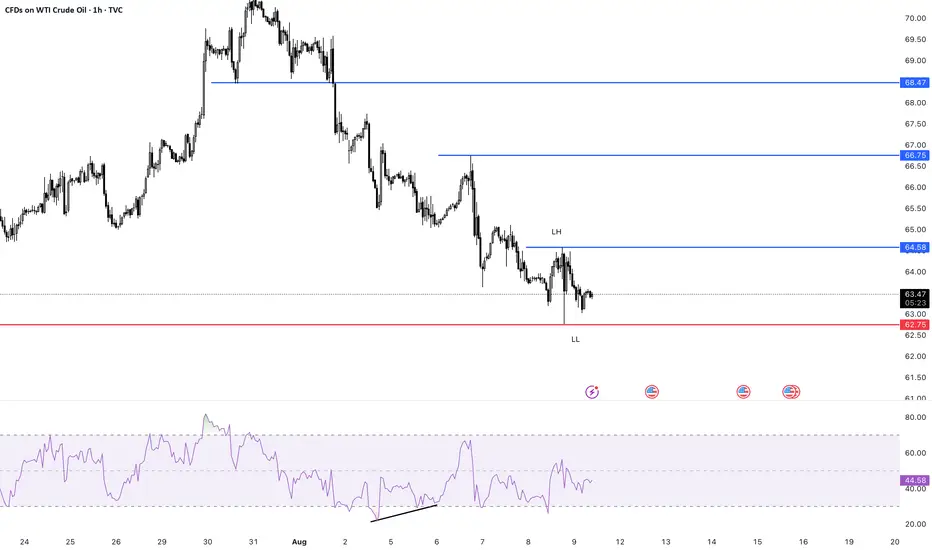
Crude Oil Analysis (WTI / USOIL)Crude oil is currently trading near a key resistance area around $64.00, with the overall trend still bearish.
🔹 Bearish Scenario:
If the price breaks below $63.60 and holds, it may target $62.80 followed by $62.00.
🔹 Bullish Scenario:
If the price manages to break above $64.58 and sustain the move, it could retest the $65.00 zone, and with continued bullish momentum, extend toward $66.30.

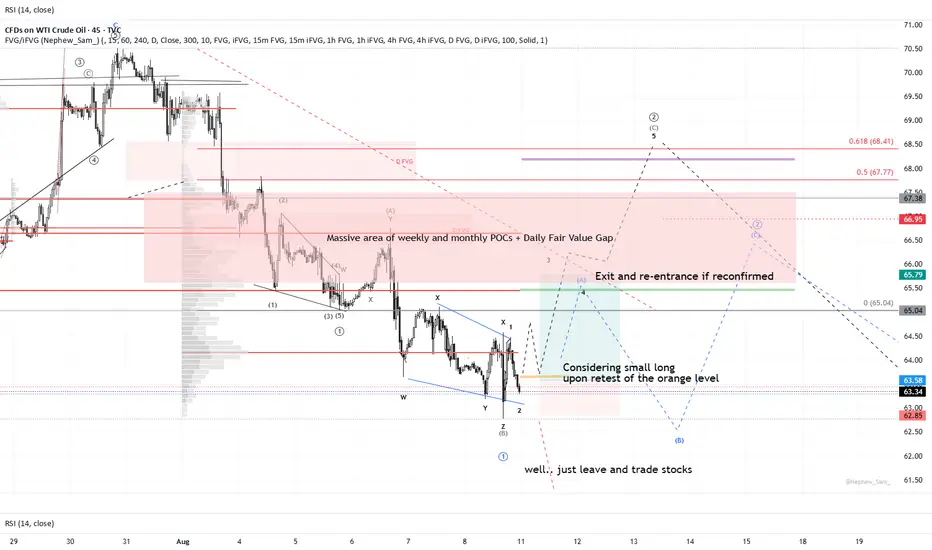
OIL:Trading Against the Trend: Waiting for a Correction to ShortI'm still battling the market here, waiting for a pullback that would:
Reject price from resistance
Print a clean corrective wav
e for a short entry
Counter-trend trading usually ends as well as holding over weekends—poorly.
That said, levels keep the roadmap clear. Pullbacks can play out a dozen ways.
A bounce into these zones would also sweep last week's FVG liquidity.
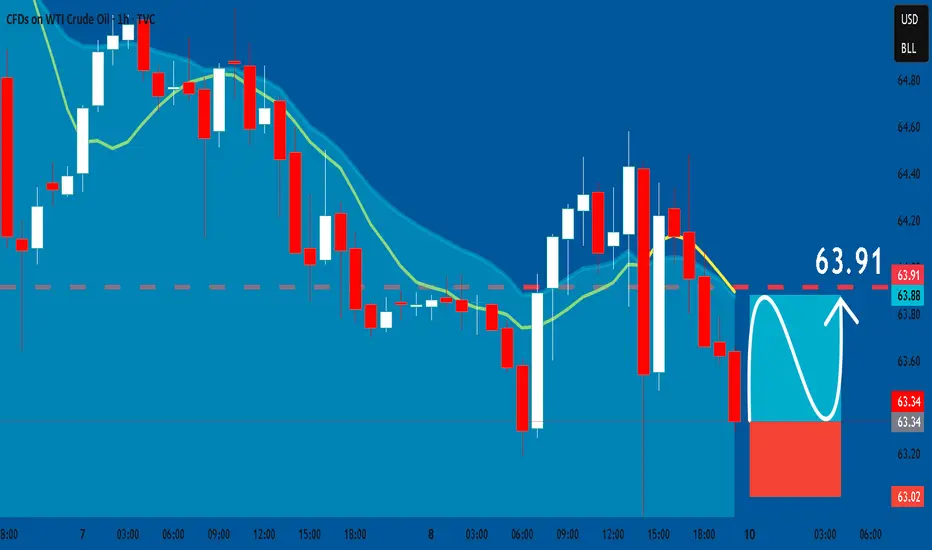
USOIL: Long Signal with Entry/SL/TP
USOIL
- Classic bullish formation
- Our team expects pullback
SUGGESTED TRADE:
Swing Trade
Long USOIL
Entry - 63.34
Sl - 63.02
Tp - 63.91
Our Risk - 1%
Start protection of your profits from lower levels
Disclosure: I am part of Trade Nation's Influencer program and receive a monthly fee for using their TradingView charts in my analysis.
❤️ Please, support our work with like & comment! ❤️
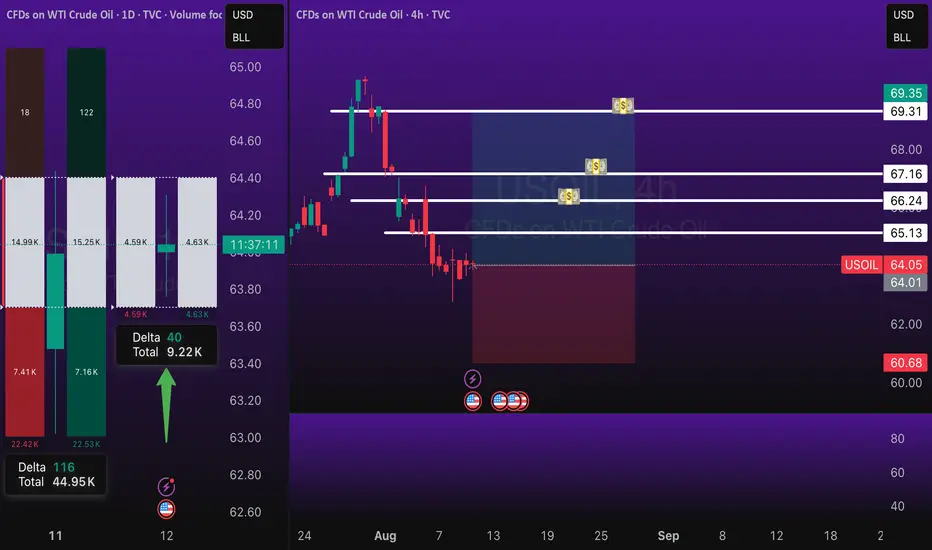
USOIL rebounds from 6,300.0. Where next?USOIL rebounds from 6,300.0. Where next?
USOIL bounced back from the 6,300.0 mark on Tuesday, building on slight gains from the prior session, after President Donald Trump prolonged a tariff truce with China for an additional 90 days. The decision, made just before new tariffs were due, provided temporary relief from rising trade tensions that might hinder global growth and energy demand. The modest rise towards SMA50 and 6,500.0 level is expected. Market participants will also be waiting for OPEC’s monthly report, along with US EIA and IEA forecasts, for fresh supply–demand signals.
