OM (SPOT)BINANCE:OMUSDT
#OM/ USDT
Entry range (0.2360- 0.2460)
SL 4H close below 0.02287
T1 0.32
_______________________________________________________
Golden Advices.
********************
* collect the coin slowly in the entry range.
* Please calculate your losses before the entry.
* Do not enter any

OMUsdt short to $0.24sl: $0.2719
Tp: $0.24
Breaking down right now. Time sensitive
DTT strategy applied.


OMUSDT Forming Descending ChannelOMUSDT is exhibiting a classic descending channel pattern, often viewed as a bullish reversal signal when accompanied by strong support levels and rising interest. The asset has been consolidating within this downward-sloping channel, and the current price action shows signs of coiling for a potenti
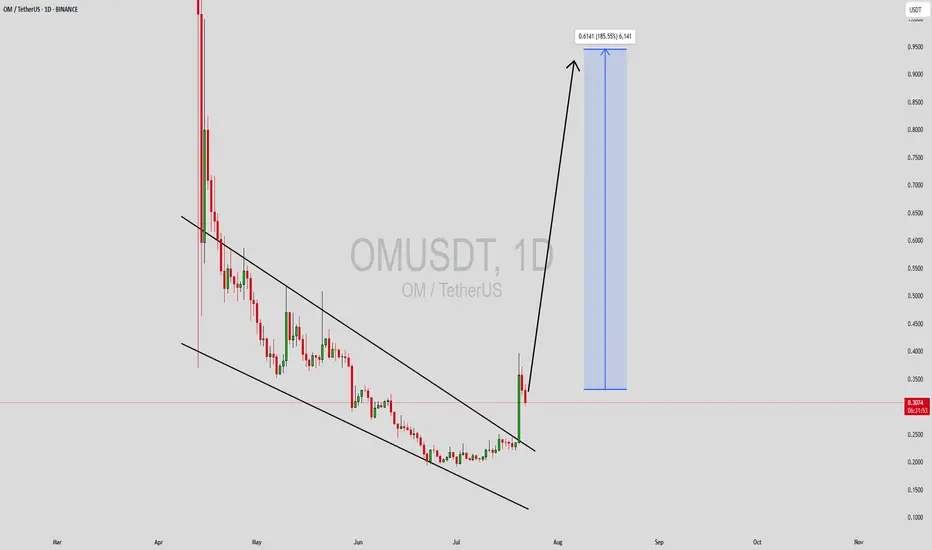
WAIT FOR BREAKOUT AND GO LONG THIS MIGHT BE THE LAST CHANCEThis chart is a technical analysis idea for the OM/USDT pair on the daily timeframe from TradingView. Here's a breakdown of the idea:
🔍 Overview
Pair: OM/USDT
Exchange: Binance
Timeframe: 1D (Daily)
📉 Current Market Context
The price is in a strong downtrend, forming a falling wedge (marked with re

OMU/USDT | Long | Cardano Utility Narrative | (July 2025)OMU/USDT | Long | Post-Liquidation Bounce with Cardano Utility Narrative | (July 2025)
1️⃣ Short Insight Summary
OMU just went through a major flush, with both sides of the market likely wiped out. With shorts now likely trapped and interest picking up again, we could see a strong upside reaction,

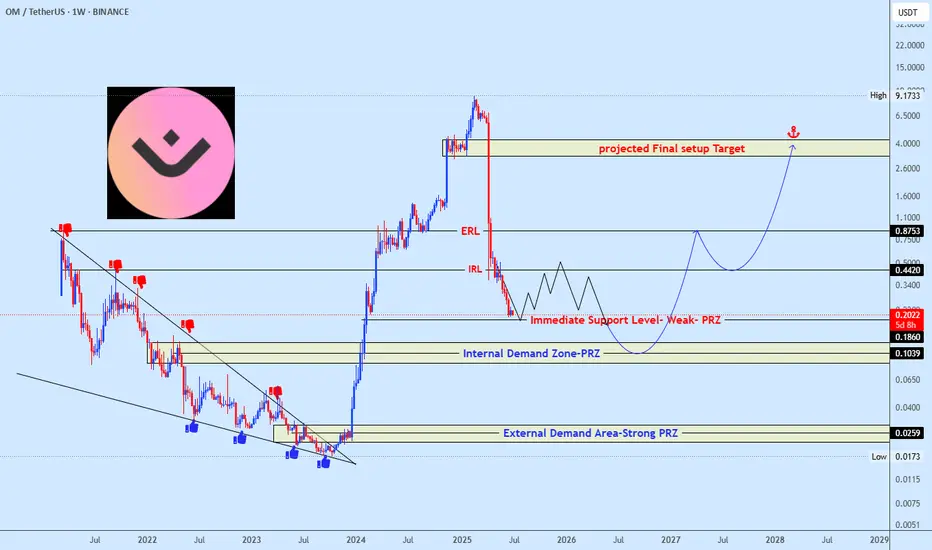
OMUSDT Approaching Demand ZonesOMUSDT has seen a sharp decline from its peak and is now approaching key demand zones. Price is reacting around a weak support level, with further downside likely toward the Internal PRZ (around $0.1039) and at this zone major reversal should happen unless if unexpected happen then the next area to
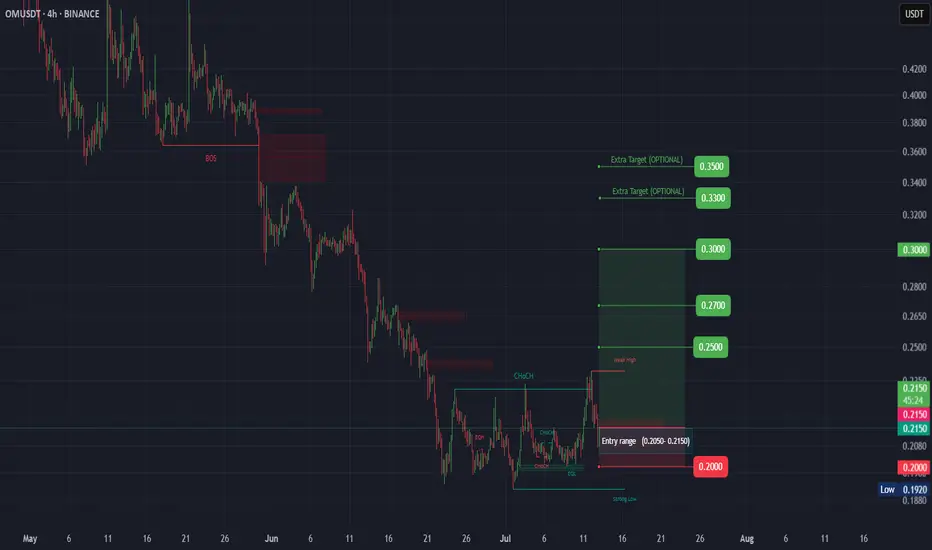
OM (SPOT)BINANCE:OMUSDT
#OM/ USDT
Entry range (0.2050- 0.2150)
SL 4H close below 0.02000
T1 0.25
T2 0.27
T3 0.30
_______________________________________________________
Golden Advices.
********************
* collect the coin slowly in the entry range.
* Please calculate your losses before the entry.
* D
$OM/USDT Ready for Breakout?BINANCE:OMUSDT has been stuck in a downtrend for weeks, but things are getting interesting.
It’s now forming a falling wedge, a pattern that often signals a strong bounce is coming.
If it breaks out with good volume, we could see a sharp move up toward the $0.59–$0.65 zone, which is nearly 180% f

OMUSDT scalp shortOpened a scalp short a while ago on OMUSDT. I anticipate another push down back to $0.2020 before we get reversal back to the upside....or not.
Stop: $0.2090
Tp: $0.2020
2.5 RR

See all ideas
Summarizing what the indicators are suggesting.
Oscillators
Neutral
SellBuy
Strong sellStrong buy
Strong sellSellNeutralBuyStrong buy
Oscillators
Neutral
SellBuy
Strong sellStrong buy
Strong sellSellNeutralBuyStrong buy
Summary
Neutral
SellBuy
Strong sellStrong buy
Strong sellSellNeutralBuyStrong buy
Summary
Neutral
SellBuy
Strong sellStrong buy
Strong sellSellNeutralBuyStrong buy
Summary
Neutral
SellBuy
Strong sellStrong buy
Strong sellSellNeutralBuyStrong buy
Moving Averages
Neutral
SellBuy
Strong sellStrong buy
Strong sellSellNeutralBuyStrong buy
Moving Averages
Neutral
SellBuy
Strong sellStrong buy
Strong sellSellNeutralBuyStrong buy
Displays a symbol's price movements over previous years to identify recurring trends.