OMUSDT Forming Falling WedgeOMUSDT is forming a clear falling wedge pattern, a classic bullish reversal signal that often indicates an upcoming breakout. The price has been consolidating within a narrowing range, suggesting that selling pressure is weakening while buyers are beginning to regain control. With consistent volume confirming accumulation at lower levels, the setup hints at a potential bullish breakout soon. The projected move could lead to an impressive gain of around 90% to 100% once the price breaks above the wedge resistance.
This falling wedge pattern is typically seen at the end of downtrends or corrective phases, and it represents a potential shift in market sentiment from bearish to bullish. Traders closely watching OMUSDT are noting the strengthening momentum as it nears a breakout zone. The good trading volume adds confidence to this pattern, showing that market participants are positioning early in anticipation of a reversal.
Investors’ growing interest in OMUSDT reflects rising confidence in the project’s long-term fundamentals and current technical strength. If the breakout confirms with sustained volume, this could mark the start of a fresh bullish leg. Traders might find this a valuable setup for medium-term gains, especially as the wedge pattern completes and buying momentum accelerates.
✅ Show your support by hitting the like button and
✅ Leaving a comment below! (What is your opinion about this Coin?)
Your feedback and engagement keep me inspired to share more insightful market analysis with you!
Market insights

$OM MANTRA coin analysis Hi 👋🏻 it's me your " Raj_crypt0 " ..... 💚
will BINANCE:OMUSDT next KRAKEN:LUNAUSD
" Yes , I hope so - 90% new High not possible
I hope it's not possible "
coin already got squeezed at $5/5.5 in weekly to 3 month time frame as weakness we can observe
Upcoming downtrend 📉 target 🎯 is - $0.1
$0.1 / 0.0875 ...... 🎯 Support 💪🏻 let me meet u there 😂
" U have a question ⁉️ does ' alts season ' & ' BULL RUN ' completed - obviously 🙄 ' NO ' "
CRYPTOCAP:TOTAL haven't reached 5T 🎯 - still season was around corner
" Some coins complete early bull , some late _&_ some on time " nothing much ✔️

Where Can We Rebuy OM? (1W)After the heavy drop, it became evident that a bearish trend had started, and the price is now seeking high-liquidity (buy) zones.
Based on the chart, the green zone stands out as the best area for a potential rebuy — it could launch the price upward by 100% to 500%.
Reaching this zone may take several weeks or even months.
A weekly candle closing below the invalidation level would invalidate this outlook.
For risk management, please don't forget stop loss and capital management
Comment if you have any questions
Thank You

700% Potential: $OMUSDT at Key Support.The NASDAQ:OM chart shows price testing a key support zone around 0.2195, with a huge upside potential if it holds.
A 700% gain could be possible, targeting 1.6165.
Watch for confirmation above this level before jumping in.
DYOR, NFA


Approximately 92.6% decline OM Token 🚨 IMPORTANT RISK AND LIABILITY DISCLAIMER:
Attention: This analysis is solely a prediction and does not constitute any form of financial advice. Trading in financial markets carries a high level of risk and may lead to the loss of your capital. Before making any financial decisions, consult with a qualified professional advisor.
📉 Technical Analysis - High Risk Warning 📉
🎯 Predicted Target: $0.0175 (Approximately 92.6% decline)
Final Note: This analysis is provided based solely on technical examination. Fundamental factors and new developments can quickly invalidate this prediction. Always seek multiple analytical sources and never make investment decisions based on a single opinion.
Risk Warning: Financial markets are inherently volatile and may result in the complete loss of capital. This analysis should not be interpreted as financial advice or a solicitation to buy or sell.

OM RT-TOOL 3.0 UPDATEOM is trading in a massive area of support and offers a easy invalidation of minus 3.5%
RT-Tool 3.0 not only tells you when to buy but ALSO when ABSOLUTELY NOT to buy. We dont trade in betweent the context pulls! only when double red or blue is touched.

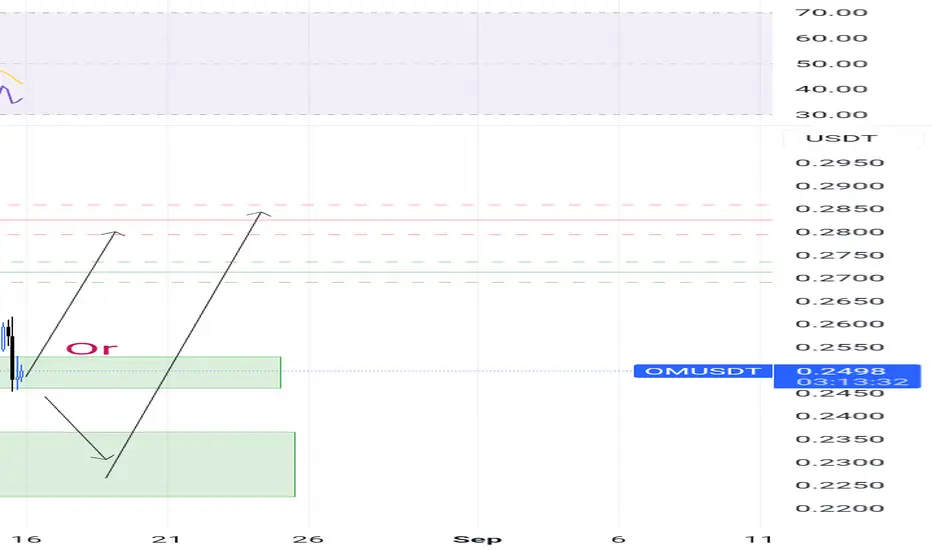
OMUSDTLets join us!
2 strategy can happen!
Both of them will rich .2800 or more...
Candle stick pattern in daily will happen tomorrow and it will grow!😁
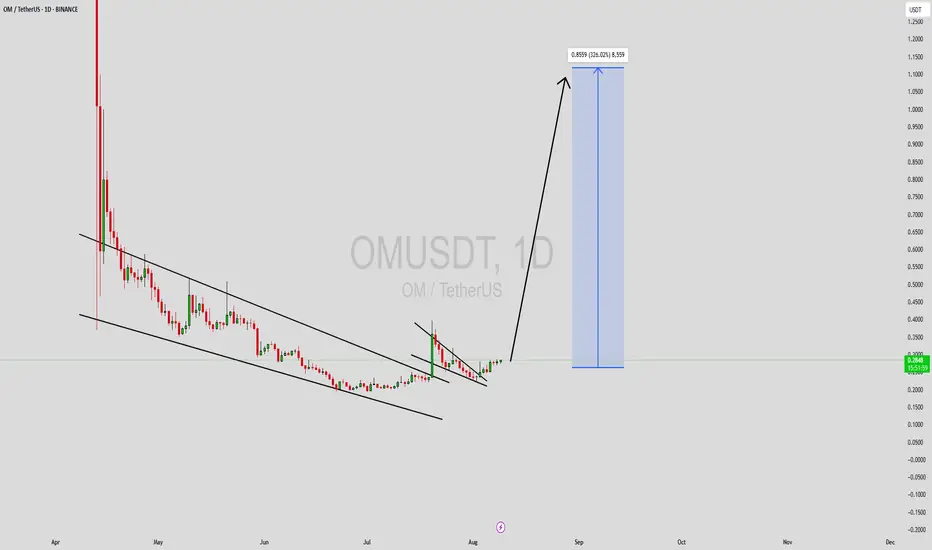
OMUSDT Forming Descending ChannelOMUSDT (OM / TetherUS) is currently showing a textbook descending channel breakout on the daily chart. After a steep downtrend, price has formed a tightening channel and is now pushing upward—signalling a potential major reversal. The breakout is supported by solid volume, suggesting accumulation and renewed investor confidence.
This technical foundation comes amid an asset that has suffered a deep correction—down over 90% from its all-time high. Despite this, OM still maintains interest thanks to ongoing development and a committed team working toward recovery. In that context, the current wave of momentum offers a compelling high-reward opportunity.
Analysts tracking the setup note that a confirmed channel breakout could lead to an explosive move—potentially targeting 290% to 300% gains from current levels, given the absence of nearby resistance and the strength of the impulse wave already in motion.
In summary:
* A descending channel has broken, signaling a potential trend reversal.
* Good volume validates the strength behind this move.
* OM remains a speculative but high-upside candidate—as long as investors are cautious of its volatile history.
This setup is ideal for breakout-focused traders with high risk tolerance and a structured plan.
✅ Show your support by hitting the like button and
✅ Leaving a comment below! (What is Your opinion about this Coin)
Your feedback and engagement keep me inspired to share more insightful market analysis with you!
OM big long to $0.3572Just now opened a long position on OM. Aiming for $0.3572 however will scale out at least 50% at $0.32
Seems like correction is over and possibly market about to pump
Sl: 0.2645
Tps on chart

OM / USDT : Breaking out from Trendline resistanceOMUSDT has broken above a descending trendline on the 4H timeframe after multiple rejections in recent weeks. This breakout could signal a shift in momentum from bearish to bullish.
If price holds above the breakout level around 0.262, the next potential target lies near 0.31, representing an estimated 19% upside from current levels.
Key points:
Timeframe: 4H
Setup: Descending trendline breakout
Breakout level: ~0.262
Target: ~0.31 (+19%)
Stop loss: Below breakout level to manage risk
As always, wait for confirmation and manage risk appropriately before entering a trade.

OM Prepares Recovery Catastrophic Crash · 2,000% Easy PotentialMantraDAO (OM) performed a catastrophic crash in April and the bottom was hit in June. Keep in mind that it doesn't matter how hard a project crashes, it tends always to recover.
Once upon a time Solana produced a major, major crash and people started to run away. I saw this as an amazing opportunity and recommend buy for Solana when it was below $20 and guess what happened next? Solana is today one of the top performers.
When a project produces a very strong crash, for one reason or the other, it tends to recover strongly at the next market cycle. The action tends to move back to the previous high or the baseline.
OMUSDT found support exactly where there was a stop in February 2024. The launchpad for the final leg-up of the previous bullish cycle. When I saw this same level activated perfectly, it called my attention. What do you see?
Resistance (the last high) turns into support. Support (February 2024) stays support. Long-term support tends to work over and over and here we have a long-term one.
The action short-term has already many of the classic reversal signals. After the main drop in April we had some lower lows as an ending diagonal. Then the main low is followed by a higher low, rising volume and marketwide action heating up.
It is here...
We are here...
It is happening now...
Crypto is going up.
Prepare for the ride, prepare for the profits and prepare for the fun.
It will be wild... You will be extremely happy with the results.
MantraDAO is set to grow.
Buy when prices are low.
Namaste.

OMUSDT DEAD OR THE BEST LONG OPP TODAY?I think you would have to be putting a little something at the bottom. Bllod in the market buying with little downside apart from going to zero.
Not a lot of thesis here as timing is also a thing. Forgive me.

OM (SPOT)BINANCE:OMUSDT
#OM/ USDT
Entry range (0.2360- 0.2460)
SL 4H close below 0.02287
T1 0.32
_______________________________________________________
Golden Advices.
********************
* collect the coin slowly in the entry range.
* Please calculate your losses before the entry.
* Do not enter any trade you find it not suitable for you.
* No FOMO - No Rush , it is a long journey.

OMUsdt short to $0.24sl: $0.2719
Tp: $0.24
Breaking down right now. Time sensitive
DTT strategy applied.


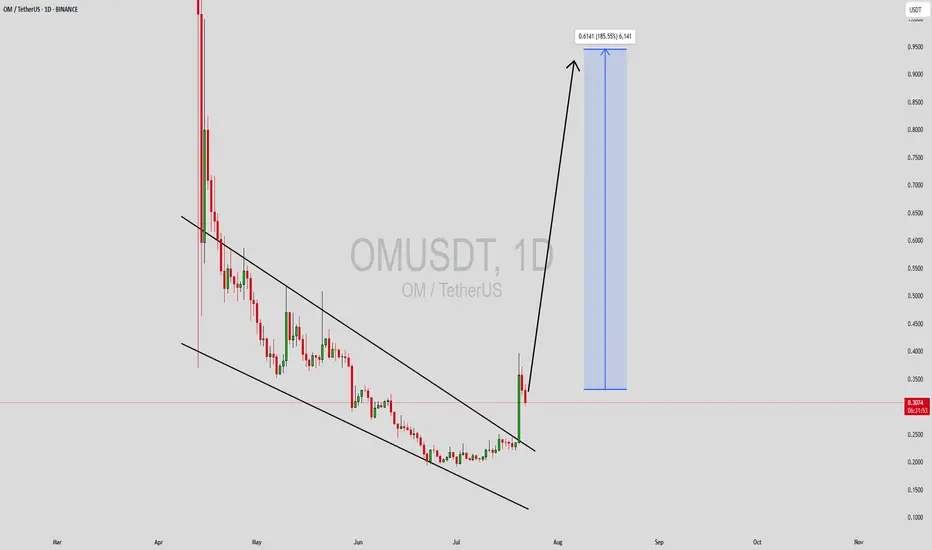
OMUSDT Forming Descending ChannelOMUSDT is exhibiting a classic descending channel pattern, often viewed as a bullish reversal signal when accompanied by strong support levels and rising interest. The asset has been consolidating within this downward-sloping channel, and the current price action shows signs of coiling for a potential breakout to the upside. The good trading volume further validates this setup, hinting that accumulation is likely taking place beneath the surface. If the breakout confirms, a powerful move of 140% to 150%+ could be on the horizon.
The OM token, which powers the MANTRA ecosystem, is gaining traction among long-term holders and traders alike. With increasing attention toward decentralized finance and staking infrastructure, OM is benefiting from renewed optimism in this sector. Technical indicators on multiple timeframes align with the bullish scenario, especially if price action continues to respect the support trendline while testing resistance zones.
Traders are eyeing key breakout levels near the upper boundary of the channel, and a close above it could trigger aggressive buying. As this happens, the potential for a parabolic rally becomes significantly more likely. Keep an eye on volume surges and momentum indicators like RSI or MACD to catch early signs of this move materializing.
✅ Show your support by hitting the like button and
✅ Leaving a comment below! (What is You opinion about this Coin)
Your feedback and engagement keep me inspired to share more insightful market analysis with you!
WAIT FOR BREAKOUT AND GO LONG THIS MIGHT BE THE LAST CHANCEThis chart is a technical analysis idea for the OM/USDT pair on the daily timeframe from TradingView. Here's a breakdown of the idea:
🔍 Overview
Pair: OM/USDT
Exchange: Binance
Timeframe: 1D (Daily)
📉 Current Market Context
The price is in a strong downtrend, forming a falling wedge (marked with red trendlines), which is typically a bullish reversal pattern.
Price is currently around $0.2539.
📊 Key Levels (Support Zones in Green)
$0.2539 (Current Price)
$0.2390
$0.2285
$0.2250
$0.2224
$0.2100
$0.1882
$0.1115
$0.1016
These green lines represent support zones—potential reversal areas if price falls further.
🟨 Yellow Boxes
These are higher time frame demand zones or accumulation areas, suggesting stronger possible reversal points if price drops deeper.
Placed between $0.14 - $0.04 zone.
📈 Red Arrows
Indicate possible reversal paths:
A bounce from current levels
A dip into deeper support zones before bouncing
A flush into yellow zones before reversal
🗓️ Time-Based Prediction
The note says:
“19, 21, 23, and 30th June might be positive for OM”
This suggests a time cycle forecast—the analyst expects bullish price action on or around these dates, possibly based on astro-cycles, Gann analysis, or time symmetry.
"Despite expecting lower prices, the setup signals that investors are preparing for accumulation—especially near key dates and support levels."
✅ Summary
Wait for wedge breakout confirmation to go long.
Key bullish reversal dates: June 19, 21, 23, and 30
Multiple layered supports and demand zones to watch.

OMU/USDT | Long | Cardano Utility Narrative | (July 2025)OMU/USDT | Long | Post-Liquidation Bounce with Cardano Utility Narrative | (July 2025)
1️⃣ Short Insight Summary
OMU just went through a major flush, with both sides of the market likely wiped out. With shorts now likely trapped and interest picking up again, we could see a strong upside reaction, especially as Omura’s platform continues to grow.
2️⃣ Trade Parameters
Bias: Long
Entry: Market entry or on dips around $0.40–$0.42 (post-liquidation zone)
Stop Loss: $0.23 (below current structure and liquidation base)
TP1: $0.60 (first partial take profit zone)
TP2: $1.20 (major round number and structure target)
TP3: $3.59 (macro target if upside momentum builds)
TP4: $4.65
TP5: $5.68–$6.00 (final take-profit zone if hype returns)
Partial Exits: At each level above—scaling out to manage risk.
3️⃣ Key Notes
✅ OMU is a utility token on Cardano offering 100% fee sharing to stakers—making it attractive during platform growth phases.
✅ Cardano ecosystem attention is rising, and OMU’s tie to usage and staking gives it clear fundamental demand drivers.
✅ Liquidation flush likely cleared overleveraged shorts; combined with platform growth, this sets the stage for a possible bounce.
❌ Thin liquidity and low cap make OMU prone to manipulation—price may be volatile and easily moved.
❌ Market sentiment can shift quickly; Cardano-based tokens can lag Ethereum-driven trends.
❌ Don’t chase—wait for structure or confirmation before entry.
4️⃣ Optional Follow-up Note
I’ll be watching closely this week for signs of strength or rejection around $0.60 and will post an update if we see a clean break or failed rally.
Please LIKE 👍, FOLLOW ✅, SHARE 🙌 and COMMENT ✍ if you enjoy this idea! Also share your ideas and charts in the comments section below! This is best way to keep it relevant, support us, keep the content here free and allow the idea to reach as many people as possible.
Disclaimer: This is not a financial advise. Always conduct your own research. This content may include enhancements made using AI.
Ask ChatGPT

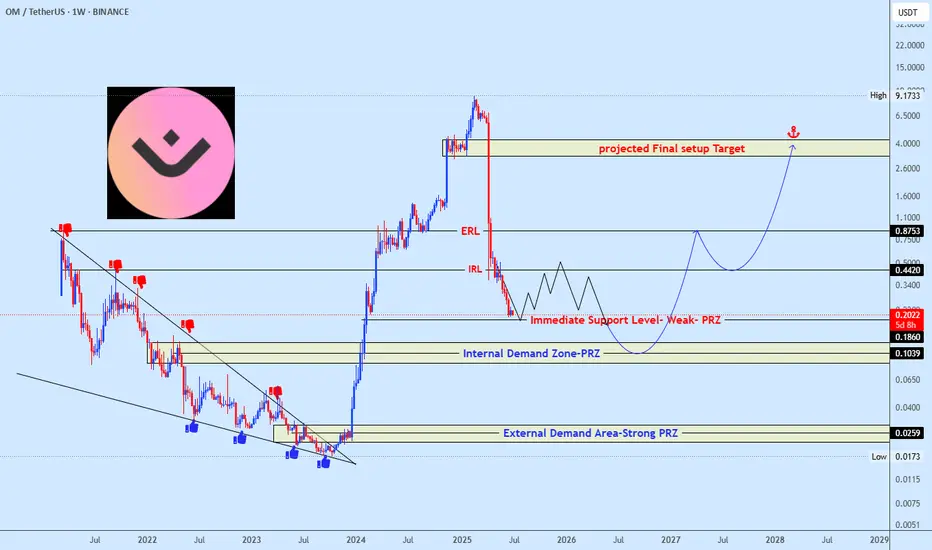
OMUSDT Approaching Demand ZonesOMUSDT has seen a sharp decline from its peak and is now approaching key demand zones. Price is reacting around a weak support level, with further downside likely toward the Internal PRZ (around $0.1039) and at this zone major reversal should happen unless if unexpected happen then the next area to keep an eye on is the External Strong PRZ (near $0.0259) which is mostly unlikely.
A strong bullish structure could form from these zones, targeting a long-term recovery toward $0.44, $0.87, and ultimately the $4.00 which serves as projected final setup target zone.
Watch price behavior closely at these levels for early signs of reversal.
We spotted the previous falling wedge setup accurately and this time will not be difference, make sure not to miss the opportunity when the price reaches the projected zone.
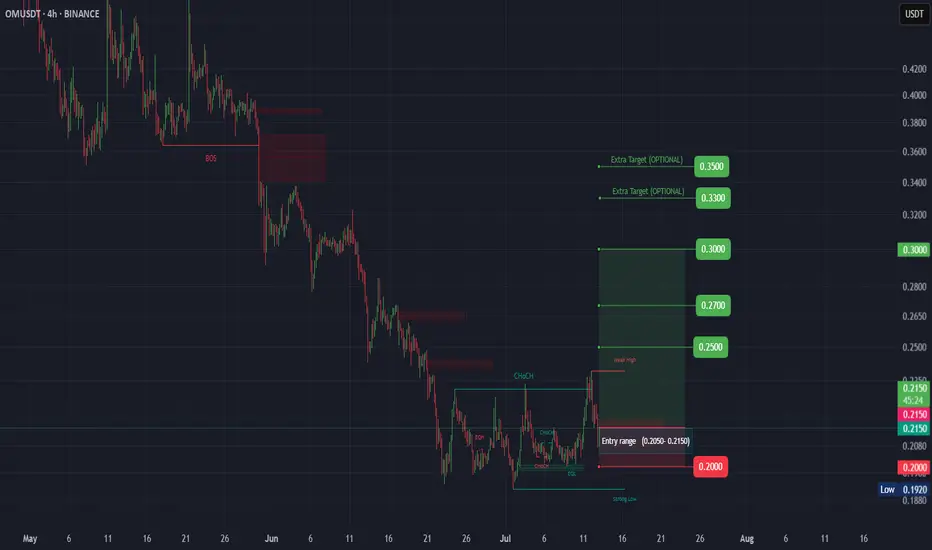
OM (SPOT)BINANCE:OMUSDT
#OM/ USDT
Entry range (0.2050- 0.2150)
SL 4H close below 0.02000
T1 0.25
T2 0.27
T3 0.30
_______________________________________________________
Golden Advices.
********************
* collect the coin slowly in the entry range.
* Please calculate your losses before the entry.
* Do not enter any trade you find it not suitable for you.
* No FOMO - No Rush , it is a long journey.
$OM/USDT Ready for Breakout?BINANCE:OMUSDT has been stuck in a downtrend for weeks, but things are getting interesting.
It’s now forming a falling wedge, a pattern that often signals a strong bounce is coming.
If it breaks out with good volume, we could see a sharp move up toward the $0.59–$0.65 zone, which is nearly 180% from here.
But if it drops below the wedge, that setup gets invalidated.
DYRO, NFA

OMUSDT scalp shortOpened a scalp short a while ago on OMUSDT. I anticipate another push down back to $0.2020 before we get reversal back to the upside....or not.
Stop: $0.2090
Tp: $0.2020
2.5 RR
