ONDO long term scenarioONDO looks promising, now we are at the important support line where we can find an entry point for a good LONG position, the only thing we have to notice its a short squeeze and liquidity collection before we start mooning. I`m waiting for the formation and line touch, then I will be ready for the

$ONDO Ready to FlyONDO retested the breakout trendline and bounced from a strong demand zone 0.84–0.87.
If the retest holds, bulls could target $1.20 / $1.63 / $2.14 a potential 135% move!
Watch for confirmation & volume spike.
Invalid below $0.8060
DYRO, NFA

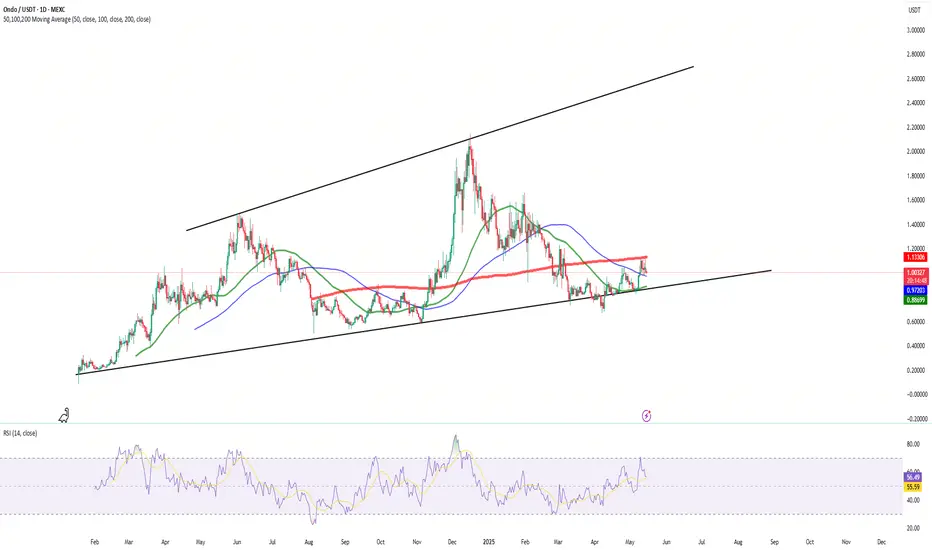
ONDO Daily TF UpdateONDO just closed above the 50MA and 100MA on the daily chart — now it's knocking on the door of the 200MA. If it breaks through, the next target is $3.
The RSI is around 56.7, suggesting neutral momentum—neither overbought nor oversold. This indicates that while there's potential for upward movement
$1.0 Breakout Could Send ONDO to $1.5I expect BYBIT:ONDOUSDT.P to continue its upward movement from the low it reached in the first week of April. The price has been consolidating between $0.8 and $1.0 since the end of April. Following this consolidation, I anticipate the price moving towards the $1.3-$1.5 range.

#ONDO Bullish Head and Shoulders📊#ONDO Bullish Head and Shoulders📈
🧠From a structural point of view, we have a bullish head and shoulders structure constructed near the uptrend support line and the yellow support zone, so we expect a nice upside to come.
Let's see👀
🤜If you like my analysis, please like💖 and share💬 BITGET:ONDOU

Ondo short to $0.9279Just now entered a short position on ondo.
Targeting $0.9279 area. Based on the current pa I expect a breakout to the downside.
stop: $0.9865 or higher
Roughly 2RR

ONDO following channel rangeAs I told you in my last post, that on 4H TF , ONDO rejected from 50 MA and going to test 200 MA, and it tested 200 MA and doesn't hold the 200 MA on 4H TF. I think it's going to test bottom of the channel , and there is a high probability that it will test $0.80 to $0.85 range because of the Bitcoi

ONDO (Ondo Finance) – Long Swing Trade Setup Near Key SupportONDO is retracing alongside broader market weakness and is approaching a key support zone around $0.95, which previously acted as a breakout base. This area now presents a potential high-reward swing trade if buyers step in to defend the level.
🔹 Entry Zone:
$0.95 (critical horizontal support & pot

ONDO looking bullish As of now ONDO looking so nice for LONG position for the next few days. NFA/DYOR

ONDO USDT LONG TRADE SETUPONDO is currently taking support at a strong support zone, with a high probability of an upward price move. Additionally, the 200 EMA is acting as strong support during the retest.

See all ideas
Summarizing what the indicators are suggesting.
Oscillators
Neutral
SellBuy
Strong sellStrong buy
Strong sellSellNeutralBuyStrong buy
Oscillators
Neutral
SellBuy
Strong sellStrong buy
Strong sellSellNeutralBuyStrong buy
Summary
Neutral
SellBuy
Strong sellStrong buy
Strong sellSellNeutralBuyStrong buy
Summary
Neutral
SellBuy
Strong sellStrong buy
Strong sellSellNeutralBuyStrong buy
Summary
Neutral
SellBuy
Strong sellStrong buy
Strong sellSellNeutralBuyStrong buy
Moving Averages
Neutral
SellBuy
Strong sellStrong buy
Strong sellSellNeutralBuyStrong buy
Moving Averages
Neutral
SellBuy
Strong sellStrong buy
Strong sellSellNeutralBuyStrong buy
Displays a symbol's price movements over previous years to identify recurring trends.