Will #OP Finally Explode or Is This Just Another Trap for Bulls?Yello, Paradisers! Is #Optimism gearing up for a breakout, or is this the final squeeze before bulls get dumped on hard? Let’s dissect what’s really happening on #OPUSDT:
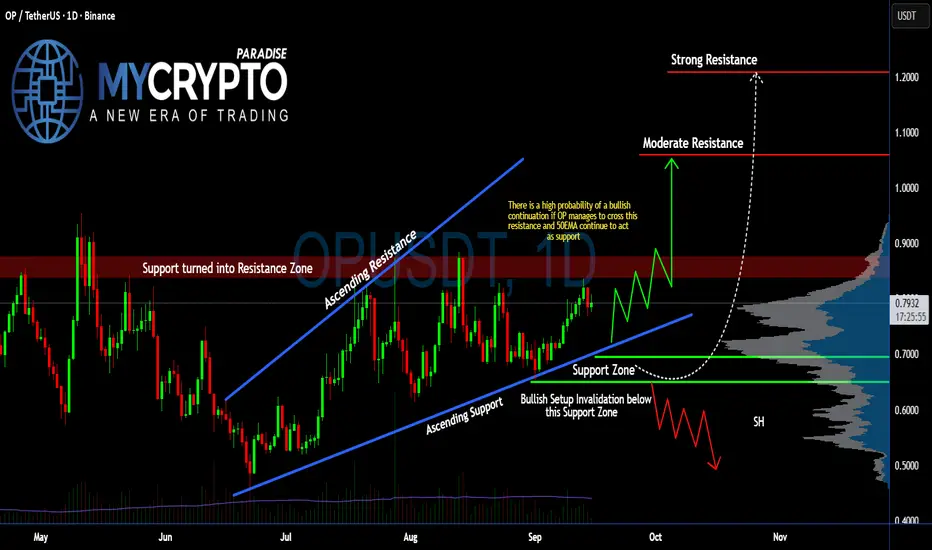
💎After forming a clean ascending channel since mid-June, #OP has been respecting both the ascending support and ascending resistance zones. Price is currently sitting just below the key resistance zone around $0.83–$0.85, which was previously a support level before flipping into strong resistance. This makes it a major decision point for the next move.
💎If #OPUSD manages to break and close above the $0.85 resistance area with strong volume, and the 50EMA continues to hold as dynamic support, then we’re likely to see a push towards the moderate resistance around $1.059. If that level is cleared, the next logical upside target sits near $1.20, aligning with the strong resistance and peak on the volume profile.
💎As long as price holds above the Support Zone between $0.69 and $0.65, the bullish case remains valid. The structure continues to print higher lows, showing that buyers are defending the trendline support. A successful retest here could lead to a powerful bullish continuation.
💎However, if bulls lose control and #OPUSDT closes below the $0.650 support, the entire bullish setup would be invalidated. In that case, price could slide down toward the $0.50–$0.55 zone, especially if volume dries up. This would complete a potential head-and-shoulders pattern and trigger a shift toward a bearish structure.
Stay patient, Paradisers. Let the breakout confirm, and only then do we strike with conviction.
MyCryptoParadise
iFeel the success🌴
Market insights
OP Secondary trend. Wedge. Reversal zones. 17 04 2025From the wedge breakout, the price reached the level of 2.857 (81%) and from it the trend reversal under the general trend of altcoins, breaking through the "neck" zone of the head and shoulders, thereby realizing this pattern on a large scale and reaching the reversal zone of the minimums of the level of 0.509. We went down to the range below along the fan. Consolidation above the dynamic support opens up the potential for movement to its resistance, I specifically put another meridian, as from it with a high degree of probability, even with the implementation of the bullish potential, there will be a significant pump / dump rollback. It just intersects with the previous consolidation of support, which in this case acts as resistance (those who previously bought in this zone will sell, thereby going into breakeven and stimulating the stop of the impulse and a rollback (logical probability).
Locally, again having formed on the fall, as before, a descending wedge in the secondary trend. It has not yet been fully formed, the price is not clamped. But, conditionally, the price is at the minimum zone. You can start gaining from the average price, or work on a breakthrough of the formation, observing risk and money management. If you are scared (it is always like this at the minimum zone) - then everyone is the same, and most refuse to buy, but willingly buy when the price is already expensive.
A breakthrough of this wedge is a corrective upward movement to the mirror resistance zone of the previous consolidation (highlighted in gray), if in general, a "revival of faith" is observed in alts.
Also after breakout of the wedge, if the market as a whole is bearish on alts, then they will make a cut (in this case, a repeated set) at the zone of minimums in a wide range of price slippage and the complete death of faith in the candy wrapper of "crypto whales", highlighted in green.

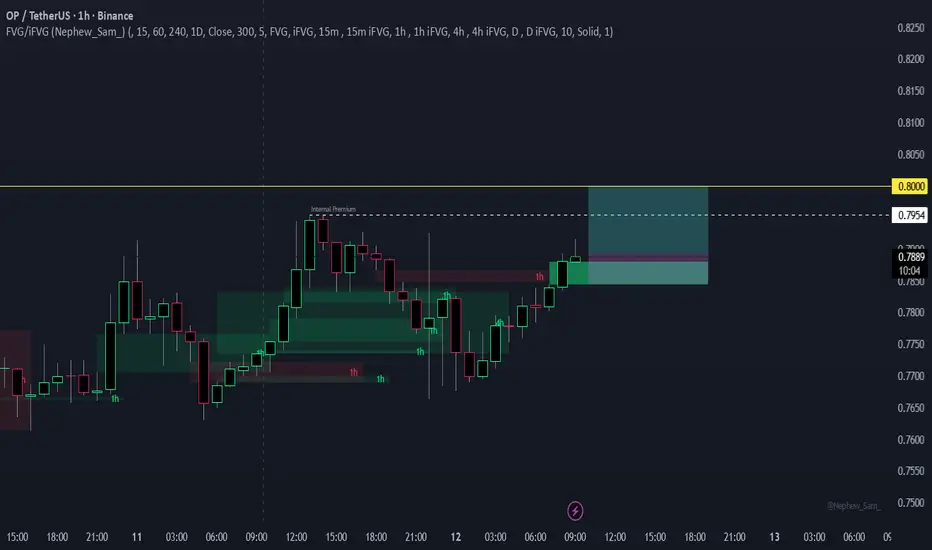
OP/USDT High Probability IMPULSE-SHIFT 1HR Time-frameAn impulse shift happens when price trades into an old imbalance (FVG) and then displaces in the opposite direction.
Here, price tapped the prior bearish FVG (red box).
Instead of breaking lower, it rejected → confirming that FVG as “consumed.”
A new bullish FVG (green box) was formed on the move away.
This shift signals a potential change in order flow: bearish leg → bullish continuation.
As long as price respects the bottom of the new green FVG, bullish bias remains valid.
🚩 Invalidation: If the supporting FVG breaks with a clear breakaway candle, this setup is void.
OP/USDT 30m time-frame FAILUR SWINGOP/USDT · 30m
Price has printed a Failure Swing — momentum stalled before retesting its own prior high.
This has produced a Bearish Breakaway Candle, leaving behind a Bearish FVG while at the same time disrespecting the prior Bullish FVG.
🔻 Bias: Bearish continuation favored.
🚩 Invalidation: A clean break through the Bearish FVG with a strong breakaway candle cancels this setup.

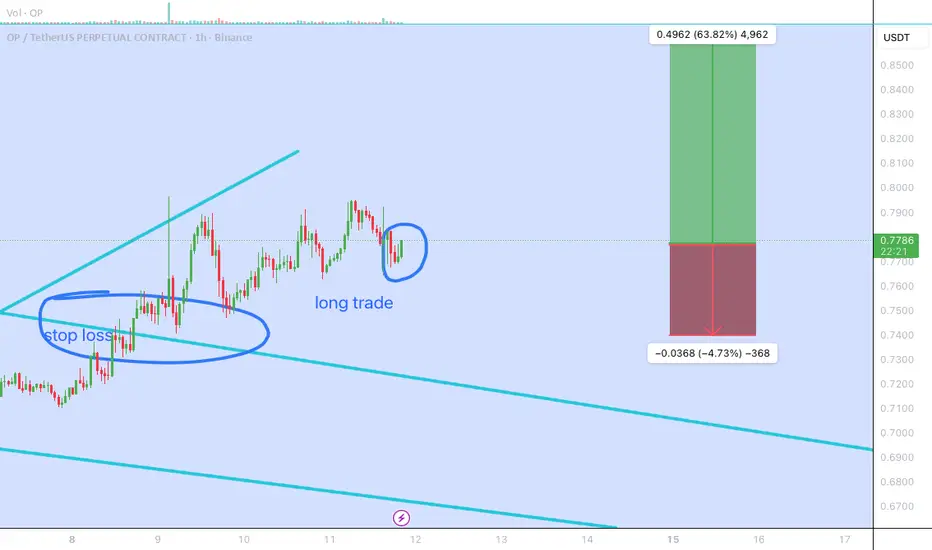
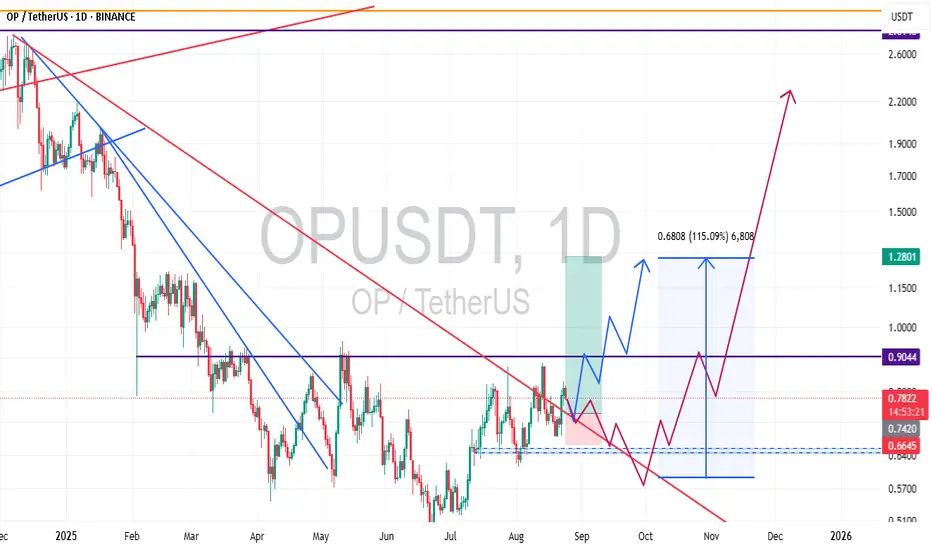
OP long ideaLong trade 0.77
Stop loss 5%
Take profit 63%
1. 1 Week chart analysis. Ghann Fann shows the correction is finished and the price should be moving upwards.
2. Head and Shoulders Pattern on 1 week and 1 day chart. Take profit price based on this pattern.
3. 1 hour chart shows trend lines and stop loss on retest level.
OP - following the plan! NASDAQ:OP - following the plan nicely 📈
1000% accuracy since almost 1 week 🔥

OP - Bullish structure medium term NASDAQ:OP - Inverse H&S structure spotted - Bullish medium term 📈
Pump potential:
70%+ 🚀
Key demand zone to be maintained:
0.6300 - 0.6150$
Weekly resistances;
0.8150 - 0.9250 - 1.060 - 1.00 - |1.180 - 1.20| - 1.380 - 1.600$

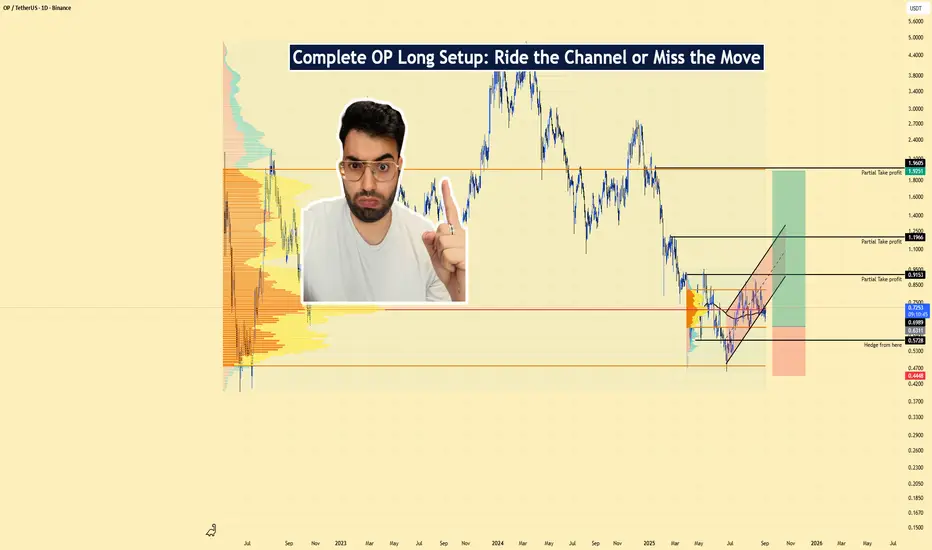
OPUSDT | Long Setup | Unlock Overhang | Sep 3, 2025📌OPUSDT | Long Setup | Ascending-Channel Reclaim vs. Unlock Overhang | Sep 3, 2025
🔹 Thesis Summary
OP is basing after a deep drawdown while price grinds higher inside a rising channel. With >50% of supply already unlocked and TVL near $500M supporting 97 protocols (UNI, SNX, VELO), the risk/reward favors a defined-risk long into resistance reclaim.
🔹 Trade Setup
Bias: Long
Entry Zone: $0.68 – $0.75 (pullbacks into channel support/VWAP cluster)
Stop Loss (invalidation): $0.5728 (loss of channel + “hedge from here” level)
Hard Backstop (catastrophic): $0.4468
Take-Profits:
TP1: $0.9153
TP2: $1.1956
TP3 / Max: $1.9525 – $2.00
Indicative R:R from $0.715 midpoint → $0.5728 stop:
TP1 ≈ 1.41x, TP2 ≈ 3.38x, TP3 ≈ 8.70x.
🔹 Narrative & Context
Structure: OP reclaimed a higher-low structure inside a clean ascending channel. Volume profile shows acceptance in the $0.60–$0.75 band; above $0.80–$0.92 sits a low-resistance pocket into $1.20, then the prior breakdown shelf near $1.95–$2.00.
Sector positioning: As an Ethereum L2 using optimistic rollups, Optimism inherits L1 security while offering cheaper throughput—key into any ETH-led rotation.
Seasonality/performance context: 2023 delivered a late-year impulse (~+301%), while 2024–2025 have been distribution years (~-56% / -61% YTD). Mean path favors relief rallies when flows return; average path sits near ~4%.
Tokenomics & unlocks (supply map): ~50.33% of OP is unlocked; Core Contributors ~33.35%, Future Airdrops ~24.57%, Ecosystem funds ~25%. Unlocks continue toward 2026—supply overhang is known and increasingly priced.
Where this fits technically: The chart’s labeled targets ($0.915 / $1.196 / $1.953) line up with prior HVNs/inefficiencies. Keeping risk below $0.5728 respects the current value area.
🔹 Valuation & Context
MC/TVL ≈ 3.1x (Unlocked Mkt Cap ~$1.55B ÷ TVL ~$0.50B) → Market pays ~$3 for each $1 secured on OP → Reasonable if TVL and sequencer revenues expand with an ETH up-cycle → Supports a re-rating toward prior shelves.
Inflation ≈ 2% / yr → Predictable dilution vs. many higher-emission assets → Puts focus on unlock schedule rather than ongoing issuance → Aligns with staged take-profits.
Unlock Progress ~50% → Overhang persists but more than half is circulating → Weakens marginal unlock impact over time → Favors buying liquidity sweeps into support rather than chasing breakouts.
🔹 Contrarian Angle (Your Edge)
Consensus fixates on unlock supply and the 2024–2025 drawdown. The structure + acceptance above $0.68 argues the overhang is largely priced. If ETH volatility compresses then expands upward, OP can revisit $0.92 / $1.20 quickly and test $1.95–$2.00 on a broader L2 rotation.
🔹 Risks
Unlock overhang / treasury distribution timing compresses rallies.
Sector rotation away from L2s toward alt-L1s or BTC dominance.
ETH beta risk: ETH weakness or elevated gas stagnates activity/revenues.
🔹 Macro Considerations
Track BTC/ETH trend, ETH volatility regime, and risk-on breadth.
Flows & incentives: Any L2 incentive programs or airdrop cycles can accelerate TVL/usage.
Calendar: Monitor OP unlock dates and major ETH events; fade into those if positioning is crowded.
🔹 Bottom Line
This is a defined-risk long into a constructive channel with clearly mapped targets. Supply risks are known; structural reclaim plus sector beta argues for measured exposure and staged exits. Above $0.92, momentum can extend toward $1.20 and potentially $1.95–$2.00.
🔹 Forward Path
If this post gains traction, I’ll follow up with: weekly structure map, confirmation triggers above $0.92, and updates around unlock windows.
Like & Follow for structured ideas, not signals. I post high-conviction setups here before broader narratives play out.
⚠️ Disclaimer: This is not financial advice. Do your own research. Charts may include AI-assisted visuals.
🔹 Footnote
Forward P/E: Price divided by expected earnings over the next 12 months. Lower = cheaper relative to profits.
P/FCF (Price-to-Free-Cash-Flow): Price vs. the cash left after investments. A measure of efficiency.
FCF Yield: Free cash flow per share ÷ price per share. Higher = more cash returned for each dollar invested.
ROE (Return on Equity): Net income ÷ shareholder equity. Shows management efficiency with investor capital.
ROIC (Return on Invested Capital): Net income ÷ all invested capital (equity + debt). A purer profitability gauge.
Debt/Equity: Debt divided by equity. <1 usually means balance sheet is conservative.
R:R (Risk-to-Reward): Ratio of expected upside vs. downside. 3:1 = you risk $1 to make $3.
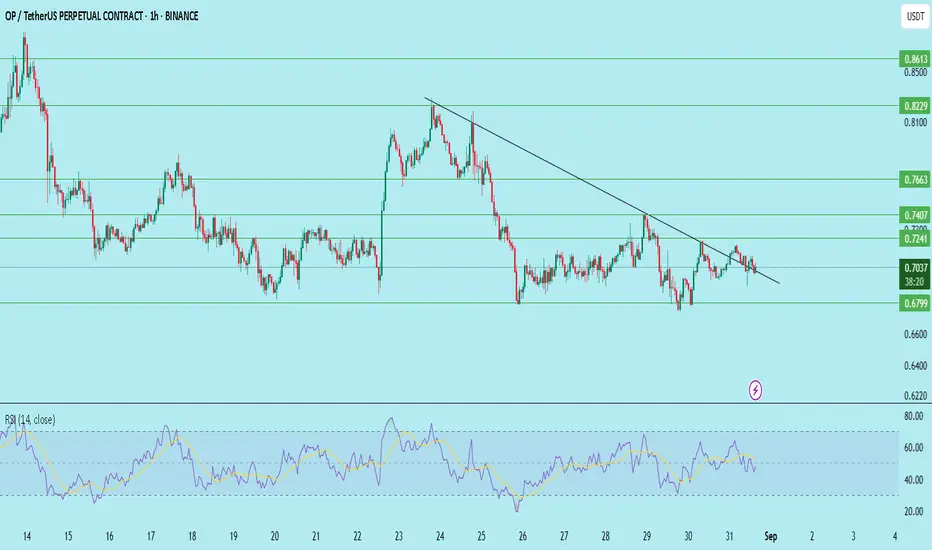
OP/USDT Accumulation in Progress !!Currently, OP is testing the descending trendline while holding above the demand zone at 0.6860–0.6721. RSI sits near neutral (49), suggesting that the next move could determine whether the breakout occurs or further downside is seen.
Trade Plan (Long Setup):
Entry Zone: CMP (0.7050) → down to 0.6860
Stop Loss: 0.6721 (below demand zone)
Targets:
0.7240
0.7407
0.7663
0.8229
Expected Profit: ~16% to the extended target
Insights:
Break above 0.7240 confirms bullish continuation.
Losing 0.6721 invalidates the setup, opening downside risk.
RSI divergence is possible if the price retests 0.6860 and bounces strongly.
DYOR | Not Financial Advice

crypto pair opusdt Greetings dear friends
I have two predictions for the OP currency that you see in the picture
I hope they come true and friends will use them
OP SWING LONG SETUP!Summary / bias
- Bias: cautiously bullish (swing long) while price respects the 0.67–0.76 buy zone and shows confirmation on the weekly timeframe. ⏰✅
- Context: after 21 weeks in a range, price is attempting a breakout from the OP range — a logical place for swing entries if the breakout holds.
Entry / setup
- Buy area: 0.67–0.76 — considered a tactical buying zone on a retest or within-range entry. 💶/💵
- Preferred trigger: weekly candle close within or above the buy zone with supporting momentum (better) — otherwise consider scaling in or waiting for confirmation.
Invalidation / stop
- Invalidation level: weekly close below 0.4606. Use this to define your hard stop and position size so risk per trade matches your rules. ❌⚠️
- Note: invalidation is “weak” (large distance) — size positions accordingly and consider smaller allocation or staggered entries.
Targets / profit-taking
- Primary TPs (take partial profits at each):
- TP1: 0.95 🎯
- TP2: 1.35 🎯
- TP3: 1.93 🎯
- TP4: 2.65 🎯
- Moongbag zone (longer-term hold): 4.00–4.25 — strong supply zone for very long-term exposure or leftover position. 🌙💰
Trade plan (simple)
- Entry: buy within 0.67–0.76 (or wait for weekly confirmation above this area).
- Stop: below weekly close 0.4606 (set based on your risk tolerance).
- Exits: scale out at TPs listed above; consider trailing stops after TP2 to protect profits.
- Position sizing: because invalidation is far, size so the dollar risk is acceptable (e.g., 1–2% of account per trade).
Confirmation checklist (before committing)
- Weekly close in/above buy zone? ✅
- Momentum supporting the move (RSI rising, bullish candle structure)? ✅
- Volume (or other flow metrics) supportive on breakout/retest? ✅
Risks / things to watch
- False breakout: after 21 weeks of range, expect chop and possible pullbacks — rejection at the buy zone or higher resistance can occur.
- Macro/news: large events can trigger whipsaws — avoid entering right before high-impact data if you can.
- Wide invalidation: keep position size conservative because stop is distant.
- Use discipline: scale into positions if unsure, take partial profits at each TP, and trail stops to protect gains.
Final note
- This is a viable swing-long edge while price respects the 0.67–0.76 area and weekly confirmation occurs. Trade wisely, manage risk, and adapt if price structure changes. Good luck, traders! 🍀📈
Please follow your strategy and updates; this is just Our Idea, and We will gladly see your ideas in this post.
Please do not forget the ✅' like'✅ button 🙏😊 & Share it with your friends; thanks, and Trade safe.
BYBIT:OPUSDT

OP/USDT Analysis (1D Chart)
⸻
OP is consolidating inside a symmetrical triangle after a long downtrend from the $2.5 zone.
• Support levels:
• Key support: $0.75 – $0.80
• Major support: $0.468 (if lost, deeper correction possible)
• Resistance levels:
• Immediate resistance: $0.90 – $1.00
• Strong resistance: $1.25
• RSI (14D):
Currently neutral around 50–55.
• Break above 60 → bullish momentum confirmation
• Drop below 40 → bearish continuation
📌 Scenarios:
• Bullish: Break and close above $0.90 – $1.00 could target $1.25.
• Bearish: Losing $0.75 may push price toward $0.468.
⸻
⚠️ Not financial advice. DYOR.
⸻
میخوای برات یک نسخهی خیلی کوتاه و جمعوجور هم آماده کنم که بیشتر شبیه ایدههای منتشر شده در TradingView باشه؟

OP Breakout Alert!🚨 NASDAQ:OP Breakout Alert! 🚨
NASDAQ:OP is currently testing the red resistance zone 🔴
If price breaks out, the first target will be the green line level 🎯
A confirmed breakout would signal bullish continuation and open the door for further upside ✅


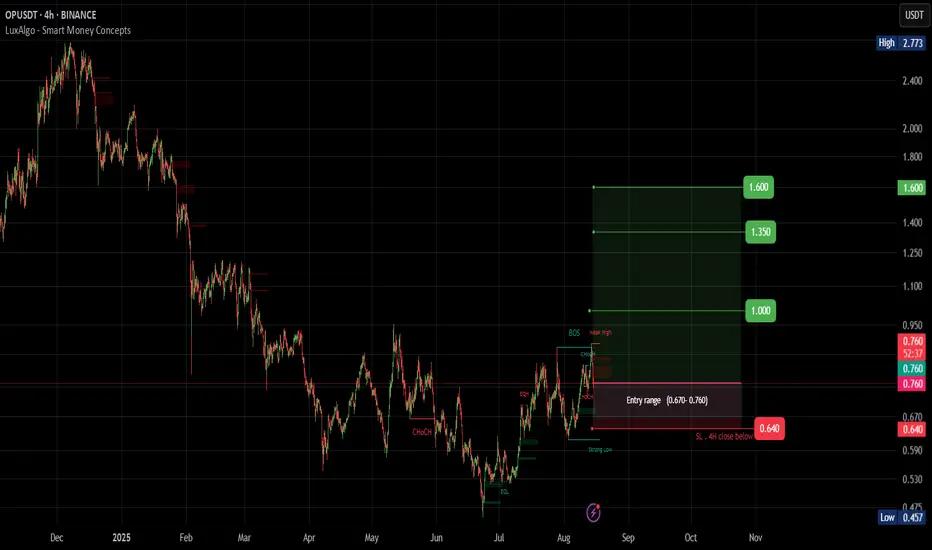
#OP (SPOT)BINANCE:OPUSDT
#OP/ USDT
Entry range (0.670- 0.760)
SL 4H close below 0.640
T1 1.000
T2 1.350
T3 1.600
_______________________________________________________
Golden Advices.
********************
* collect the coin slowly in the entry range.
* Please calculate your losses before the entry.
* Do not enter any trade you find it not suitable for you.
* No FOMO - No Rush , it is a long journey.
#OP/USDT#OP
The price is moving within a descending channel on the 1-hour frame, adhering well to it, and is heading for a strong breakout and retest.
We are seeing a bounce from the lower boundary of the descending channel, which is support at 0.653.
We have a downtrend on the RSI indicator that is about to be broken and retested, supporting the upward trend.
We are looking for stability above the 100 moving average.
Entry price: 0.702
First target: 0.757
Second target: 0.805
Third target: 0.865

#OP/USDT#OP
The price is moving within a descending channel on the 1-hour frame and is expected to break and continue upward.
We have a trend to stabilize above the 100 moving average once again.
We have a downtrend on the RSI indicator that supports the upward move with a breakout.
We have a support area at the lower limit of the channel at 0.600, acting as strong support from which the price can rebound.
Entry price: 0.616
First target: 0.630
Second target: 0.641
Third target: 0.658

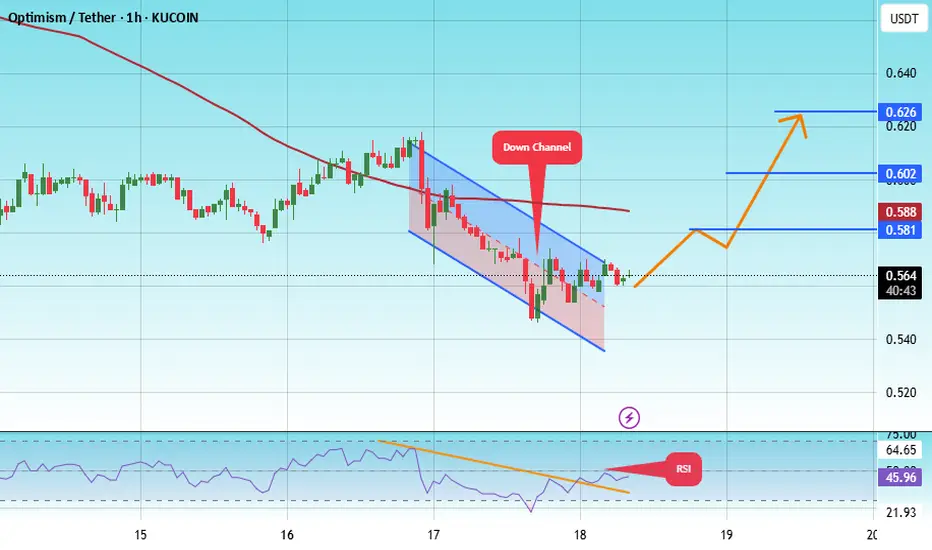
#OP/USDT#OP
The price is moving within a descending channel on the 1-hour frame, adhering well to it, and is heading toward a strong breakout and retest.
We are experiencing a rebound from the lower boundary of the descending channel. This support is at 0.544.
We have a downtrend on the RSI indicator that is about to be broken and retested, supporting the upward trend.
We are heading toward stability above the 100 moving average.
Entry price: 0.564
First target: 0.581
Second target: 0.602
Third target: 0.626
1d OP - Long setupToday I set up a low lev (2x) long with a 7:1 rr on BINANCE:OPUSDT
Reason being that it seems to have bottomed out. fairly close to the VAL and POC. both are at 50 cent and 55 cent respectively. I'd consider adding a little margin IF it comes close to that area. around 48/49 cents I'd consider myself out. my target is 4.50, possibly 78.6 fib at around 4 dollars I'll take some out, but the past ATH of 4.50 should be possible imho.
currently the marketcap is at roughly over 1 billion. to shoot it towards 10 billion is not a big stretch.
currently it followed a downtrend since the last ATH in march 24. possible reaction/rejection once more around that touchpoint. with enough volume and the correct sentiment in the market, I see it push through and retest before going towards VAH at 2.06 and the 50% fib at 2.66.
all things considered, I'll take the chance.

OP - Chance for +70%After weekly close we can see the volume coming in. On the chart we have resistance which if we break through then we can expect price 1.4 which is +70% from now.
If I have some advice for leverage trading I think its better to wait for daily close and then hunt retest if happens.
Rotations of money started already and I don't think is it a case for long run. We need to act, take profit and watch something else.
Like if you like analysis and idea.
Ivan

TradeCityPro | OP Eyes Breakout in Prolonged Altseason Range 👋 Welcome to TradeCity Pro!
In this analysis, I want to review the OP coin for you — one of the Layer 2 projects whose token currently holds a market cap of $1.39 billion and is ranked 68th on CoinMarketCap.
📅 Daily Timeframe
On the daily timeframe, OP is moving within a range box between 0.521 and 0.920, which formed after a downtrend, and the price has been fluctuating in this box for several months.
🔑 One key resistance on this coin is 0.816, which can be used as a trigger for a long position.
📈 This trigger can also be used for spot buying, but given its Bitcoin pair, I prefer to take the position in futures and reserve spot buys for future triggers.
💥 For momentum confirmation of this position, we can use RSI’s entry into the Overbought zone, since RSI is currently near this area, and if it enters, it could support a strong upward move.
📊 The next long trigger is the breakout of 0.920. However, this trigger is not valid at the moment because the price hasn’t reacted to it for a long time, and in the future, if it does react, the level will likely change. In that case, I’ll update the analysis and give you the new trigger.
✔️ If OP declines, the first important support we have is 0.626. A close below this level could allow for a risky short position, but for shorts, I’ll personally wait for a break below 0.521.
📝 Final Thoughts
Stay calm, trade wisely, and let's capture the market's best opportunities!
This analysis reflects our opinions and is not financial advice.
Share your thoughts in the comments, and don’t forget to share this analysis with your friends! ❤️

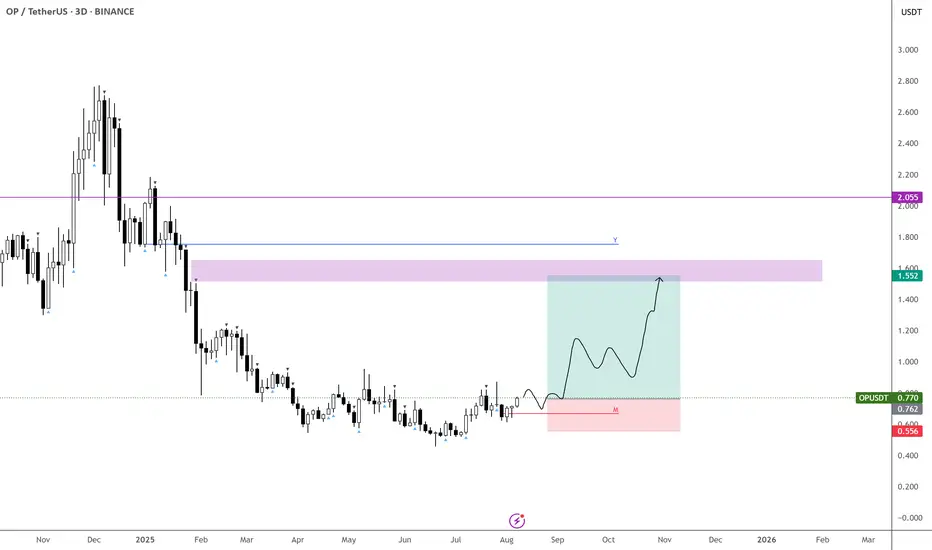
$OP – One to Keep in the Basket
Liking the structure here — the 3day chart is on the verge of triggering a bullish signal, so I’m getting in early with some buys here.
If price dips into $0.66 or $0.55, I’ll be adding more.
Targeting the FVG just below the yearly open for this move. BINANCE:OPUSDT