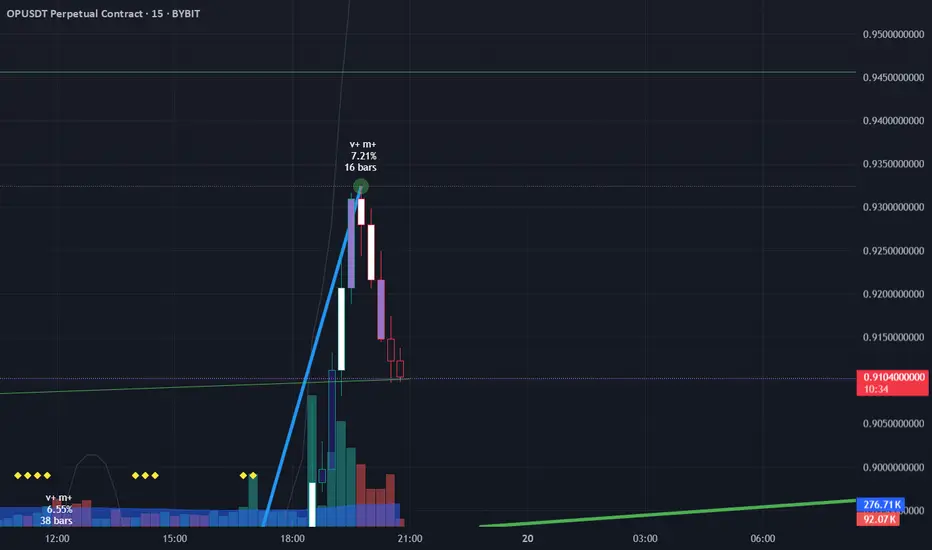
LONG OP OP rise more than others in my bookmarks
HIgh volumes and moves.
Porbably target end in dayly SAR - 0,948
OPUSDT trade ideas
DO YOU BUY ASSETS USING DCA LIKE THIS?DO YOU BUY ASSETS USING DCA LIKE THIS?
First, you can see that OP (case study) entered a downtrend after hitting its peak on the monthly (M) timeframe around the $4 price zone.
Uptrend period: from 2022 to 2024
Downtrend period: from 2024 to now (no clear sign of the decline stopping or accumulation yet)
With a DCA (Dollar-Cost Averaging) strategy, you’d definitely be buying on the right side of the chart, meaning the price decline zone. "No buying in the red, so what’s there to sell in the green?" This means that during the price drop, you’d use certain tools to "justify buying," like a trendline forming during the decline, a support level below, or on-chain data showing buyers starting to dominate, and so on.
And surely, you’d end up buying a lot in the $1.6–$2.3 range because that’s where you’d see those "solid" signals you thought of earlier. Unfortunately, the price kept dropping below $1, then $0.9, and now it’s at $0.7… and it’s still going lower. At this point, you’ve run out of funds to keep DCA-ing into OP.
Have you ever stopped to ask yourself: Why is the price dropping like this? Where’s that "solid" trendline? Where’s the "strong" support? Where did all those buyers from the on-chain data go?
Now, let’s move to a hypothetical scenario:
First, let’s say you bought at the right price, like $0.7, and at this point, the price stops dropping.
But it’s not until 2027 that OP starts a new uptrend wave on the monthly (M) timeframe.
Condition (1) means you got the price right, but condition (2) hasn’t happened yet. Your asset might be at a good price, but the timing isn’t right. You’d have to hold this asset until 2027, as per this hypothetical situation, for it to actually turn a profit.
That means for the next two years, your capital just sits there quietly. Even if the broader market enters an uptrend, your asset stays flat.
So, you’re not losing in terms of asset value, but you’re losing in terms of opportunity cost—wasting time on it.
Whether this hypothetical scenario comes true or not, it’s just an illustration of how I’d approach this kind of problem for you all.
Read it, feel it, and share your thoughts if you find it helpful, okay?
Wishing you a peaceful weekend with your family!


OPUSDT 4DOP ~ 4D Analysis
#OP Place two purchases at this support level, with a short -term target of at least 20%+.
This is a key support that needs attention.

#OP/USDT#OP
The price is moving in a descending channel on the 1-hour frame and is adhering to it well and is heading to break it strongly upwards and retest it
We have a bounce from the lower limit of the descending channel, this support is at a price of 0.834
We have a downtrend on the RSI indicator that is about to be broken and retested, which supports the rise
We have a trend to stabilize above the moving average 100
Entry price 0.909
First target 0.939
Second target 0.992
Third target 1.054

#OP/USDT Analysis📉 NASDAQ:OP swept swing low liquidity and bounced hard, now holding the 4H IFVG.
🔹 Looking for a PDL sweep & a tap into the bottom 4H FVG before a bounce towards PWH $1.2163.
👀 Spotting long opportunities from here!

OPUSDT UPDATEOPUSDT is a cryptocurrency trading at $2.000. However, the target price is unusually lower at $0.600, which seems incorrect. Typically, a target price is higher than the current price. Assuming the target price is actually higher, the potential gain would be significant. The pattern is a Bullish Falling Wedge, a reversal pattern signaling a trend change. This pattern suggests the downward trend may be ending. A breakout from the wedge could lead to a strong upward move. The Bullish Falling Wedge is a positive signal, indicating a potential price surge. Investors are optimistic about OPUSDT's future performance. The current price may be a buying opportunity. Reaching the corrected target price would result in significant returns.

OPUSDT → There's still a chance for an alt seasonBINANCE:OPUSDT is showing positive momentum relative to what bitcoin has put up this night. The coin is in consolidation and testing trend resistance
The main reason for the lack of an altcoin season is bitcoin's huge dominance of the cryptocurrency market. The fall of BTC (open channel to 75K) and further growth after the formation of an intermediate bottom in the 75-80K zone may reduce the dominance phase, which in general will give a chance to the altcoin market, which is going through bad times.
I like OP in the fact that it is not falling in the wake of the flagship, but stands in consolidation, where we have clear boundaries for strategy formation. Focus on resistance: 1.212.
Resistance levels: 1.212
Support levels: 1.044, 0.983
Thus, a break of the resistance at 1.212 could trigger a rally and an attempt to change the trend.
It may happen after correction to 0.5 fibo, or after formation of pre-breakdown consolidation on H1-H4.
The structure of the setup will be broken if the coin starts to break 1.044-0.983.
Regards R. Linda!

what will OP look like in 2025?"Does OP have the other side?
Currently, OP is on the downward slope of the M cycle. Could the larger cycle allow OP’s chart to have the other side of the M?
If it does, then the bottom-catching zone is indeed below. If not, will it continue to move sideways (SW) and wait?
So, what will OP look like in 2025?"

OP 1W (Optimism)NASDAQ:OP 1W;
OP has spent almost all of its time below the EQ level since its existence.
There is a noticeable mismatch on the RSI side. It is difficult to say how much time is left before the rise, but upward movements are experienced in the continuation of such incompatibilities.
#op #optimism

OP/USDTKey Level Zone: 1.13200 - 1.13900
HMT v6 detected. The setup looks promising, supported by a previous upward/downward trend with increasing volume and momentum, presenting an excellent reward-to-risk opportunity.
HMT (High Momentum Trending):
HMT is based on trend, momentum, volume, and market structure across multiple timeframes. It highlights setups with strong potential for upward movement and higher rewards.
Whenever I spot a signal for my own trading, I’ll share it. Please note that conducting a comprehensive analysis on a single timeframe chart can be quite challenging and sometimes confusing. I appreciate your understanding of the effort involved.
Important Note :
Role of Key Levels:
- These zones are critical for analyzing price trends. If the key level zone holds, the price may continue trending in the expected direction. However, momentum may increase or decrease based on subsequent patterns.
- Breakouts: If the key level zone breaks, it signals a stop-out. For reversal traders, this presents an opportunity to consider switching direction, as the price often retests these zones, which may act as strong support-turned-resistance (or vice versa).
My Trading Rules
Risk Management
- Maximum risk per trade: 2.5%.
- Leverage: 5x.
Exit Strategy
Profit-Taking:
- Sell at least 70% on the 3rd wave up (LTF Wave 5).
- Typically, sell 50% during a high-volume spike.
- Adjust stop-loss to breakeven once the trade achieves a 1.5:1 reward-to-risk ratio.
- If the market shows signs of losing momentum or divergence, ill will exit at breakeven.
The market is highly dynamic and constantly changing. HMT signals and target profit (TP) levels are based on the current price and movement, but market conditions can shift instantly, so it is crucial to remain adaptable and follow the market's movement.
If you find this signal/analysis meaningful, kindly like and share it.
Thank you for your support~
Sharing this with love!
HMT v2.0:
- Major update to the Momentum indicator
- Reduced false signals from inaccurate momentum detection
- New screener with improved accuracy and fewer signals
HMT v3.0:
- Added liquidity factor to enhance trend continuation
- Improved potential for momentum-based plays
- Increased winning probability by reducing entries during peaks
HMT v3.1:
- Enhanced entry confirmation for improved reward-to-risk ratios
HMT v4.0:
- Incorporated buying and selling pressure in lower timeframes to enhance the probability of trending moves while optimizing entry timing and scaling
HMT v4.1:
- Enhanced take-profit (TP) target by incorporating market structure analysis
HMT v5 :
Date: 23/01/2025
- Refined wave analysis for trending conditions
- Incorporated lower timeframe (LTF) momentum to strengthen trend reliability
- Re-aligned and re-balanced entry conditions for improved accuracy
HMT v6 :
Date : 15/02/2025
- Integrated strong accumulation activity into in-depth wave analysis

Optimism Can Grow More Than 10X (~1180%)I've been always interested in this pair but something stopped me from taking the plunge. It was the chart structure. While it felt good and the potential was obvious, prices were too high and I knew a major correction was due before major growth.
Optimism (OPUSDT) looks different today.
The low that was hit very recently, 3-February, put prices at the same level as back in November 2022. The first bottom low after this pair started to trade.
OPUSDT hit a bottom in October 2022 and from this bottom grew to a high of some 666%. There was an initial b-wave corrected to a higher low and this higher low led to new a bullish-wave and then the major correction that ended earlier this month with a long-term higher low.
All gains have been removed. The long-term higher low opens the doors for a long-term higher high. This means a new All-Time High in 2025.
All the levels have been left visible on the chart. So you can choose what works for you.
We have more than 1,000% potential for growth being conservative. That's more than 10X.
Once the orange descending trendline is taken out, right side of the chart, we are in bullish territory. While the action happens within this trendline, the bullish bias is not confirmed.
It can take a few days just as it can take weeks for this condition to be met. This would be an irrelevant fact when we focus on the long-term.
For smart, long-term holders; buy and hold, the market will take care of the rest.
Your support is truly appreciated.
I'll be back soon with many more articles.
Thank you for reading.
Namaste.


OP, my notes for long-termwell, not much to say about this. I'm looking for this white and green lines and fib lines in the chart. And i think that prices are buying opportunities below that level.
not financial advices

OP / USDT: Gearing up for a breakout above Trendline resistance OP/USDT: Gearing Up for a Breakout Above Trendline Resistance
OP/USDT is shaping up for an exciting move 📈 as it approaches a critical trendline resistance zone 📊. The price has been consolidating tightly, creating the perfect setup for a potential breakout 💥. If the breakout happens, we could see a strong bullish trend unfold 🚀. Keep a close eye 👀 on this pair and wait for confirmation before acting.
Key insights:
1. Trendline resistance: OP/USDT is approaching a long-standing trendline that has previously acted as a barrier. A break above this could mark the start of a strong upward move.
2. Volume surge: Watch for a significant increase in trading volume during the breakout to confirm buyer strength 🔥.
3. Bullish signals: Momentum indicators like RSI and MACD are trending positively ⚡, supporting the case for a bullish breakout.
Steps to confirm the breakout:
Look for a clear 4H or daily candle closing above the trendline 📍.
A noticeable spike in volume during the breakout can signal strong buying activity 📊.
A retest of the broken resistance as a new support zone adds credibility to the move ✅.
Be cautious of fake breakouts, such as sharp reversals or wicks above the trendline ⚠️.
Risk management strategies:
Use stop-loss orders to manage your risk effectively 🔒.
Ensure position sizing aligns with your overall trading strategy 🎯.
This analysis is for educational purposes only and not financial advice. Always conduct your own research (DYOR) 🔍 before making investment decisions.

SHORT OP Days olumes been droped and 15 minutes volumes so small , looks like a dead cat jump formation
all predicted pumps are not succeded,
could be down squeeze

LONG OP it grow much fsater than others, jigh OI and and good reaction to fibo.
Probably nex candle going to be for gathering stops and then fast move opward

OP Low Resistance liquidity run ! First of all We have low resistance liquidity . we are expecting price to reach our mid term liquidity
In other hand if we run through that sibi that means we have strong bullish trend
Keep it simple just like that


OPUSDTVery high quality trade the stop is clear also the stop it is weekly fram so it will take some time

OP Spot Position (OP to break all time high??)OP USDT SPOT POSITION
This is the perfect chart.
We have a big ascending channel and we are on the lower part of it.
Requirements for SPOT position
We can wait for a retest inside the channel and then we buy spot position.
Or Buy now!
Buy at the Bottom and sell at the TOP is a must 🚀🤝
Targets
TP1 2.74 (Resistance Area)
TP2 4
TP3 5-7
SL Below recent low
This is a spot position so we don't care about leverage.
We dont panic sell in spot positions if we bought low!
Good luck!

OP/USDT Short Trade Setup Analysis (1D Timeframe - Binance)🔍 Market Context:
- OP/USDT has broken below an ascending trendline, indicating a potential trend reversal from bullish to bearish.
- The price is retesting the broken trendline as resistance, a common pattern before further downside movement.
- Recent price action has been bearish, forming lower highs and lower lows.
📊 Trade Entry Criteria:
- Entry aligns with a trendline retest rejection, signaling a failed attempt to reclaim the previous uptrend.
- Bearish price action confirms sellers stepping in at this level.
- The rejection is occurring near a previous support zone, which is now acting as resistance.
🎯 Trade Targets & Risk Management
- Entry Price: Around 1.412 - 1.487 USDT
- Stop Loss (SL): Above 1.596 USDT (above previous resistance)
- Take Profit (TP): 1.084 - 1.074 USDT (previous major support zone)
- Risk-to-Reward Ratio: Favorable short setup with R:R over 1:3
🛑 Stop-Loss Placement:
- Stop-loss is positioned above 1.596 USDT, ensuring protection against a fake breakout or bullish reversal.
📉 Profit Target Justification:
- The main target is the 1.084 - 1.074 USDT range, which aligns with a strong historical support level.
- If bearish momentum continues, a potential deeper drop toward 1.000 USDT could be possible.
📌 Summary
- Bearish breakdown below key trendline
- Retest rejection confirms sellers in control
- Clear risk-reward ratio (high probability short setup)
- Targets strong historical support levels for take profit
🔻 If price reclaims 1.596 USDT, the trade setup is invalidated, suggesting potential bullish recovery. Otherwise, continued downside is expected.

OP 4h - The last candleIf the last candle closes in a bearish breakout, %70 chance for a second leg down, if reverse, back to the previous high
