ORDI / USDT : Short term setupORDI is trading near a key demand zone with potential for a 10–15% upside.
Using a two-entry plan to manage risk, with a possible secondary entry around $3.86–$3.75 if price dips.
Target remains near $4.52 as long as structure holds.
Patience and confirmation are key.
Not financial advice.
Market insights

ORDI Weekly AnalysisORDI is currently trading at a major higher timeframe support zone after a prolonged downtrend.
This level has acted as support multiple times in the past, making it an important area to monitor for potential price reactions.
Market structure remains bearish on the higher timeframe, but downside momentum is slowing down and price is starting to consolidate.
Key levels to watch:
Support at the current range low
Resistance at the previous breakdown level
Higher timeframe resistance above, as marked on the chart
If price holds support and manages to reclaim resistance, continuation toward the next resistance levels becomes possible.
If price fails to hold support, consolidation or further downside cannot be ruled out.
This analysis is based on market structure and support and resistance levels.
No predictions, only scenarios.
All levels and scenarios are clearly marked on the chart.
Questions or comments are welcome in the comments below.
MrC


ORDIUSDT Forming Falling WedgeORDIUSDT is forming a clear falling wedge pattern, a classic bullish reversal signal that often indicates an upcoming breakout in crypto trading pairs like this one. The price has been consolidating within a narrowing range after a sharp downtrend, with recent lows around $7 suggesting that selling pressure is weakening while buyers are beginning to regain control near key support levels. With good volume confirming accumulation at these lower levels amid rising investor interest, the setup hints at a potential bullish breakout soon, especially as ORDI's ties to Bitcoin Ordinals and BRC-20 hype fuel renewed momentum. The projected move could lead to an impressive gain of 140% to 150%+ once the price breaks above the wedge resistance, turning recent corrections into explosive altcoin price action.
This falling wedge pattern is typically seen at the end of downtrends or corrective phases, and it represents a potential shift in market sentiment from bearish to bullish for ORDIUSDT. Traders closely watching this crypto pair are noting the strengthening momentum as it nears a breakout zone around $8.77, with technical indicators like RSI showing oversold bounces and fib retracement levels holding firm. The good trading volume adds confidence to this pattern, showing that market participants are positioning early in anticipation of a reversal, particularly with recent signals hitting take-profit targets and bouncing from ascending supports.
Investors’ growing interest in ORDIUSDT reflects rising confidence in the project’s long-term fundamentals, including its role in blockchain scalability and Ordinals adoption, alongside current technical strength in this falling wedge setup. As of early November 2025, trading activity spikes underscore real demand, making this a high-conviction opportunity for those hunting bullish reversal patterns in altcoins. If the breakout confirms with sustained volume, this could mark the start of a fresh bullish leg, with projections eyeing $16 to $21 zones for substantial medium-term gains as buying momentum accelerates.
✅ Show your support by hitting the like button and ✅ Leaving a comment below! (What is You opinion about this Coin) Your feedback and engagement keep me inspired to share more insightful market analysis with you!

ORDIUSDT 1DPay attention to the #ORDI daily chart — it’s moving within a falling wedge pattern and has bounced nicely from the wedge support. Volume has spiked noticeably. Consider buying around the current level and near the support zones at:
💰 $4.735
💰 $4.138
In case of a breakout above the wedge resistance and the daily SMA100, the potential upside targets are:
🎯 $8.066
🎯 $10.591
🎯 $12.632
🎯 $14.673
🎯 $17.579
⚠️ Always remember to use a tight stop-loss and maintain proper risk management.

Keep an eye on ORDIORDI writes data to individual satoshis as inscriptions, Still Bullish on Storage Narrative. It will follow ICP, FIL and AR, like our last setups

ORDIUSDT Approaching the Big Breakout! The End of the Downtrend?ORDI/USDT is now at one of its most crucial moments of 2025.
After a sharp rebound from the $3–$4 zone, the price is approaching the main descending trendline that has rejected every major rally for months.
This is a make-or-break zone — where the market will decide whether a major reversal begins or if this is just another bearish trap before continuation down.
---
🧩 Technical Structure
Main trend: Strong downtrend since early 2025, forming a clear series of lower highs and lower lows.
Primary resistance: The yellow descending trendline connecting all major peaks.
Key support zone: $3.1 – $4.8 (strong demand area).
Key resistances: $6.0 (current level), $10.5, $13, $20, and major resistance at $49–$53.
Volume note: The latest rebound shows a strong volume spike, signaling renewed buyer interest.
---
⚡ Bullish Scenario – “The Reversal Awakening”
If ORDI can close a daily candle above the descending trendline, it would mark the first true breakout of this long-term downtrend — a potential start of a major trend reversal.
Bullish triggers:
Daily close above $7–$7.5 with solid volume.
Retest of the breakout zone holding as new support.
Strong continuation candles confirming breakout momentum.
🎯 Bullish Targets:
1. $10.50 — first resistance and conservative target.
2. $13.00 — medium-term target.
3. $20.00+ — next major target if the breakout sustains.
📈 A confirmed breakout here would officially break the mid-term downtrend structure.
---
💀 Bearish Scenario – “False Break & The Trap Zone”
If ORDI fails to break above the trendline and forms a rejection candle (long upper wick), it could trigger another bull trap.
This would signal that bears are still in control, pushing price back toward lower supports.
Bearish confirmation signs:
Rejection candle at the trendline with high volume.
No follow-through in the next session.
🎯 Bearish Targets:
$4.8 → $3.8 (short-term correction zone).
If $3.1 support breaks, expect further downside continuation.
⚠️ Bearish invalidation: A confirmed daily close above the trendline (breakout).
---
🧠 Pattern & Sentiment
Current structure forms a descending resistance breakout setup — a potential reversal pattern after months of decline.
The sharp rebound with volume may indicate early accumulation.
Market sentiment is shifting, but confirmation is key before declaring a trend change.
---
🧭 Strategy & Risk Management
Conservative Approach:
Wait for a daily close above the trendline.
Enter on the successful retest (trendline becomes support).
Place stop below the previous swing low (~$4.0).
First target $10.5, then $13.
Aggressive Approach:
Early entry near $6.0–$6.2 (anticipating breakout).
Tight stop below $5.0.
Add on confirmation after breakout.
💡 Remember: Volume confirmation is the key to validating any breakout.
---
🔮 Epic Summary
ORDI stands at the edge of transformation.
After a year-long downtrend, it’s now testing the same trendline that has rejected every rally before.
A clean breakout could mark the beginning of a powerful bullish phase, while a sharp rejection would confirm that bears are not done yet.
This isn’t just another resistance — it’s the decision zone for ORDI’s next major move.
---
#ORDI #ORDIUSDT #CryptoAnalysis #TechnicalAnalysis #Altcoin #CryptoTrading #BreakoutSetup #TrendlineBreakout #SupportResistance #BullishScenario #BearishScenario #ChartAnalysis #CryptoCharts

$ORDI/USDT pessimistic outlook, I do not invest anymore.I have invested and made good money trading SEED_DONKEYDAN_MARKET_CAP:ORDI for a while. I have ridden the rise and sold at $69, missing the peak and feeling bad at the time.
Now my sentiment about SEED_DONKEYDAN_MARKET_CAP:ORDI is very bearish, and I will explain why I will stop trading it. Here are several events that have happened and are red flags:
1. SEED_DONKEYDAN_MARKET_CAP:ORDI was created in March 2023 by Domo, an enigmatic blockchain analyst; he just posted it on Github, and it was adopted by the team developing Bitcoin code. Binance launched it nobody knows why,
2. SEED_DONKEYDAN_MARKET_CAP:ORDI does not have a proper website. The founder didn't make money out of it and is not supporting it.
3. SEED_DONKEYDAN_MARKET_CAP:ORDI does not have an identified legal entity, no budget, no tokenomics, no roadmap, and no ecosystem.
4. SEED_DONKEYDAN_MARKET_CAP:ORDI now has RUNE (not the Thorchain CRYPTOCAP:RUNE ), which has a questionable name and seems to be a modification of BRC-20 to make money out of it. I personally think that it is shady.
So SEED_DONKEYDAN_MARKET_CAP:ORDI is a VERY HIGH investment risk, manipulated by Binance, with no team, and no future, to be honest. Worse, RUNE seems to be a takeover by Casey Rodarmor, a Bitcoin dev, and the name he has chosen is not compatible with any exchange because it already exists with a top 50 token that is older and succesful!
What the hell is going on?
I think that $95 is the all-time high for this coin for its lifetime, which will dump into oblivion before the end of this bull run, with no fundamental attached to it, I do not see what can save it.
Of course, I might be wrong; some magic could happen, and some pump might occur, but the signs of imminent death are already showing. It has dumped 66%, one of the worst performances of all the top 100 cryptos since its ATH. It is not recovering.
Conclusion: Be very careful with this coin. It has been short-lived and is probably in the process of dying.

ORDI , stink bidsGLP levels show the cmp is the bottom. but it seems we can get a very good discount at mid of the wick till fib levels marked in the chart. Considering the market un-certainity weekly candle close below 0.65 is the sl.
# NFA #DYOR

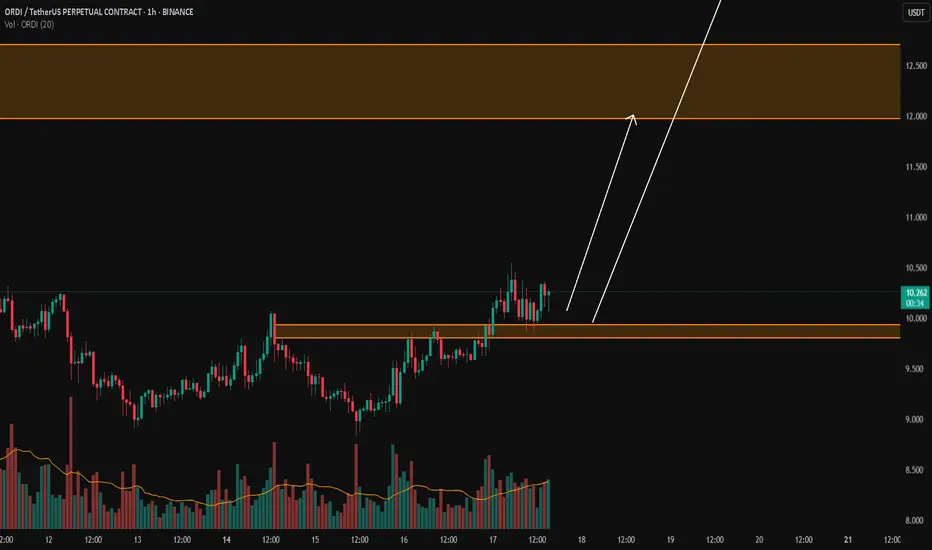
ORDI / USDT : Looking in a good momentum for a rallyORDI / USDT has bounced from strong support and is showing positive momentum. If this strength continues, we could see a bullish move towards $10 – $12 – $15 in the coming days.
Keep a close watch on momentum and manage risk wisely.
NOTE : Breakdown from support will invalidate this setup
ORDI / USDT : Looking for a price to bounce back from supportORDI is moving towards support for a possible retest. If it holds and we see a bounce, a strong move can follow with breakout targets at $12–$15. The key level to watch is this support – as long as it holds, the setup remains valid. A breakdown below will invalidate the setup.

ORDIUSDT 1D#ORDI is trading close to the descending trendline while also sitting near the ascending channel support on the daily chart.
If the price manages to bounce from the channel support and break above the descending trendline, potential upside targets are:
🎯 $11.267
🎯 $14.767
🎯 $17.595
🎯 $20.423
🎯 $24.450
🎯 $29.580
⚠️ Always remember to use a tight stop-loss and follow proper risk management.


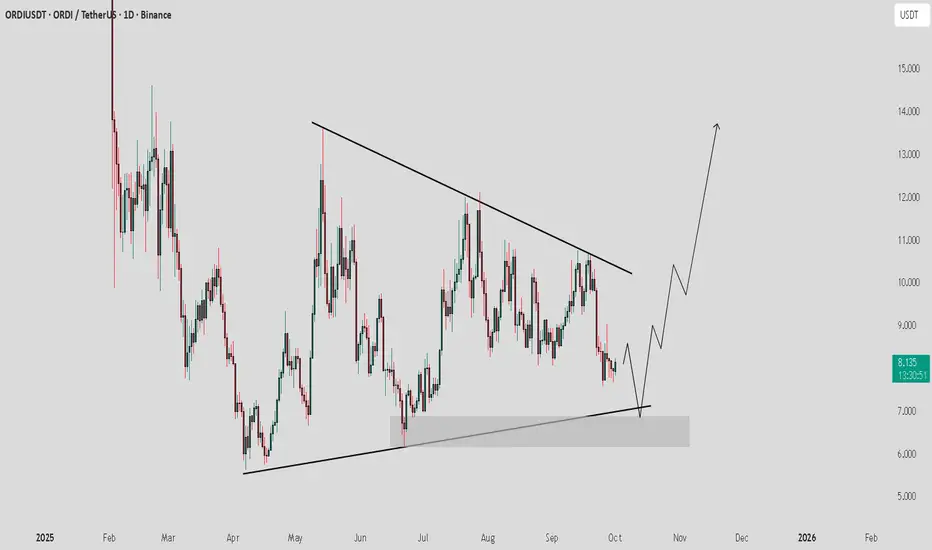
ORDI/USDT +200%Over the past two months, ORDI/USDT has been developing a bullish flag pattern, one of the most powerful continuation setups in technical analysis. Price has been consolidating tightly inside the flag, allowing momentum to reset while buyers maintain control.
With the pattern now nearly complete, ORDI looks ready to take off as soon as a breakout confirms. A strong push above the flag resistance would signal the start of the next impulsive leg higher, potentially unlocking significant upside.

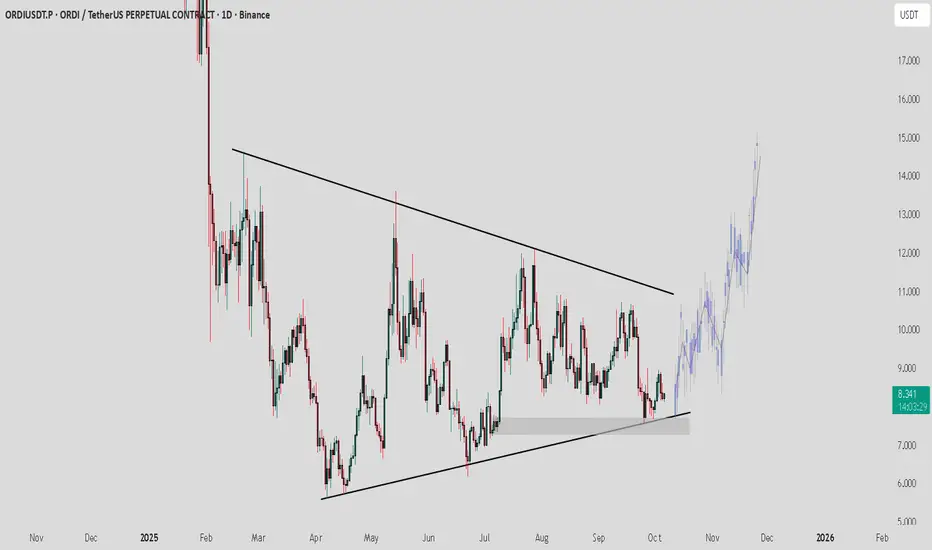
ORDI/USDT — Symmetrical Triangle: A Major Breakout?Currently, ORDI/USDT is consolidating tightly after a prolonged downtrend from the 52.880 peak. The chart is showing a symmetrical triangle, with a descending trendline pressing from above and a rising support line holding from below.
This pattern reflects a compression phase — volatility is narrowing, momentum is being stored, and a major breakout is likely to occur soon.
---
🔎 Pattern & Structure Details
Main trend: Long-term bearish since Dec 2024 (consistent lower highs).
Key support zone: 5.61 – 7.00 (highlighted yellow box), tested multiple times since April.
Key resistance zone: Descending trendline + horizontal resistance around 10.298.
Volatility: Shrinking significantly — the price is moving closer to the apex of the triangle, where breakouts usually happen with strong volume.
---
🟢 Bullish Scenario
1. Breakout confirmation: Daily close above 10.30 with high volume (clear break of descending trendline).
2. Initial targets: 11.58, then 13.17.
3. Extended targets (mid-term): If momentum continues, possible rally toward 20.43 – 23.38.
4. Risk Management: Place stop-loss below 8.0 or under the retest level in case of a false breakout.
---
🔴 Bearish Scenario
1. Breakdown confirmation: Daily close below 7.00 (falling out of the accumulation zone).
2. Initial target: 5.61 support.
3. If 5.61 breaks: Price could extend lower into the 4.0 – 5.0 psychological zone.
4. Risk Management: Stop-loss can be placed above 8.5 – 9.0 to avoid fake breakdowns.
---
⚖️ Conclusion
Neutral outlook until breakout: Symmetrical triangles are statistically neutral, but since it formed inside a broader downtrend, bearish continuation probability is slightly higher.
However, a breakout above resistance with strong volume could trigger a trend reversal and bring back mid-term bullish momentum.
Best approach: wait for confirmed breakout (daily close + volume) before taking positions.
---
ORDI is consolidating inside a symmetrical triangle. Key support zone: 5.61 – 7.00, key resistance: 10.30. The next breakout will set the direction:
🚀 Bullish: Break above 10.30 → targets 11.58, 13.17, even 20+.
🔻 Bearish: Drop below 7.00 → target 5.61, possibly 4.0.
Volatility is tightening — expect a big move soon. Trade with risk management, avoid FOMO.
#ORDI #ORDIUSDT #Crypto #PriceAction #Breakout #TechnicalAnalysis

ORDI/USDT (Perpetual Swap on OKX)📝 Trade Setup Explanation
Pair: ORDI/USDT (Perpetual Swap on OKX)
Timeframe: 2H (2-hour chart)
Indicators/Tools Used: Fibonacci retracement, support/resistance zones, RR box
📊 Technical Breakdown
Fibonacci Levels:
Price is holding near the 0.146–0.118 Fib zone (8.84–8.87).
This area acts as a support base after a retracement from recent highs.
Entry Zone:
Current entry around 8.80–8.84, which coincides with Fibonacci support.
Stop Loss (Risk):
Positioned at 8.01, just below the 0 Fibonacci level (8.45).
Gives room for volatility but invalidates setup if broken.
Take Profit (Reward):
Target near 10.08 (0.618 Fib level).
This aligns with a significant resistance zone where sellers may appear.
Risk-to-Reward Ratio:
Roughly 1:2, offering strong upside potential against controlled risk.
🎯 Trade Idea
Bias: Bullish (Long)
Entry: ~8.80
Stop Loss: ~8.01
Target: ~10.08
Reasoning: Price is sitting at key Fib support, presenting a bounce opportunity toward the 0.618 retracement resistance. Favorable RR setup for a swing trade.
👉 This is a support-based Fibonacci long setup — ideal for traders looking for a bounce play with clearly defined invalidation.

ORDIUSDT Forming Falling WedgeORDIUSDT is currently displaying a classic falling wedge pattern on the charts, a formation typically associated with bullish reversals. This technical setup suggests that the recent downtrend may be nearing exhaustion, with potential for a strong upward breakout. The wedge has been forming with lower highs and lower lows converging toward a breakout point, and recent candles suggest bullish pressure is beginning to build. With good volume supporting the structure, the conditions look ripe for a breakout rally.
A breakout from this falling wedge could see ORDIUSDT gaining between 70% to 80% in the coming weeks, based on historical price action and wedge height projections. The increased investor interest and healthy trading volume add conviction to this scenario, making it an attractive setup for both short-term swing traders and long-term crypto investors. The asset appears to be forming a base, and if the breakout confirms above key resistance levels, it could rapidly advance toward new highs.
What further adds to the bullish thesis is the growing attention toward Ordinals and Bitcoin-native assets, of which ORDI is a prominent player. Market participants are gradually shifting focus back to unique infrastructure and innovation-driven tokens, and ORDIUSDT may benefit from this shift in sentiment. With bullish divergence on indicators and confirmation of a breakout, this could be a strong candidate for a high-risk, high-reward opportunity.
Traders should keep an eye on volume spikes and confirmation candles for a safer entry. As always, risk management is key in volatile conditions, but technically, ORDIUSDT shows a promising structure that deserves close monitoring.
✅ Show your support by hitting the like button and
✅ Leaving a comment below! (What is You opinion about this Coin)
Your feedback and engagement keep me inspired to share more insightful market analysis with you!

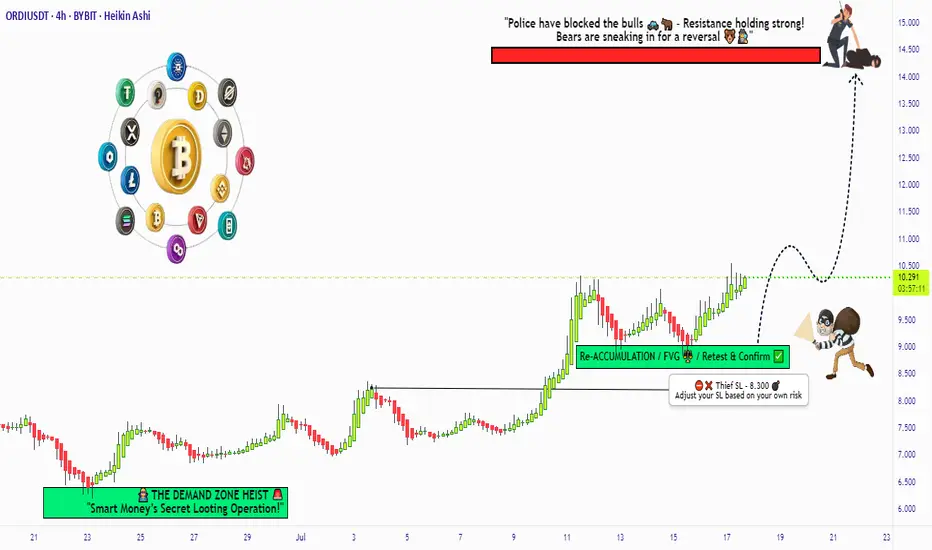
"ORDI/USDT: Pirate’s Treasure Trade! Bullish & Loaded"🚨 ORDI/USDT HEIST ALERT! 🚨 ORDI/USDT Bullish Raid Plan (Thief Trading Style) 💰🎯
🌟 Attention Market Pirates & Profit Raiders! 🌟
🔥 Thief Trading Strategy Activated! 🔥
📌 Mission Brief:
Based on our elite Thief Trading analysis (technical + fundamental heist intel), we’re plotting a bullish robbery on ORDI/USDT. Our goal? Loot profits near the high-risk resistance zone before the "Police Barricade" (bear traps & reversals) kicks in!
🚨 Trade Setup (Day/Swing Heist Plan):
Entry (📈): "The vault is open! Swipe bullish loot at any price!"
Pro Tip: Use buy limits near 15M/30M swing lows for safer pullback entries.
Advanced Thief Move: Layer multiple DCA limit orders for maximum stealth.
Stop Loss (🛑): 8.300 (Nearest 4H candle body swing low). Adjust based on your risk tolerance & lot size!
Target (🎯): 14.400 (or escape early if the market turns risky!).
⚡ Scalper’s Quick Loot Guide:
Only scalp LONG!
Rich thieves? Go all-in! Broke thieves? Join swing traders & execute the plan slowly.
Use trailing SL to lock profits & escape safely!
💎 Why ORDI/USDT? (Fundamental Heist Intel)
✅ Bullish momentum in play!
✅ Macro trends, & intermarket signals favor upside!
✅ News-driven volatility? Expect big moves!
⚠️ WARNING: Market Cops (News Events) Ahead!
Avoid new trades during high-impact news!
Trailing stops = Your best escape tool!
💥 BOOST THIS HEIST!
👉 Hit LIKE & FOLLOW to strengthen our robbery squad! More lucrative heists coming soon! 🚀💰
🎯 Final Note: This is NOT financial advice—just a thief’s masterplan! Adjust based on your risk & strategy!
🔥 Ready to Raid? Let’s STEAL Some Profits! 🏴☠️💸
👇 Drop a comment & boost the plan! 👇
(🔔 Stay tuned for the next heist!) 🚀🤫
ORDI/USDTKey Level Zone: 9.800 - 9.930
LMT v2.0 detected.
The setup looks promising—price previously trended upward with rising volume and momentum, then retested this zone cleanly. This presents an excellent reward-to-risk opportunity if momentum continues to align.
Introducing LMT (Levels & Momentum Trading)
- Over the past 3 years, I’ve refined my approach to focus more sharply on the single most important element in any trade: the KEY LEVEL.
- While HMT (High Momentum Trading) served me well—combining trend, momentum, volume, and structure across multiple timeframes—I realized that consistently identifying and respecting these critical price zones is what truly separates good trades from great ones.
- That insight led to the evolution of HMT into LMT – Levels & Momentum Trading.
Why the Change? (From HMT to LMT)
Switching from High Momentum Trading (HMT) to Levels & Momentum Trading (LMT) improves precision, risk control, and confidence by:
- Clearer Entries & Stops: Defined key levels make it easier to plan entries, stop-losses, and position sizing—no more guesswork.
- Better Signal Quality: Momentum is now always checked against a support or resistance zone—if it aligns, it's a stronger setup.
- Improved Reward-to-Risk: All trades are anchored to key levels, making it easier to calculate and manage risk effectively.
- Stronger Confidence: With clear invalidation points beyond key levels, it's easier to trust the plan and stay disciplined—even in tough markets.
Whenever I share a signal, it’s because:
- A high‐probability key level has been identified on a higher timeframe.
- Lower‐timeframe momentum, market structure and volume suggest continuation or reversal is imminent.
- The reward‐to‐risk (based on that key level) meets my criteria for a disciplined entry.
***Please note that conducting a comprehensive analysis on a single timeframe chart can be quite challenging and sometimes confusing. I appreciate your understanding of the effort involved.
Important Note: The Role of Key Levels
- Holding a key level zone: If price respects the key level zone, momentum often carries the trend in the expected direction. That’s when we look to enter, with stop-loss placed just beyond the zone with some buffer.
- Breaking a key level zone: A definitive break signals a potential stop‐out for trend traders. For reversal traders, it’s a cue to consider switching direction—price often retests broken zones as new support or resistance.
My Trading Rules (Unchanged)
Risk Management
- Maximum risk per trade: 2.5%
- Leverage: 5x
Exit Strategy / Profit Taking
- Sell at least 70% on the 3rd wave up (LTF Wave 5).
- Typically sell 50% during a high‐volume spike.
- Move stop‐loss to breakeven once the trade achieves a 1.5:1 R:R.
- Exit at breakeven if momentum fades or divergence appears.
The market is highly dynamic and constantly changing. LMT signals and target profit (TP) levels are based on the current price and movement, but market conditions can shift instantly, so it is crucial to remain adaptable and follow the market's movement.
If you find this signal/analysis meaningful, kindly like and share it.
Thank you for your support~
Sharing this with love!
From HMT to LMT: A Brief Version History
HM Signal :
Date: 17/08/2023
- Early concept identifying high momentum pullbacks within strong uptrends
- Triggered after a prior wave up with rising volume and momentum
- Focused on healthy retracements into support for optimal reward-to-risk setups
HMT v1.0:
Date: 18/10/2024
- Initial release of the High Momentum Trading framework
- Combined multi-timeframe trend, volume, and momentum analysis.
- Focused on identifying strong trending moves high momentum
HMT v2.0:
Date: 17/12/2024
- Major update to the Momentum indicator
- Reduced false signals from inaccurate momentum detection
- New screener with improved accuracy and fewer signals
HMT v3.0:
Date: 23/12/2024
- Added liquidity factor to enhance trend continuation
- Improved potential for momentum-based plays
- Increased winning probability by reducing entries during peaks
HMT v3.1:
Date: 31/12/2024
- Enhanced entry confirmation for improved reward-to-risk ratios
HMT v4.0:
Date: 05/01/2025
- Incorporated buying and selling pressure in lower timeframes to enhance the probability of trending moves while optimizing entry timing and scaling
HMT v4.1:
Date: 06/01/2025
- Enhanced take-profit (TP) target by incorporating market structure analysis
HMT v5 :
Date: 23/01/2025
- Refined wave analysis for trending conditions
- Incorporated lower timeframe (LTF) momentum to strengthen trend reliability
- Re-aligned and re-balanced entry conditions for improved accuracy
HMT v6 :
Date : 15/02/2025
- Integrated strong accumulation activity into in-depth wave analysis
HMT v7 :
Date : 20/03/2025
- Refined wave analysis along with accumulation and market sentiment
HMT v8 :
Date : 16/04/2025
- Fully restructured strategy logic
HMT v8.1 :
Date : 18/04/2025
- Refined Take Profit (TP) logic to be more conservative for improved win consistency
LMT v1.0 :
Date : 06/06/2025
- Rebranded to emphasize key levels + momentum as the core framework
LMT v2.0
Date: 11/06/2025
- Fully restructured lower timeframe (LTF) momentum logic
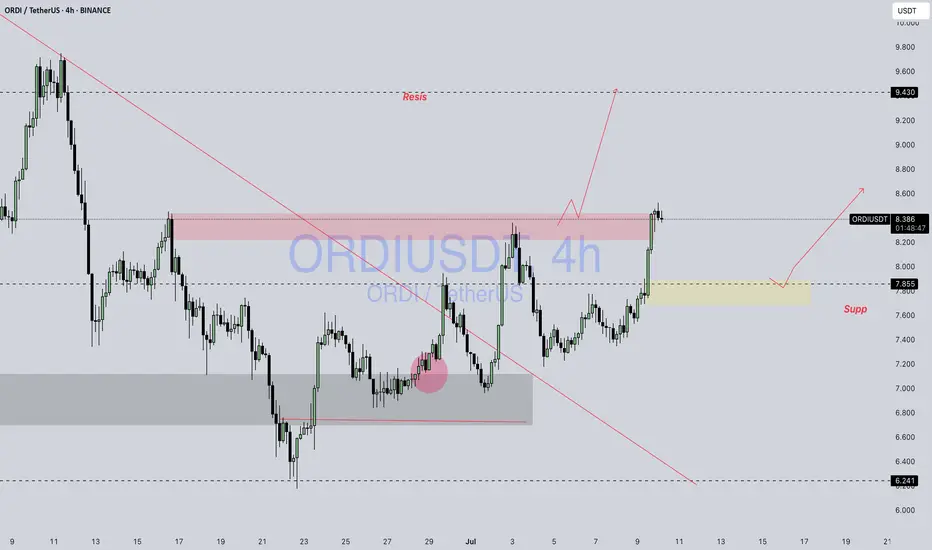
ORDI / USDTBINANCE:ORDIUSDT
### 📊 **Technical**###
* **Current Price:** \~8.377 USDT
* **Chart Type:** Candlestick (4H)
* **Trendline:** A long-term **downtrend line** has been broken, signaling a potential trend reversal or breakout.
---
### 📍 **Key Zones:**
1. **Resistance Zone (Red Box):**
* Located around **8.3 to 8.5** USDT.
* Price is currently testing this zone.
* A clean breakout with volume can send price toward the **next resistance at 9.43** USDT.
2. **Support Zone (Yellow Box):**
* Around **7.85** USDT.
* If price faces rejection from the resistance, it might pull back to this support and bounce from there.
3. **Next Major Resistance:**
* Marked at **9.430** USDT — likely the next target if the breakout sustains.
---
### 🧭 **Scenarios to Watch:**
* ✅ **Bullish Scenario:**
* Break and hold above the red resistance zone.
* Possible continuation toward 9.43 USDT.
* ⚠️ **Bearish Pullback Scenario:**
* Rejection from the red zone.
* Retest of the 7.85 support zone.
* A bounce here could still maintain a bullish structure.
Disclaimer : Not Financial Advice
ORDI (SPOT)BINANCE:ORDIUSDT
#ORDI/ USDT
Entry(6.450- 7.300)
SL 1D close below 6.100
T1 10.470
T2 17.000
T3 19.000
1 Extra Targets(optional) in chart, if you like to continue in the trade with making stoploss very high.
______________________________________________________________
Golden Advices.
********************
* collect the coin slowly in the entry range.
* Please calculate your losses before the entry.
* Do not enter any trade you find it not suitable for you.
* No FOMO - No Rush , it is a long journey.
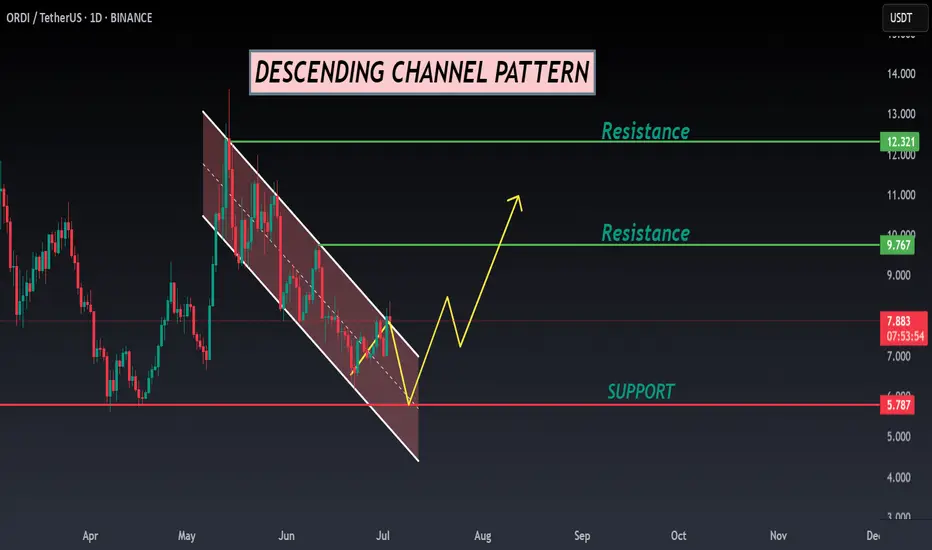
ORDI ANALYSIS📊 #ORDI Analysis
✅There is a formation of Descending Channel Pattern in daily time frame.
After a breakout of the pattern we would see a bullish momentum and can Target for $9.5 in few weeks🧐
👀Current Price: $7.890
🎯 Target Price : $9.500
⚡️What to do ?
👀Keep an eye on #ORDI price action and volume. We can trade according to the chart and make some profits⚡️⚡️
#ORDI #Cryptocurrency #Breakout #TechnicalAnalysis #DYOR