ARBKF - Let's See What Happens!If you've been holding since March, like someone I know, you've been pretty upset with ARBKF. It has massively underperformed compared to other miners. The IPO didn't help the price much either.
We finally broke our descending channel(green), and then found support at $1.47(red). We will retest $2.30/$2.40 so long as bitcoin keeps trucking along. We may have found an upwards support line (blue), that'll be tested with time. We are also finally above our 20 and 50 day moving average. Hopefully our 20 day crosses our 50 day soon, that's pretty bullish!
I have no major thoughts on this, I just wanted ARBKF to have some love in the Trading View Ideas section.
ARBKF trade ideas


Ok ARB...hear me out!Look what we have here, an OTC stock that....mines crypto? Must be crazy right? We have seen RIOT and MARA take off, but why does this look...stuck?
Answer: Hidden Gem that is due for that cataclysmic lift off. OTC makes it hard to get in for all the retail traders to gobble up and leverage to all sorts of margin calls. On top of some dilution to pay for operating costs (HODL that BTC).
TA we see it holding the 50 SMA very well and we are seeing a very very low volume area as traders wait for the crypto market catalyst to break all resistance currently being the 20 SMA and the trendline. RSI is flat, neutral, ready for a little action. Getting tight with room down to $2.60 (having cash ready for that potential dip!)
The thing I must mention here is, there are solid underlying fundamentals due to the crypto market. This play is highly dependent on BTC doing well, and guess what, the bull run is still going and the possibility of a supercycle looms (personally super bullish on BTC HINT HINT). What does this have to do with ARBKF? Well this little stock MINES BTC. And lots of it. Highly efficient, renewable energy powered, mining experts. 320 acres acquired in Texas. Superb hash rate. Numbers mined increasing and gigantic profit margins. I didn't come here to shill, but this little stock still has lots of room to run and is a great choice to add some leveraged crypto exposure to a portfolio.
Oh yeah, NASDAQ listing maybe soonish?!?! *Insert evil laughter*
-Pump
*This is the rambling of a mad man in Moes. Not financial advice. I (Pumpkin) hold shares in ARBKF


$ARBK and $ARBKF trade setup( levels are taken from $ARBKF chart)
Hi Fellow traders, here i share my trade setup on Argo Blockchain.
So argo recently had an IPO on the NASDAQ. their shares were sold as $ARBK.
As ARBK represents 10 $ARBKF shares, we can easily do the math and use the ARBKF chart as our ARBK chart.
Here i will share the TA i did on ARBKF and i will add the ARBK chart with those levels to make things easier.
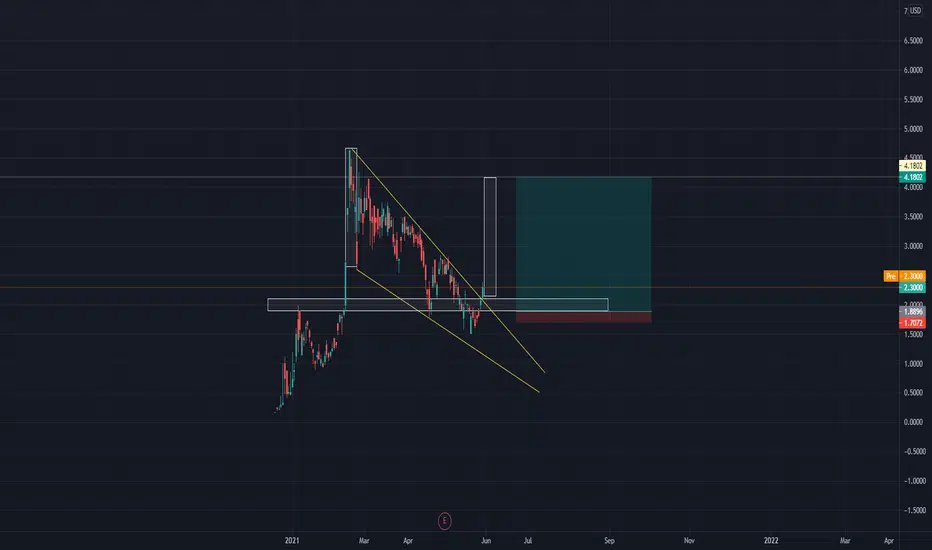
So, as shows on the chart, we broke out of a descending wedge with a bullish breakout. This is why im assuming our broadening wedge will be Bullish. But as we always have to keep in mind it can turn bearish, we also add those levels and targets.
So, after the bullish breakout we now are in a "Ascending Broadening Wedge" if we breakout bearish now, our 70% target of C-D price would be 0.9.
if we indeed still have to complete our ABCDE elliot wave pattern, im taking the 0.382 Fib level as target.
After that we have 3 options, (1) straight throught the roof (unlikely) (2) Backtest of last Resistance as Support before breakout (3) Back to Bottom of the pattern + Bearish breakout.
Bullish breakout takes us to 40 / 4 ish levels and a Bearish breakout AFTER a wave E to 4.9 / 0.49 level as a 70% from elliot wave D-E.
All levels ive shown are Backtested Proven resistance/support levels, and are backed up by fibonacci levels and pattern target levels.
My trade setup:
ive been buying in the 15 - 16$ are so we take our entry as 16$ ( 1.5 -1.6 in ARBKF )
Entry : 16 / 1.6
Target 1: 19.7 / 1.97
Target 2: 23.8 / 2.38
Target 3: 28.5 / 2.85
Target 4: 39.5 / 3.95
Target 5: 41.5 / 4.15
Stoploss / Short Entry : 14.40 / 1.44
Not financial advice, Trade safe Wanderers

$ARBKF and $ARBK trade setupHi Fellow traders, here i share my trade setup on Argo Blockchain.
So argo recently had an IPO on the NASDAQ. their shares were sold as $ARBK.
As ARBK represents 10 $ARBKF shares, we can easily do the math and use the ARBKF chart as our ARBK chart.
Here i will share the TA i did on ARBKF and i will add the ARBK chart with those levels to make things easier.
So, as shows on the chart, we broke out of a descending wedge with a bullish breakout. This is why im assuming our broadening wedge will be Bullish. But as we always have to keep in mind it can turn bearish, we also add those levels and targets.
So, after the bullish breakout we now are in a "Ascending Broadening Wedge" if we breakout bearish now, our 70% target of C-D price would be 0.9.
if we indeed still have to complete our ABCDE elliot wave pattern, im taking the 0.382 Fib level as target.
After that we have 3 options, (1) straight throught the roof (unlikely) (2) Backtest of last Resistance as Support before breakout (3) Back to Bottom of the pattern + Bearish breakout.
Bullish breakout takes us to 40 / 4 ish levels and a Bearish breakout AFTER a wave E to 4.9 / 0.49 level as a 70% from elliot wave D-E.
All levels ive shown are Backtested Proven resistance/support levels, and are backed up by fibonacci levels and pattern target levels.
My trade setup:
ive been buying in the 15 - 16$ are so we take our entry as 16$ ( 1.5 -1.6 in ARBKF )
Entry : 16 / 1.6
Target 1: 19.7 / 1.97
Target 2: 23.8 / 2.38
Target 3: 28.5 / 2.85
Target 4: 39.5 / 3.95
Target 5: 41.5 / 4.15
Stoploss / Short Entry : 14.40 / 1.44
Not financial advice, Trade safe Wanderers


$ARBK is giving a GREAT IPO LONG opportunity todayIPO intraday trading strategy idea
The share price is rising and gonna continue this trend today.
The demand for shares of the company still looks higher than the supply.
These and other conditions can cause a rise in the share price today.
So I opened a long position from $15,76;
stop-loss — $14,26;
take-profit — $20,26/MOC price.
Do not view this idea as a recommendation for trading or investing. It is published only to introduce my own vision.
Always do your own analysis before making deals. When you use any materials, do not rely on blind trust.
You should remember that isolated deals do not give systematic profit, so trade/invest using a developed strategy.
If you like my content, you can subscribe to the news and receive my fresh ideas.


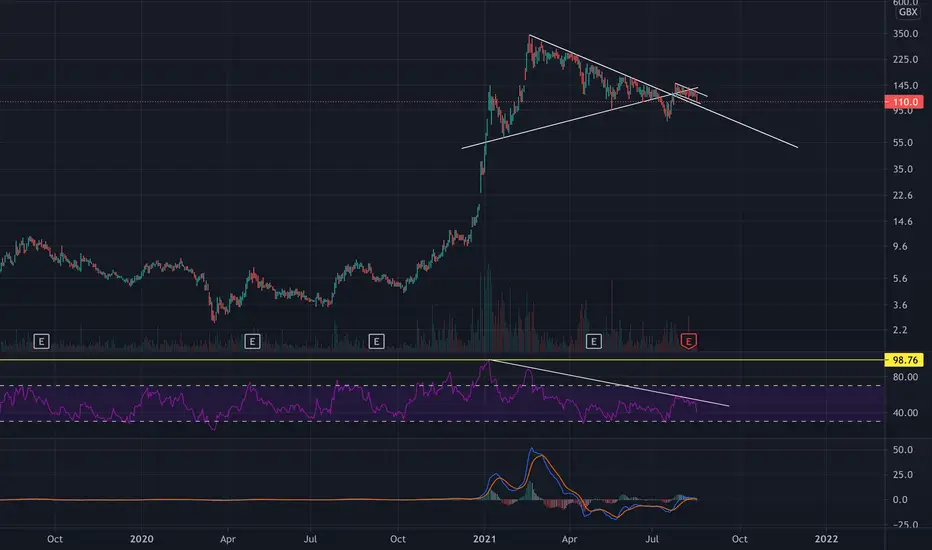
$ARB $BTCUSD Comparison Lowering expectations for ARB. Seems that this level for ARB is correct when $46k BTC. Historically ARB has traded here when BTC was at $46k, with one time being much higher. Would suggest that BTC reaching previous ATH would put ARB at around £2, not reaching historical highs. Of course other factors could trigger a better return on ARB from here.


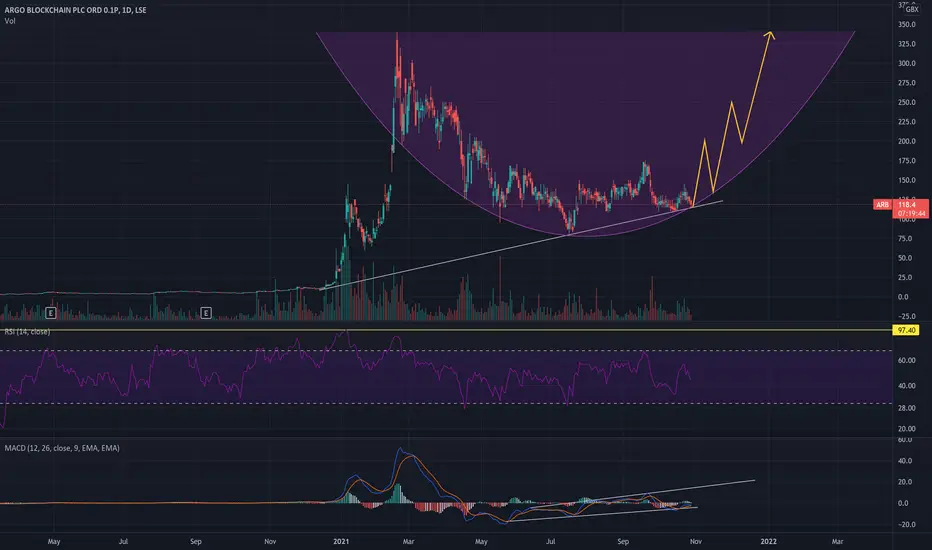
ARB flagARB has been in consolidation for a number of months, good news has followed, bitcoin has hit all time highs yet the ARB price has dropped considerably. This however was after an explosive increase in the latter months of 2020. The next few weeks, after main institutions have sold their holdings should hooefully see the Argo price break from the consolidated wedge to the upside, expectations would take this to near 300 in the near term. Bullish outcome over the next few weeks \ months.


