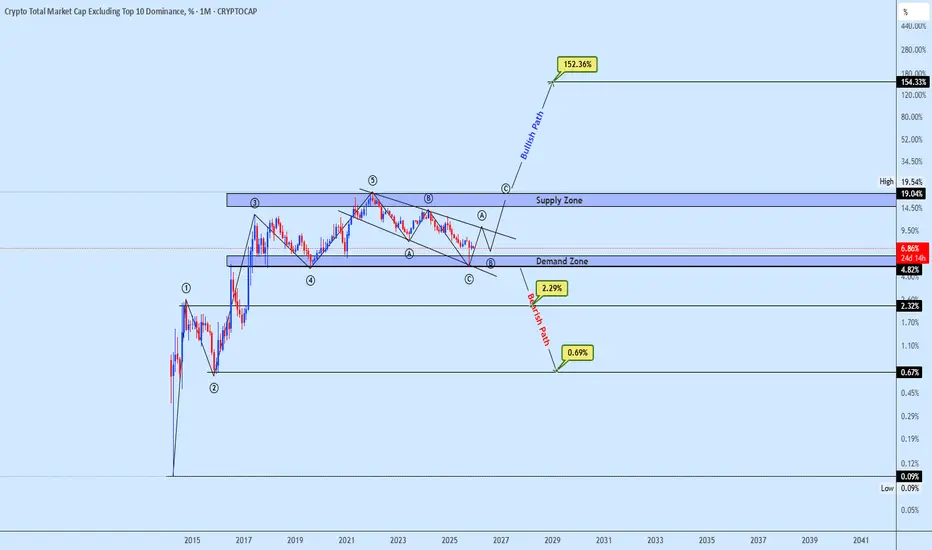
Critical Inflection Point for Altcoin DominanceThe crypto dominance excluding the top 10 assets price is sitting directly on a long-term demand zone that has generated strong reversals in previous cycles. After completing a 5-wave advance and forming a complex ABC correction, the market is now testing this structure once again.
A rebound here would support a bullish path back into the supply zone, and a breakout above it could open an extended expansion, with long-term projections pointing toward 152% dominance. This would imply strong capital rotation into mid-cap and smaller altcoins over the coming cycles.
If the demand zone fails, the bearish path becomes active. Breakdowns below this level expose deeper targets around 2.29% and potentially 0.69%, signaling broad weakness and a prolonged risk-off environment for altcoins.
Monthly behavior at this level is decisive. The demand zone remains the key line to watch for the next major trend.
Trade ideas
FireHoseReel | Crypto Index Overview🔥 Welcome FireHoseReel !
Let’s dive into the analysis of Four major crypto Index.
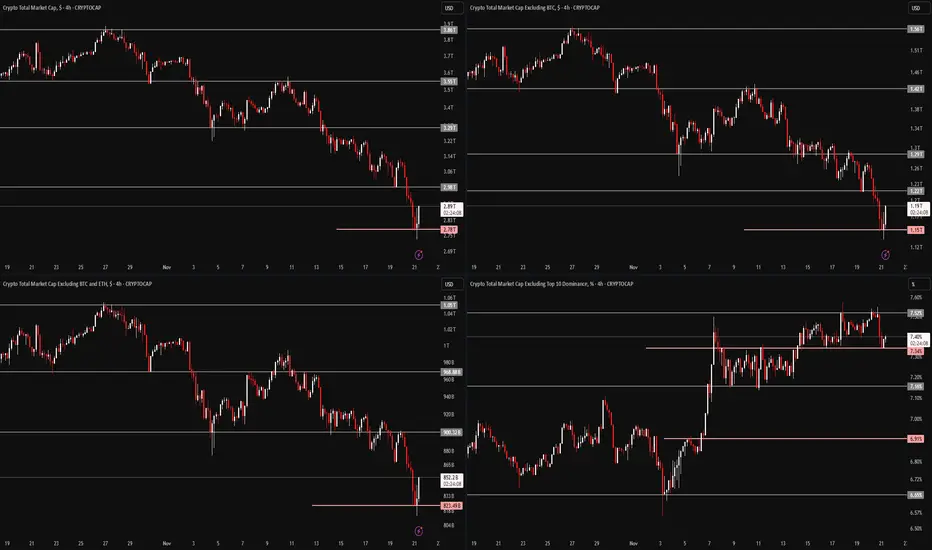
🔶 TOTAL (Crypto Market Cap) – 4H Timeframe
On the 4-hour timeframe of TOTAL, we can see a strong correlation with Bitcoin’s chart. After approaching the $4T zone, the total market cap went through a deep correction, testing multiple support levels and eventually breaking them.
It’s now sitting around $2.78T, marking a $1 trillion drop, which is something unprecedented in the crypto market.
The current support lies at $2.78T, and this level aligns closely with the upper resistance of USDT dominance, creating an important confluence. If this confluence strengthens, TOTAL may continue moving downward while USDT dominance pushes higher.
The major resistance for TOTAL is the $3T zone, and a breakout above it could create a pullback to the recent Bitcoin decline.
🔶 TOTAL2 (Altcoin Market Cap Excluding BTC) – 4H Timeframe
On the 4-hour timeframe of TOTAL2, we see a strong correlation with Ethereum’s chart.
TOTAL2 dropped from around $1.5T down to nearly $1T, following the recent sell-off in Bitcoin and Ethereum. It tested its supports and eventually lost them.
Currently, TOTAL2 is positioned near $1.15T, and breaking below this level could lead to a deeper correction in Ethereum.
On the other hand, reclaiming and breaking above $1.22T may push TOTAL2 upward and act as an early signal for a new bullish wave (mostly a pullback) in Ethereum and its ecosystem projects.
🔶 TOTAL3 (Altcoin Market Cap Excluding BTC & ETH) – 4H Timeframe
On the 4-hour timeframe of TOTAL3, the chart aligns with the performance of the top 10 altcoins.
TOTAL3 previously hovered around $1.05T and has experienced a milder decline compared to TOTAL and TOTAL2. It is currently sitting at its major support near $832B, testing a multi-timeframe support zone.
A breakdown of this level could extend the correction across the top altcoins.
However, breaking above the $900B area could generate a pullback and corrective wave against the recent downside leg, signaling potential upward movement.
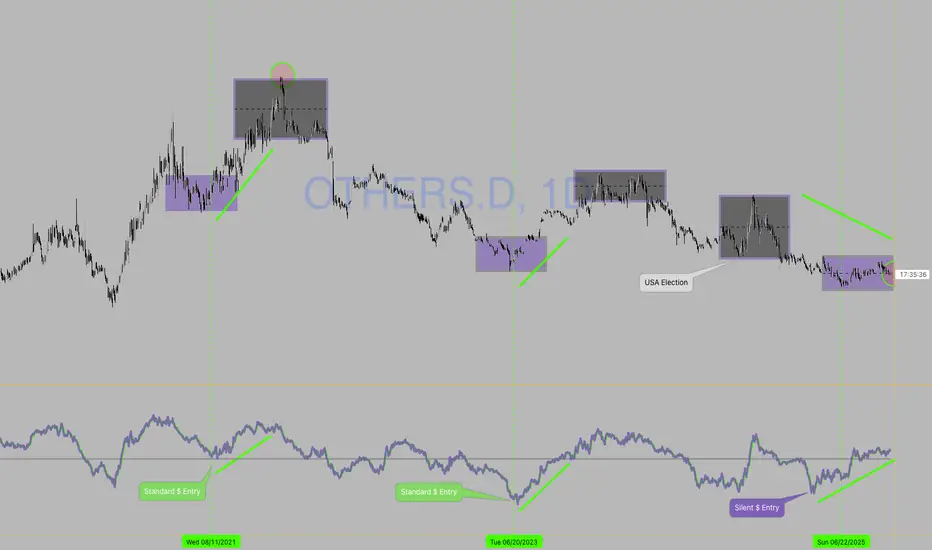
🔶 OTHERS Dominance (others.d) – 4H Timeframe
On the 4-hour timeframe of OTHERS.D, we’re looking at one of the most important crypto indicators, especially in times like this. This index helps us understand when the altcoin bull market (altseason) may begin and when it's time to start building spot portfolios.
Despite the market volatility, OTHERS.D has held itself inside a stable 4H trading range and is currently reacting to the midline of its 1H range.
If Bitcoin dominance had increased during this period, altcoins could have faced an even deeper correction. However, on-chain data shows that altcoins are receiving far more attention compared to previous years.
A breakout above 7.52% on this indicator could be an early signal of a potential upcoming altcoin bull run.
🛞 Risk Management & Disclaimer
Please remember to always use proper risk management and position sizing. Nothing in this analysis is financial advice. The market can change quickly, so always trade based on your own strategy, research, and risk tolerance. You are fully responsible for your own trades.
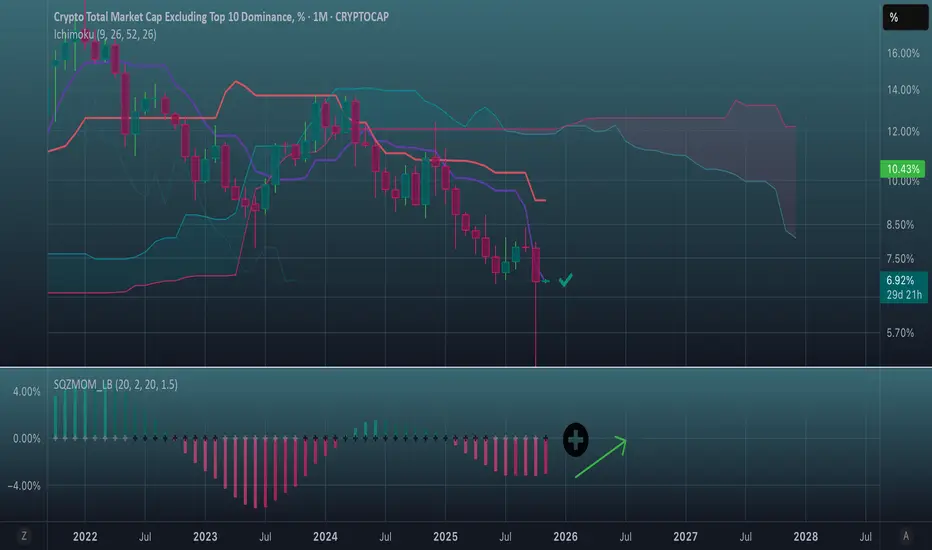
OTHERS.D / BTC.D – Monthly TimeframeThis is almost the identical setup to late 2019, but with an even longer and more brutal compression period (3 years vs ~1 year).Historical precedent: Every single time the Fed balance sheet has stopped shrinking and gone flat-to-up → massive altcoin outperformance follows within 3–9 months
We are literally at the exact inflection point again: Fed QT officially over (per the label and the flat balance sheet). Liquidity conditions shifting from tightening → neutral / soon re-expanding
Altcoin dominance compressed against multi-year support for longer than ever before
My current bias (November 20, 2025): Extremely bullish on altcoins vs Bitcoin — this is one of the highest-conviction setups I’ve seen in the entire cycle. Expecting: Breakout above 6.4–6.5% in the coming 1–3 months. Initial target 8.5–9.5% (2021 highs) by mid-2026
Realistic stretch to 11–13%+ if the Fed actually restarts QE in 2026 (very plausible in a recessionary recession or “soft landing” re-acceleration scenario)
Only thing that invalidates this is a monthly close below ~6.2% combined with the Fed balance sheet resuming its decline (which would be a major policy surprise at this point).
Bias summary: Heavily long altcoins / short BTC dominance. We are in the late-2019 equivalent — altseason is extremely likely to begin in Q1/Q2 2026.

ALTS dominance is damn bullish I am bullish on altcoins because, technically, the Others Dominance chart is forming a double bottom on the weekly timeframe. Moreover, the RSI is showing bullish divergence, and there is strong monthly support. Higher timeframes usually work more reliably, which adds to the bullish outlook.

One more chance.it's no other way to cut it especially the way BTC has been losing steam.
everyone across the board has be feeling the pain.

OTHERS.DUpdate to the chart of currency dominance and their season.
Support and resistance levels,
The complete explosion of currencies will start once the key is surpassed at the higher levels when the dominance reaches the higher levels.RUN
ALL THE BEST

Are We on the Verge of the Next Altseason?Over the past decade, Altcoin Dominance (OTHERS.D) has exhibited a clear cyclical pattern, with each major consolidation phase leading to a strong rally — the hallmark of every major Altseason.
2014–2017: Consolidation between 1–5%, followed by a surge above 12%.
2018–2021: Base range of 4–9%, then a breakout toward 20%.
2022–2025 (Current Phase): Another long consolidation between 6–12%, with the RSI near oversold levels (~30) and volume remaining muted — conditions similar to previous pre-breakout periods.
Historically, these cycles have aligned closely with Bitcoin’s halving events, as capital tends to rotate into altcoins once Bitcoin establishes dominance and stability post-halving.
If this recurring structure continues, altcoin dominance could expand from the current 6–7% zone toward 20–25% in the next major cycle — potentially marking the beginning of the next true Altseason.
Not financial advice.

Hello, November.Here, the picture is the opposite of Bitcoin dominance.
The black cross means that a contraction has begun with an exit to the bullish side.
In addition, we note a timid but important sign:
the candle is exactly on the Kijun-sen line and is about to start higher from it.
Frame shift. We pay so much attention to the opposition between OTHERS and BTC...
But when I opened the weekly chart for OTHERS.D/BTC.D, I didn't find anything remarkable. The RSI curve is in the middle of the range and showed a decline, but without any extremes.
But when I opened OTHERS.D/ETH.D and turned on Reverse RSI (you can also find it on the good old RSI by simply drawing lines by hand), the situation turned out to be much more interesting.
I have a theory for you. The last altcoin dump occurred primarily in ether pairs. And it was associated, among other things, with a cunning capital outflow.
Back in August, the RSI in this pair reached a historic low, never having fallen into the “basement” since 2017.
Now look at the October drop.
This is a bullish divergence. In addition, there is a bullish momentum indicator.
Most likely, we are seeing a very slow flow into altcoins, for which the price of OTHERS was sharply knocked down through ether pairs.
The candle found support on the moving average.

Following the thin neck.I have mentioned many times that I refer to the areas of the Ichimoku clouds
where Senkou Span A and Senkou Span B are closest to each other as the “thin neck.”
The same name can be given to the areas where these lines intersect,
which cause the Kumo cloud to change color.
This is the OTHERS.D/BTC.D/ETH.D chart.
An unusual composite, right?
Look at how the chart reacted to the change in clouds.
How many times did the movement in one direction or
another coincide with the thin neck area?
I have a surprise for you.
The next change in clouds will occur during New Year's week.

Patience…If we missed any ship it would have been the one in early 24 when most alts really did preform well compared to what most did at the end of 24.
Yet as this chart shows it never once had a real rally while BTC dominance falls
And it’s around its all time high
At that time BTC was just bumping up against it. It’s ATH
So now that we are while above last cycle
Type
I just thing having lil more patience here will make all the wild.
I mean just look at zcash and bnb
The rest will follow.


crypto total market cap “Based on the dominance analysis, it appears that the bearish rally will come to an end by November. Following this, the bullish rally is expected to be shaped and confirmed by the identified wave structures. The evaluation of these waves has been conducted using Ichimoku wave theory along with time analysis.”

It Starts Now!You want to quit? Do the opposite!
This flush was the event needed to launch the ALTCOIN season.
If you sell your ALTS now, you WILL regret it and FOMO back in at the WORST possible time!
OTHERS DOMINANCE wicked down (to liquidate all leverage) and closed above the support line.
Check back in a couple of months!

#OTHERS.D ~ Do you believe in Castles in the SKY?I believe that the Others dominance metric divided by an ounce of real money #Gold gives us a valuable insight into the fabled altseasons.
Because as this chart shows theres only been 4 in actuality
and you normal get a double bubble in a cycle.
So I believe we are at the cusp of turning things around as most people have given up on the concept of altcoins ever pumping again.
But it was just the business cycle #PMI that has depressed prices for the past few years.

Macro Alert: The Stealth Flight 2 Alts (Tariffs, Gold & Privacy)🚨 MACRO ALERT: The Silent Surge — Altcoins Accumulating Undetected Since April
Chart: CRYPTOCAP:OTHERS.D
━━━━━━━━━━━━━━━━━━━━━━━━━━━━━━━━━━━━━━━━
📊 The Setup
While the mainstream remains fixated on Bitcoin's swings, a quiet but significant capital rotation into altcoins is underway. This move, largely undetected by the broader market, is being fueled by shifting global macroeconomic tides and a growing institutional hunt for wealth preservation and financial privacy .
━━━━━━━━━━━━━━━━━━━━━━━━━━━━━━━━━━━━━━━━
🔴 THE CRISIS: Multiple System Failures Converging
🏦 BIS Warning: Global Liquidity Crisis
↓
🇯🇵 Japan: Unsustainable debt from fiscal stimulus
🇫🇷 France: 0.6% growth in 2025, economic stagnation
↓
💸 Coordinated failure of fiat monetary policy
⛓️ Government Attacks on Safe Havens
↓
🇺🇸 U.S. Gold Tariffs: 39% on major imports
Physical metals face capital controls & taxation attacks
Traditional assets no longer safe from state control
🔒 Even Crypto Has Centralization Issues
↓
📜 GENIUS Act: Stablecoins expand M2 money supply (monetizing debt via blockchain)
🏢 XRP: Concentrated token control raises manipulation concerns
━━━━━━━━━━━━━━━━━━━━━━━━━━━━━━━━━━━━━━━━
🟢 THE SOLUTION: Where Capital Is Flowing
Smart money is seeking assets with:
• TRUE decentralization
• Privacy features
• Fixed supply
• Institutional-grade infrastructure
The Data Confirms It:
🔐 Privacy Coins (XMR, ZEC): +71.6% in 2025
📊 CRYPTOCAP:BTC: +27.1%
📊 CRYPTOCAP:ETH: +33.4%
📈 OTHERS.D: Rising quietly
This is sophisticated money moving in, not retail FOMO.
━━━━━━━━━━━━━━━━━━━━━━━━━━━━━━━━━━━━━━━━
💥 The Macro Catalyst: Why This Is Happening Now
⚡ Gold Under Attack: The recent 39% U.S. tariff on major gold imports has rattled the traditional safe-haven market, creating artificial scarcity and signaling a broader trend of government control over monetary assets . When even physical metals face intervention, capital seeks alternatives outside increasingly controlled systems.
🚨 The BIS Warning Nobody Is Discussing:
The Bank for International Settlements is quietly sounding alarms on global liquidity risks:
• 🇯🇵 Japan's fiscal stimulus → unsustainable debt levels
• 🇫🇷 France → 0.6% growth (stagnation)
• 💸 Result: Coordinated fiat monetary policy failure
🪤 The Stablecoin Trap:
The U.S. GENIUS Act is expanding M2 money supply through the back door via stablecoins:
→ Legitimizing stablecoin issuance backed by Treasury bonds
→ Monetizing debt while calling it "innovation"
→ This isn't decentralization—it's the Fed with a blockchain wrapper
━━━━━━━━━━━━━━━━━━━━━━━━━━━━━━━━━━━━━━━━
🎯 Macro Pressure → Altcoin Opportunities
😰 Worried About: Wealth Confiscation/Control
💡 Consider: Financial Sovereignty & Privacy
🔍 Examples: CRYPTOCAP:XMR , CRYPTOCAP:ZEC
📈 Catalyst: Zcash surged 150%+ on institutional demand (Grayscale Trust)
😰 Worried About: Currency Devaluation & Inflation
💡 Consider: Scarce, Decentralized Stores of Value
🔍 Examples: Altcoins with fixed supplies + robust decentralized governance
🔑 Key: Assets that can't be inflated or controlled by single entities
😰 Worried About: Traditional Finance Instability
💡 Consider: Institutional-Grade Blockchain Infrastructure
🔍 Examples: HBAR (corporate governance) & XRP (cross-border payments)
⚠️ Note: Focus on real-world utility beyond speculation
━━━━━━━━━━━━━━━━━━━━━━━━━━━━━━━━━━━━━━━━
What to Watch For
✅ Confirmation: Strong, high-volume breakout above recent range high on CRYPTOCAP:OTHERS.D
🔍 The Privacy Pulse: Continued strength in privacy coins ( CRYPTOCAP:XMR , CRYPTOCAP:ZEC , XVG.D) is a key leading indicator. Note: Privacy coins face regulatory challenges and have been delisted from some major exchanges.
❌ Invalidation: Break and close below key support zone (April low structure) would suggest macro fears haven't overcome broader market uncertainty.
━━━━━━━━━━━━━━━━━━━━━━━━━━━━━━━━━━━━━━━━
🎯 The Bottom Line
The gold tariff is a symptom of a larger disease: eroding trust in neutral, non-government monetary assets . This is forcing a "regime change" in capital allocation.
As this realization dawns on more investors, the quiet accumulation in altcoins—particularly those offering privacy, sovereignty, and real-world utility —could explode into the next major market narrative.
💭 Smart money is moving early. The question is: will you recognize this shift before it becomes obvious?
━━━━━━━━━━━━━━━━━━━━━━━━━━━━━━━━━━━━━━━━
⚠️ Disclaimer: This is macroeconomic observational analysis and is not financial advice. Always conduct your own research (DYOR) and manage risk appropriately.
Cheers!
Altseason? Not yet 🔎 Ex-Top10 dominance = market share of everything outside the top 10 coins.
Since early-2022, it’s been sliding in a descending triangle (lower highs, flat support) — no strength yet.
✅ Trigger I need: a weekly close above the triangle, ideally > 9.5–10%, with follow-through. That would signal rotation into mid/small-cap alts.
⏳ Until then: bias = BTC/mega-caps. Alts only tactical near 7.2% / 6.6% with tight risk.

It's almost AltseasonAs you can see all these indicators on a macro scale is showing oversold and reversal. The trend is shifting back to the Alts. The next several months will be meme mania


Others.d 4H Analysis - key Triggers Ahead👋🏻 Hey everyone! How’s it going? Hope you’re all doing well.
❄️ Welcome to Crypto Winter.
⏰ Today, we’ll be analyzing Others.d and exploring its potential opportunities.
👀 On the 4H timeframe, looking at the Others.D index, we can see that this index moves inversely to Bitcoin dominance (BTC.D) and Tether dominance (USDT.D). It reflects the capital flow into altcoins (excluding BTC and ETH). Currently, it has been consolidating inside a tight box structure. After breaking above the seller’s trigger zone — the top of the box — at 7.87%, it moved upward but got rejected at the 8.3% resistance.
💡 After the rejection, it formed a higher low compared to the previous one, showing respect from buyers. Momentum then picked up quickly, pushing the price back toward the 8.3% resistance with fewer green candles but stronger momentum. We are now retesting this resistance, and a confirmed breakout here could serve as a first small confirmation for a potential altcoin bull run.
🧮 Looking at the RSI oscillator, one critical level stands out: the 70 overbought zone. Considering the recent positive economic data, which fueled capital inflows into equities, this level gains even more weight. It may provide further support for Others.D cap to push higher.
🕯 After breaking out of the box, candle size and volume looked normal, but at the formation of the higher low, buyers strongly respected that level — suddenly the candle size increased sharply, showing FOMO from buyers and fresh capital entering risk assets.
🧠 We now have multiple confirmations for a possible breakout and stabilization above this resistance. If it happens, several altcoins with strong setups should be on the watchlist for entries. A clean breakout could also provide the green light to open long-term futures positions on altcoins, as a stronger rally may follow.
❤️ Disclaimer : This analysis is purely based on my personal opinion and I only trade if the stated triggers are activated .
Weight of a gold slab. So, here's what I'm observing.
Today, perhaps the heaviest sumo wrestler crushing the altmarket is gold.
Have you noticed that the decline in Bitcoin dominance by whole percentage points is EXTREMELY MODEST (VERY EXTREMELY MODEST) and hasn't helped to OTHERS
strengthen position?
What's going on?!
I have already expressed the idea of “consecutive vessels” earlier,
based on the fact that one decline in Bitcoin dominance is not enough
for the alt season. To begin with, we need a strengthened ETH,
and then a decline in its ETH dominance... And so on.
And here is a very large inverse relationship for altcoins.
Gold futures…
If we open the composite monthly chart OTHERS.D/GC1! and apply Reverse RSI and
Price Heat Meter , we can clearly see that gold did not give the altcoins a break,
causing them to fall in inverse proportion to their growth.
The passage of candles below the green-turquoise line (1 point) indicates extreme
oversold altcoins, as this is a monthly chart.
Note (2 point) that in the case of the Price Heat Meter, a value of ~2% can also be interpreted
as extreme oversold (the kettlebell bottomed out).
A thin blue line is forming, and later the absolute minimum “cooling” mark will be
printed on it, after which a reversal will begin.
The candlestick pattern looks like a reversal is just around the corner.
However, the forecasts for gold are such that the market is going
to continue buying regardless of prices without a significant correction.
Honestly, I don't know the answer for gold.
I'm still thinking and don't know when I'll offer an idea for GC1!
But I know for sure that I will publish an update to this chart.

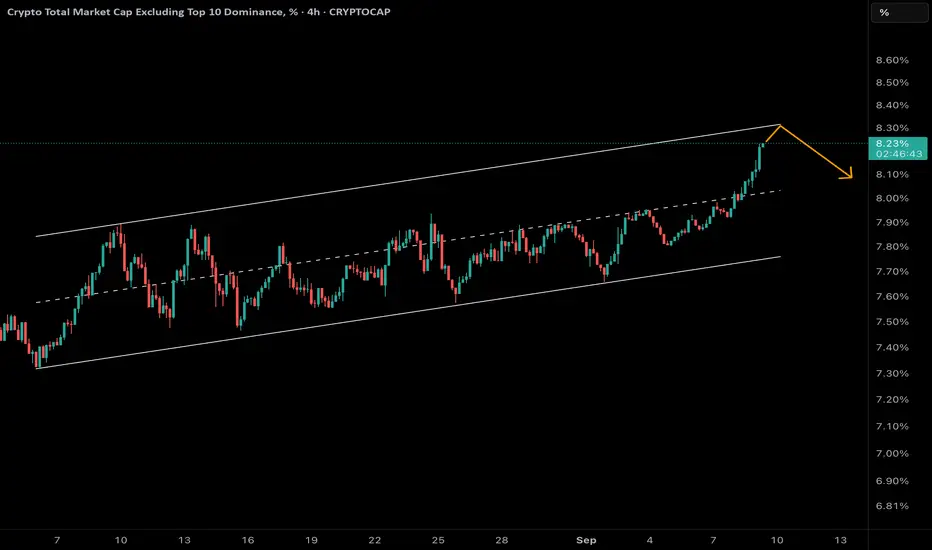
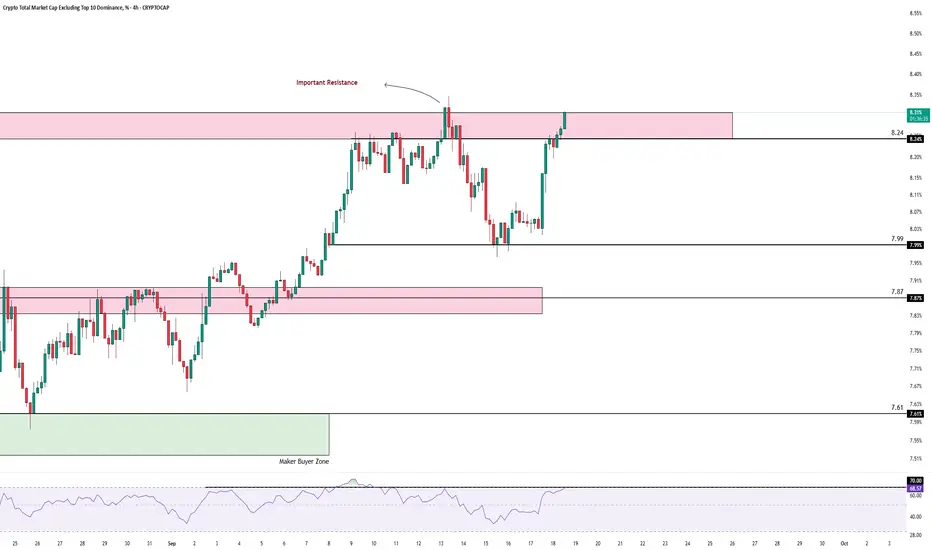
Altcoins on the Edge: Will “Others” Dominance Get Rejected?The Others Dominance chart is moving within an ascending channel and is now approaching the channel’s upper boundary.
The 8.31% level is acting as a key resistance near the top of the channel.
✅ A likely scenario is a rejection from this zone, which could trigger a downward correction in dominance.
📉 This would translate into negative volatility for altcoins, as the dominance of smaller-cap coins tends to drop after reaching such resistance levels.