good chanelWe have 12 hits to the upper and lower levels and the midline of the channel, do you think we will see a positive reaction on the bottom of the channel this time too? I think the alt season is very close, we are in a zone of extreme fear... and we have healthy volume behavior.
OTHERS.D trade ideas

Trusted channelWe have 12 hits to the upper and lower levels and the midline of the channel. Do you think we will see a positive reaction on the bottom of the channel this time? I think the alt season is very close, we are in a zone of extreme fear...

OTHERS - Bullish PhaseOthers now at 250B, considering that the Bitcoin price could still drop..there are still at least 250B more to pour into Others.
Apr - May looks promising for some altcoins.
Thank you,
This is not a trading advice.
St.Gex

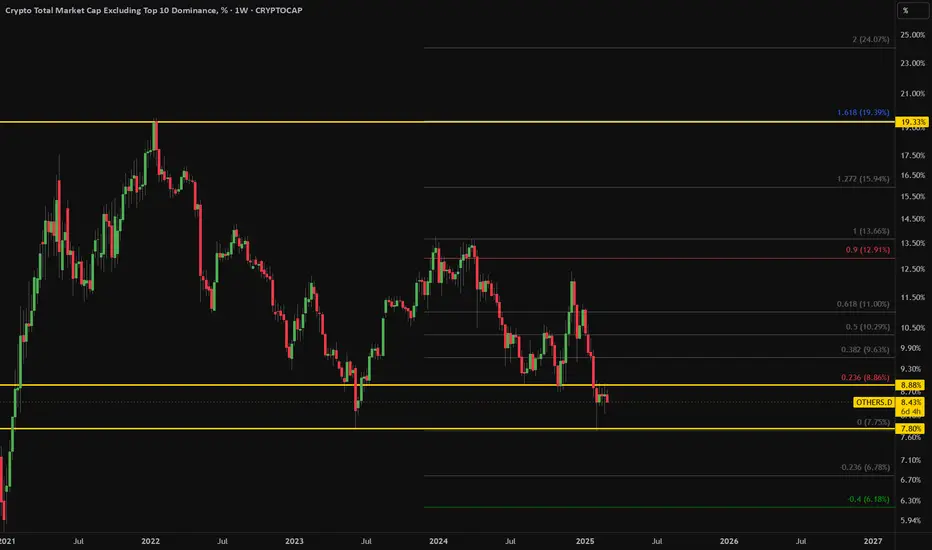
Break of 8.88% to indicate ALTCOIN rally?Break of 8.88% to indicate ALTCOIN rally? I'll be keeping an eye on this specific level and going deeper in ALTs if this happens.
Great time to get into anything but the top 10 cryptosGreat time to get into anything but the top 10 cryptos
A contrarian view indeed, but there is a possibility of money flowing out from BTC into altcoins outside the top 10, pushing OTHERS.D dominance up. Diversification of portfolio is key!
Bar Chart Pattern obtained via ETHUSD 1W (Dec 2018 - March 2020)

Altcoins HELL almost finished .History doesn’t repeat but it often rhymes. The cycle rhymes again with a way more massive volume, last one took +1300 days to start explode and this one going for a bit longer now , tbh I could never see this hellish situation, it’s a deep filt.h which was unseeable but we still survived, every run has its own cycle a d in this one I see a glimpse of life .
We gonna stay but not for ever , I’m out good or bad October-November this year unless I see something very special on my charts so for now hold tight and remember as long as you holding you shi.t coins you haven’t lost.

Further Correction in the Works?I believe that our patience and knowledge are really being tested at this time more than any for crypto junkies like myself.
I can say that this cycle has been the most complex compared to any other historical cycle. A lot of different opinions are out there as well as a lot of uncertainty.
But when in doubt, zoom out. So I have been focusing on larger time frames for my recent TA.
When looking at OTHERS.D; I would have said a 1:0.618 3 WC would be game on about a month ago. But after further correction past that window, it appears that a 1:1 correction could be a likely outcome.
This doesn't mean that a connective wave up from its current position is not on the table, one could assume that could happen at any time now, and I would agree.
The fib based time tool suggests that the bottom for OTHERS.D may come sometime between June and November. To make the timing more balanced, I would say August would be the sweet spot.
Keep in mind that the fib based time tool is only an estimation, and can lack accuracy. But it is a tool that I am becoming more familiar with; and will start applying it more if it can prove to be useful.
Good Luck Traders!
- Not Financial Advice -


Crypto Market Cap Excluding Top 10Price is currently retesting dynamic support within an ascending channel, forming a potential bullish reversal structure. The market previously broke out of a descending wedge, confirming a strong uptrend, and is now completing a Wave 4 correction. Multiple pullbacks to this trendline have held, suggesting accumulation. A successful rebound could trigger a measured move of 13.48% toward 19.51%, aligning with prior resistance, while a full Wave 5 extension targets 36.71%. Failure to hold this level could shift momentum bearish. A breakout with strong volume would confirm continuation, while rejection signals a deeper correction.

The Others UpdateThe market is testing your patience, trying to shake you out so they can buy back at a lower price. Stay strong and hold your ground.
Observe the chart carefully, a perfect double bottom was formed earlier, while now the RSI remains elevated, signaling potential strength in Altcoins.
As always, the crypto market will move faster than you can react.
Happy Tr4Ding !

Alt Coin Season Is Here - Elliott Wave AnalysisBased on this Elliott Wave Count on the Others.D chart, it suggests that Wave (IV) has completed and by extension means that Alt Coin Season is here!
Technical confluences at this level:
Monthly 100 Day EMA
23.6% Monthly Fibonacci Level
61.8% Fibonacci Projection Level
Parallel channel that forecasts the completion of Wave (IV)
There are 2 targets, 25% and 34%.
Let me know what you think.
Good luck!

No Altseason Until Other.D Reclaims the UptrendApparently $Other.D has broken through the upper trend line for weeks.
In the past four times, altcoins surged when other.d touched the trend line.
Now it has broken this pattern.
We will not have altcoin season until it goes back to above the upper trend line.
In the past few weeks, those shorting altcoins outside the Top 10 have actually made more profit.
Hang in there, for those who waiting for altseason.
🔴 Read my signature & publications for more info you don’t want to miss.
🔥 for more future "guesses" like this!

OTHERS.D%; my notes for long-termAlthough we have been seeing lower highs for a long time on the chart, we continue to see higher lows. Although the values are falling, the RSI is rising. These are good signs; positive. I also see them as a sign that prices are under a lot of pressure for a reason.
Therefore, when we consider these places as bottoms; first of all, we need to see increases above 10.5%. The most important profit-taking points are between 13.5% and 15% (strong resistance); because we cannot see significant increases in altcoins without exceeding this level. When this level is exceeded, we can see new ATHs and high levels in many important altcoins. For now, these are my expectations and the levels I am following.
This is not investment advice.

OTHERS.D UPDATE (4H)Altcoin dominance appears to be creating liquidity. It has not yet reached a key resistance point to accumulate more sell orders and drop further. Additionally, it has hit a very strong support level at the bottom.
For a continued drop, it needs to be fueled by an order block and gather more sell orders. Therefore, we expect it to move toward the upper order block and collect more liquidity from the liquidity pool we have identified.
Let's see what happens!
For risk management, please don't forget stop loss and capital management
Comment if you have any questions
Thank You

OTHERS.D \ ALTCOINS DOMINANCE CRYPTOCAP:OTHERS.D \ #Altcoins Dominance
The uptrend, which started in 2015, was tested again in December 2016 and the major pump process started. It was tested again for the third time in February 2025, 9 years later.

Are you watching closely?Don't listen to all those dramatic fools screaming and shouting at the top of their lungs so that you give up here. Would you dare to give up here?
Benjamin Cowen keeps crying stating he would prefer not to have a 2nd wave of inflation like it happened in the 70s because his children would suffer. Come now, while he's telling people he wishes for altcoins to die, technicals suggest otherwise.
This is the part where almost everyone gives up, will you give up?
I most certainly won't.

The last standThe altcoins must hold on to this Demand Level and Support area, last candle was a long wick candle offering hope that there might be a price reversal but we need some reversal candles so we can get close to the target. Please see charts for details.

IS THERE ALT SEASON COMING OR NOT ?!here is the chart of OTHERS.D / USDT.D this means how much liq goes to alt coins in past duration and you can see it ended up to a triangle with 5 elliot waves and now we can see that this triangle can make the market rise or make it down its better to wait and see which line will be broken !

Crypto Total Market Cap Excluding Top 10 DominanceAltcoin dominance has been declining since early 2024, revisiting June 2023 lows and hitting a 4-year low. This mirrors the last cycle, though the drop then was sharper and faster.
In 2021, altcoins surged post-halving as BTC climbed 50-100% above its previous all-time high—similar to what could unfold in 2025. While each cycle differs, the pattern so far loosely aligns, though altcoins have underperformed compared to the last cycle.

When Will the 2025 Altcoin Season Arrive? Patterns Reveal !OTHERS.D is copying the same script as the last two altcoin seasons.
I’ve marked points 1-8 in the structure.
Each time, it formed a triangle consolidation before breaking into a bull run.
In the last two cycles, point 8 was the final low before the rally.
Right now, it's retesting point 8, which is the lower boundary of the triangle.
Will it repeat the script and break out, or is this time different?
Could we see a new scenario, or is it possible that altcoin season won’t come at all?
If the altcoin season does happen, CRYPTOCAP:OTHERS could 2x from here.
What do you think?
Do you believe we’ll see a crazy 2025 altseason?
🔴 for more future script "guesses" like this!
🔥 I've dropped another 2 analyses for the 2025 altseason on the right hand side if you're using computer, and scroll down a bit to see the link if you're using mobile.

This Breakout Will Trigger Massive Altseason!Hello, Skyrexians!
According to your activity we noticed that you are interested in Bitcoin and CRYPTOCAP:OTHERS.D analysis. This is not a top secret because everyone wants to know when altseason will be started. In our recent we warned you about drop for altcoins dominance below the support level and it happened next day. Now we have the potentially reversal signal, be need to wait for it's confirmation.
On the weekly chart we can count the previous massive altseason as the wave 3. Previously we considered corrective wave 4 as the triangle shaped, but now it looks like classical ABC. If this is correct, dump on dominance can continue, but the potential reversal signal has been flashed by the Bullish/Bearish Reversal Bar Indicator . This signal still has not been confirmed, but if candles will break 9% the huge rally in wave 5 is incoming - true altseason.
Best regards,
Skyrexio Team
___________________________________________________________
Please, boost this article and subscribe our page if you like analysis!

altseason??Alt season will likely grow less this time, and this is if Bitcoin is not accompanied by a correction. History will not definitely repeat itself, but there is a high probability that history will repeat itself.

