PENDLE / USDT preparing for next bullish leg up After FVG tapPendle / USDT is looking strong, but I’m expecting price to first tap the 4H FVG zone before continuing its trend towards $3 – $3.5…
A clean reaction from that zone can trigger the next bullish wave, so waiting for confirmation is important here. Momentum is still in favor of buyers, but entries sho
Related pairs

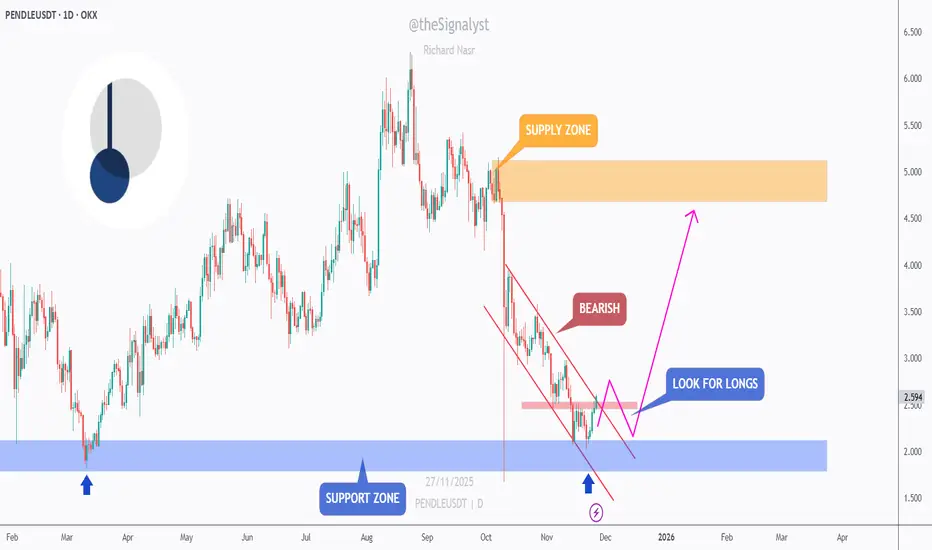
PENDLE - From Support to Setup… Bulls on Standby!📉PENDLE has been bearish for weeks, sliding inside a clean falling channel. But price is now reacting from a major support zone, the same area that initiated previous strong rallies earlier this year.
⚔️As long as this blue support zone holds, we will be looking for long setups, expecting a corr
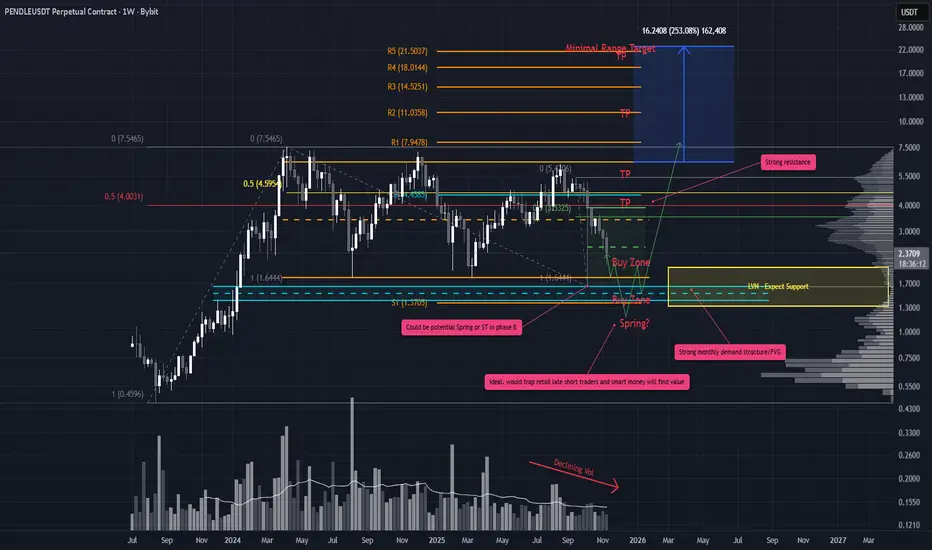
PENDLE/USDT - Major Reversal or Major Breakdown?Pendle is now approaching one of the most critical areas on its entire weekly chart.
After topping near 7.5 and forming a long distribution phase, price is sliding back toward the historical origin of its previous bull cycle — the 1.05–0.80 demand zone.
This yellow zone is not just another support.

PENDLEUSDT 1D#PENDLE has broken above the falling wedge pattern on the daily chart. The daily candle hasn’t closed yet, so the breakout is not fully confirmed. Keep an eye on it. If price dips back into the wedge, you can consider an additional buy on the support zone. If the breakout above the wedge confirms, t

It's time the ETH ecosystem gets some love. Leveraged beta plays
I'm going to go long ETH, and as a leveraged beta I'm taking a bet on PENDLE. It's like hating on D----ey world, Sometimes you might not like the decisions being made by the higher ups, but its still the top dawg L1.

PENDLE vs Bear BiasPENDLE’s chart is loaded with nuance right now. There’s a lot in play, and multiple paths could unfold from here so staying nimble and managing risk is key.
The October 10 flash crash left a deep wick at the bottom of the range. Price initially bounced back to ~$3.87 but has since retraced heavily
PENDLEUSDT Bearish Scenario (Continuation Downtrend):
Rationale: A sharp drop at the end of the chart indicates weak buyers; if it breaks lower, bearish momentum will continue.
Entry: Short below ~2,469 USDT (breakdown with a bearish candle close and high volume).
Alternative: Short on a pullback to ~3,105 USD

PENDLE - LONG SET-UPBINANCE:PENDLEUSDT
Looking good to Long
Entry Between 2.150 - 2.560
SL Below 1.791
Target above 3.5$
Lev & Margin As Per Your Risk Capacity

TradeCityPro | PENDLE: Near Breakout From Descending Trendline👋 Welcome to TradeCity Pro!
In this analysis, I want to review the PENDLE coin for you — one of the projects in the Ethereum ecosystem, currently ranked 93rd on CoinMarketCap with a market cap of $858.76 million.
📅 Daily Timeframe
On the daily timeframe, this coin has formed two trendlines. The mai

Pendle is at the top of the range...breakout?PENDLE could break out here. This issue with getting into fresh longs is that you are buying into resistance, tops. If it breaks resistance with volume, we likely seek an expansion into price discovery. If the price rejects, it is likely that the price revisits range lows. This is an inflection poin
See all ideas
Summarizing what the indicators are suggesting.
Oscillators
Neutral
SellBuy
Strong sellStrong buy
Strong sellSellNeutralBuyStrong buy
Oscillators
Neutral
SellBuy
Strong sellStrong buy
Strong sellSellNeutralBuyStrong buy
Summary
Neutral
SellBuy
Strong sellStrong buy
Strong sellSellNeutralBuyStrong buy
Summary
Neutral
SellBuy
Strong sellStrong buy
Strong sellSellNeutralBuyStrong buy
Summary
Neutral
SellBuy
Strong sellStrong buy
Strong sellSellNeutralBuyStrong buy
Moving Averages
Neutral
SellBuy
Strong sellStrong buy
Strong sellSellNeutralBuyStrong buy
Moving Averages
Neutral
SellBuy
Strong sellStrong buy
Strong sellSellNeutralBuyStrong buy
Displays a symbol's price movements over previous years to identify recurring trends.
Frequently Asked Questions
The current price of PENDLE / TetherUS (PENDLE) is 2.373 USDT — it has risen 1.18% in the past 24 hours. Try placing this info into the context by checking out what coins are also gaining and losing at the moment and seeing PENDLE price chart.
PENDLE / TetherUS price has fallen by −9.86% over the last week, its month performance shows a −13.79% decrease, and as for the last year, PENDLE / TetherUS has decreased by −64.81%. See more dynamics on PENDLE price chart.
Keep track of coins' changes with our Crypto Coins Heatmap.
Keep track of coins' changes with our Crypto Coins Heatmap.
PENDLE / TetherUS (PENDLE) reached its highest price on Apr 11, 2024 — it amounted to 7.538 USDT. Find more insights on the PENDLE price chart.
See the list of crypto gainers and choose what best fits your strategy.
See the list of crypto gainers and choose what best fits your strategy.
PENDLE / TetherUS (PENDLE) reached the lowest price of 0.465 USDT on Aug 17, 2023. View more PENDLE / TetherUS dynamics on the price chart.
See the list of crypto losers to find unexpected opportunities.
See the list of crypto losers to find unexpected opportunities.
The safest choice when buying PENDLE is to go to a well-known crypto exchange. Some of the popular names are Binance, Coinbase, Kraken. But you'll have to find a reliable broker and create an account first. You can trade PENDLE right from TradingView charts — just choose a broker and connect to your account.
Crypto markets are famous for their volatility, so one should study all the available stats before adding crypto assets to their portfolio. Very often it's technical analysis that comes in handy. We prepared technical ratings for PENDLE / TetherUS (PENDLE): today its technical analysis shows the sell signal, and according to the 1 week rating PENDLE shows the sell signal. And you'd better dig deeper and study 1 month rating too — it's sell. Find inspiration in PENDLE / TetherUS trading ideas and keep track of what's moving crypto markets with our crypto news feed.
PENDLE / TetherUS (PENDLE) is just as reliable as any other crypto asset — this corner of the world market is highly volatile. Today, for instance, PENDLE / TetherUS is estimated as 1.10% volatile. The only thing it means is that you must prepare and examine all available information before making a decision. And if you're not sure about PENDLE / TetherUS, you can find more inspiration in our curated watchlists.
You can discuss PENDLE / TetherUS (PENDLE) with other users in our public chats, Minds or in the comments to Ideas.