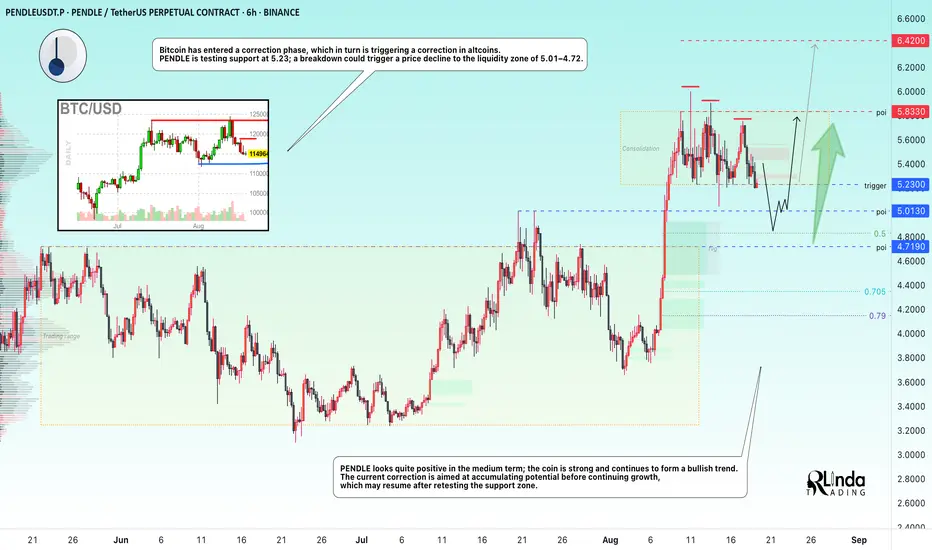
PENDLEUSDT → Retest of the 5.0 liquidity zone before rising to 7BINANCE:PENDLEUSDT is still consolidating, but is preparing to enter a correction phase, which could be triggered by a breakdown the 5.23 support level. Correction is a vital stage for further growth.
Bitcoin has entered a correction phase, which in turn is triggering a correction in altcoins.
Related pairs
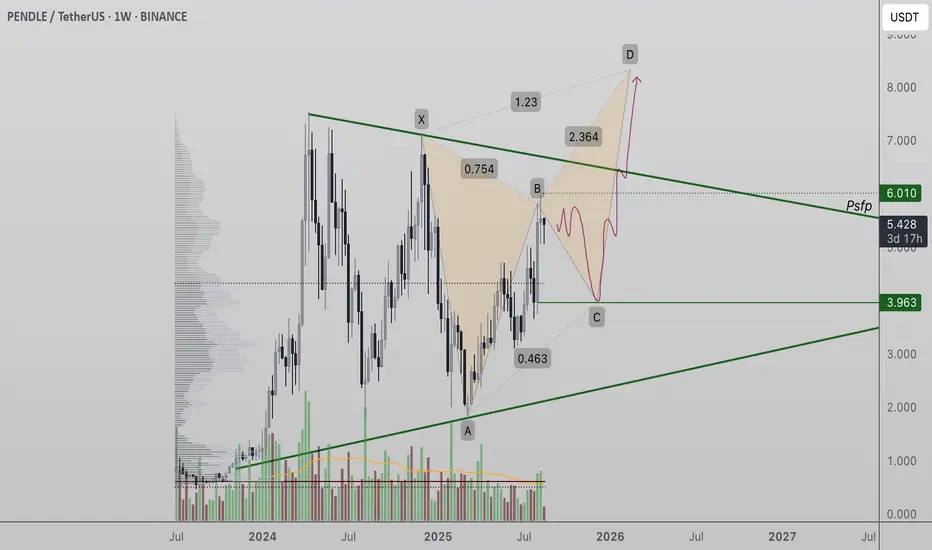
Pendle Consolidates in Weekly Equilibrium as Bulls Eye BreakoutPendle (PENDLE) is trading in a large equilibrium structure on the weekly time frame, with price action forming a potential bullish harmonic pattern. A sustained breakout could open the path toward $8 and higher.
Pendle’s weekly chart shows a market consolidating within a broad equilibrium zone, wh
PENDLEUSDT Bullish Flag Points to $6.8–$7 BreakoutPENDLEUSDT has formed a bullish flag pattern on the chart — a consolidation structure that often precedes continuation to the upside.
Once price breaks out of this flag, a move toward the $6.8–$7 zone is expected. This range represents the next resistance area and potential profit target.

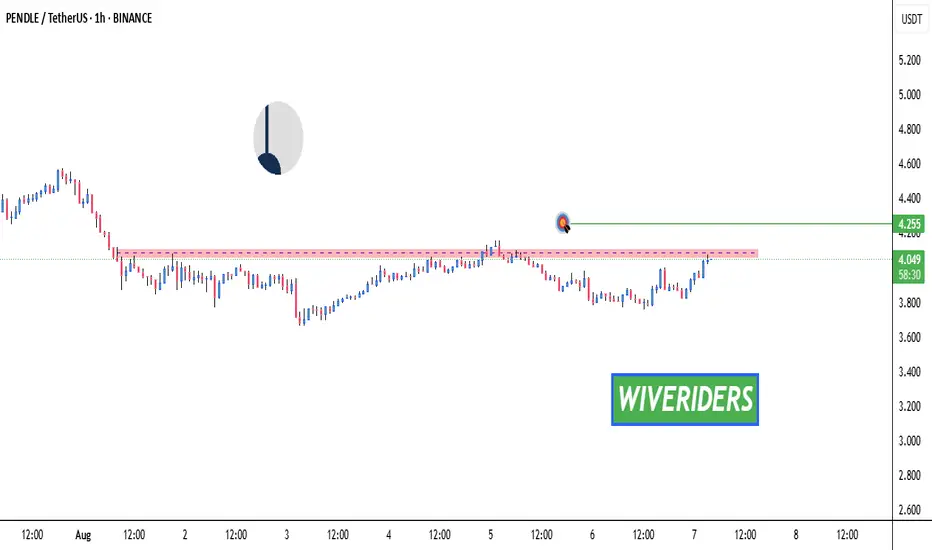
PENDLEUSDT Eyes Breakout Toward $7PENDLEUSDT is trending within a channel and has now reached the channel’s resistance, signaling a potential breakout toward the $7 level. Despite the recent BTC drop, PENDLE recovered fully — a sign of strong buyer interest.
A good risk-to-reward trade setup is possible here, with a stop-loss aroun

PENDLEUSDT at Channel SupportPENDLEUSDT is currently trading within an upward channel. Yesterday, the price pulled back to the channel support and formed a bullish engulfing candle, indicating potential continuation of the uptrend. A move toward the channel resistance appears likely.
A long trade can be considered with a stop-
PENDLE Breakout Alert! 🚨 CRYPTOCAP:PENDLE Breakout Alert! 🚨
CRYPTOCAP:PENDLE is currently testing the red resistance zone 🔴
If price breaks out, the first target will be the green line level 🎯
A confirmed breakout here would signal bullish continuation and open the way for further upside ✅

PENDLE price analysis📊 Here’s the full trading history of OKX:PENDLEUSDT
You can easily find all the info about the project in open sources — no need to waste time here, just DYOR 😉
Here’s our take:
What if #PENDLE correction is already in its final stage and what’s next is a 🚀 hyper growth cycle?
Our modest predict
$PENDLE Breakout Watch – Retesting Red Resistance Zone!🚨 CRYPTOCAP:PENDLE Breakout Watch – Retesting Red Resistance Zone! 🔴⏳
CRYPTOCAP:PENDLE is once again testing the red resistance zone.
📊 If breakout confirms, price could move toward:
🎯 First Target → Green line level
A confirmed breakout would suggest buyers are regaining control — watching c
PENDLE LONGFirstly, our Algo-based indicators are used to create this analysis:
This 4-hour chart for PENDLEUSDT highlights a potential short-term bullish outlook followed by a significant bearish opportunity at higher levels.
Analysis:
Current Situation: The price is currently trading around the 4.04

PENDLEUSDT 1D#PENDLE has broken above the symmetrical triangle resistance on the daily chart and has completed a successful retest.
Our targets for this breakout are:
🎯 $5.109
🎯 $6.006
🎯 $7.147
🎯 $7.803
🎯 $8.913
⚠️ As always, use a tight stop-loss and apply proper risk management.

See all ideas
Summarizing what the indicators are suggesting.
Oscillators
Neutral
SellBuy
Strong sellStrong buy
Strong sellSellNeutralBuyStrong buy
Oscillators
Neutral
SellBuy
Strong sellStrong buy
Strong sellSellNeutralBuyStrong buy
Summary
Neutral
SellBuy
Strong sellStrong buy
Strong sellSellNeutralBuyStrong buy
Summary
Neutral
SellBuy
Strong sellStrong buy
Strong sellSellNeutralBuyStrong buy
Summary
Neutral
SellBuy
Strong sellStrong buy
Strong sellSellNeutralBuyStrong buy
Moving Averages
Neutral
SellBuy
Strong sellStrong buy
Strong sellSellNeutralBuyStrong buy
Moving Averages
Neutral
SellBuy
Strong sellStrong buy
Strong sellSellNeutralBuyStrong buy
Displays a symbol's price movements over previous years to identify recurring trends.
Frequently Asked Questions
The current price of PENDLE / USDT (PENDLE) is 5.933 USDT — it has fallen −1.46% in the past 24 hours. Try placing this info into the context by checking out what coins are also gaining and losing at the moment and seeing PENDLE price chart.
PENDLE / USDT price has risen by 10.41% over the last week, its month performance shows a 40.80% increase, and as for the last year, PENDLE / USDT has increased by 84.37%. See more dynamics on PENDLE price chart.
Keep track of coins' changes with our Crypto Coins Heatmap.
Keep track of coins' changes with our Crypto Coins Heatmap.
PENDLE / USDT (PENDLE) reached its highest price on Apr 11, 2024 — it amounted to 7.538 USDT. Find more insights on the PENDLE price chart.
See the list of crypto gainers and choose what best fits your strategy.
See the list of crypto gainers and choose what best fits your strategy.
PENDLE / USDT (PENDLE) reached the lowest price of 0.465 USDT on Aug 17, 2023. View more PENDLE / USDT dynamics on the price chart.
See the list of crypto losers to find unexpected opportunities.
See the list of crypto losers to find unexpected opportunities.
The safest choice when buying PENDLE is to go to a well-known crypto exchange. Some of the popular names are Binance, Coinbase, Kraken. But you'll have to find a reliable broker and create an account first. You can trade PENDLE right from TradingView charts — just choose a broker and connect to your account.
Crypto markets are famous for their volatility, so one should study all the available stats before adding crypto assets to their portfolio. Very often it's technical analysis that comes in handy. We prepared technical ratings for PENDLE / USDT (PENDLE): today its technical analysis shows the buy signal, and according to the 1 week rating PENDLE shows the strong buy signal. And you'd better dig deeper and study 1 month rating too — it's strong buy. Find inspiration in PENDLE / USDT trading ideas and keep track of what's moving crypto markets with our crypto news feed.
PENDLE / USDT (PENDLE) is just as reliable as any other crypto asset — this corner of the world market is highly volatile. Today, for instance, PENDLE / USDT is estimated as 4.43% volatile. The only thing it means is that you must prepare and examine all available information before making a decision. And if you're not sure about PENDLE / USDT, you can find more inspiration in our curated watchlists.
You can discuss PENDLE / USDT (PENDLE) with other users in our public chats, Minds or in the comments to Ideas.