PEPE RSI Cools After Overbought Surge — Is a Pullback on the TabPEPE’s market cap currently stands at $3.77B, up 1.59% on the day. After a sharp upward move, the RSI (14) spiked above 75, signaling overbought conditions, and has now pulled back to the 44–58 range, indicating waning bullish pressure.
Quick breakdown:
RSI Peak: ~75.38 (recent top)
Current RSI:
Key data points
Previous close
—
Open
—
Day's range
—
About Market Cap PEPE, $
Coin

PEPE Market Cap Approaches Key Fib Resistance — Will the 0.236 LPEPE’s market cap is testing the 0.236 Fibonacci retracement level ($3.76B) after a strong upward move from ~$2.91B. The price is consolidating near the swing high at $3.91B, indicating possible exhaustion or gearing up for a breakout.
The MACD remains bullish for now, but the histogram shows wanin

MACD Hints at Momentum Shift in PEPE: Bearish Crossover or FakePEPE’s market cap has dipped to $3.82B on the 30-minute chart, and the MACD (12,26) shows a recent bearish crossover. The MACD line has fallen below the signal line, and the histogram has flipped red, signaling potential downside momentum building up.
Observations:
MACD Line: Trending below signal

PEPE Market Cap Eyes Breakout: Bollinger Band Squeeze Signals MoPEPE’s market cap on the 30-minute chart is entering a classic Bollinger Band squeeze, indicating reduced volatility and a potential breakout on the horizon. The bands have tightened significantly after a period of sideways consolidation, and the price is hovering near the middle band, showing indec

PEPE Bullish Reversal? Ichimoku Cloud Signals Potential BreakoutThe Ichimoku Cloud on the 4H chart for PEPE coin shows a compelling shift in momentum. The price recently pierced above the Kumo cloud, with the Tenkan-sen crossing above the Kijun-sen — a classic bullish signal. The Chikou span is free of price action, suggesting confirmation of upward trend moment

PEPE/USD – 30-Min Long Trade Setup !📈 🚀
🔹 Asset: PEPE (Market Cap)
🔹 Timeframe: 30-Min Chart
🔹 Setup Type: Bullish Reversal
📌 Trade Plan (Long Position)
✅ Entry: Above $3.18B (Breakout Confirmation)
✅ Stop-Loss: Below $3.08B (Break of Support)
🎯 Targets:
📌 TP1: $3.30B (First Resistance Level)
📌 TP2: $3.46B (Extended Bullish Move)
📊

$PEPE long!🐸 The prophecy foretold this moment! As we gaze upon the sacred TA, the ancient Fibonacci sages whisper—Pepe is at the bottom of the pond, ready to leap to the stars! 🚀
📈 The channel is tighter than Pepe’s grip on his meme kingdom, and the support is holding stronger than Wojak’s coping mechanisms.

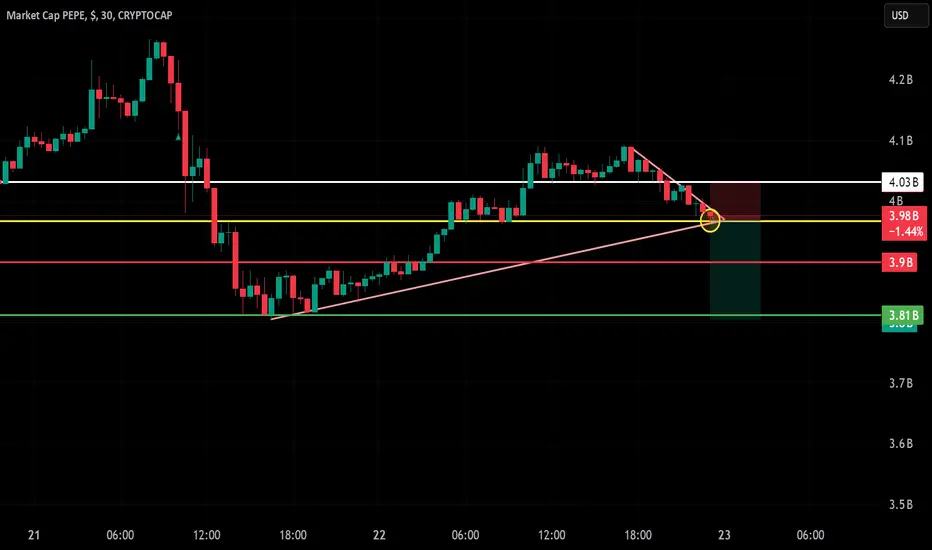
PEPE – 30-Min Short Trade Setup!📌
🔹 Asset: PEPE Market Cap (PEPE)
🔹 Timeframe: 30-Min Chart
🔹 Setup Type: Trendline Break & Bearish Continuation Trade
📌 Trade Plan (Short Position)
✅ Entry Zone: Below $3.97B (Breakdown Confirmation)
✅ Stop-Loss (SL): Above $4.03B (Break of Resistance & Trendline Retest)
🎯 Take Profit Targets
📌
PEPE – 30-Min Long Trade Setup!📌
🔹 Asset: PEPE Market Cap (PEPE)
🔹 Timeframe: 30-Min Chart
🔹 Setup Type: Rising Wedge Breakout & Trendline Support Long Trade
📌 Trade Plan (Long Position)
✅ Entry Zone: Above $4.22B (Breakout Confirmation)
✅ Stop-Loss (SL): Below $4.13B (Break of Support & Trendline)
🎯 Take Profit Targets
📌 TP1:


See all ideas
Summarizing what the indicators are suggesting.
Oscillators
Neutral
SellBuy
Strong sellStrong buy
Strong sellSellNeutralBuyStrong buy
Oscillators
Neutral
SellBuy
Strong sellStrong buy
Strong sellSellNeutralBuyStrong buy
Summary
Neutral
SellBuy
Strong sellStrong buy
Strong sellSellNeutralBuyStrong buy
Summary
Neutral
SellBuy
Strong sellStrong buy
Strong sellSellNeutralBuyStrong buy
Summary
Neutral
SellBuy
Strong sellStrong buy
Strong sellSellNeutralBuyStrong buy
Moving Averages
Neutral
SellBuy
Strong sellStrong buy
Strong sellSellNeutralBuyStrong buy
Moving Averages
Neutral
SellBuy
Strong sellStrong buy
Strong sellSellNeutralBuyStrong buy
Displays a symbol's price movements over previous years to identify recurring trends.