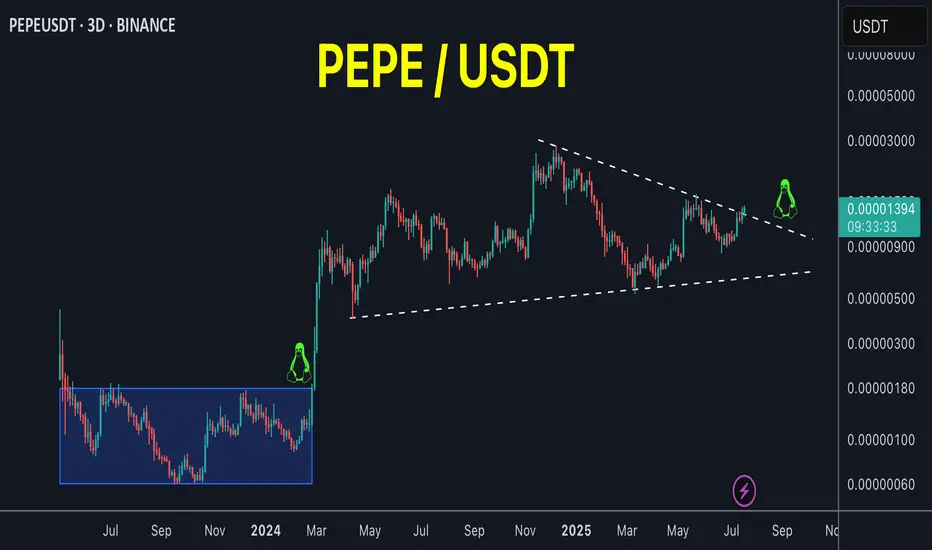
PEPE on the verge of breakout!PEPE / USDT
Price is trying to breakout massive downtrend line since 7 months
Incase of breakout we will see strong bullish momentum
Keep an eye on it
Related pairs
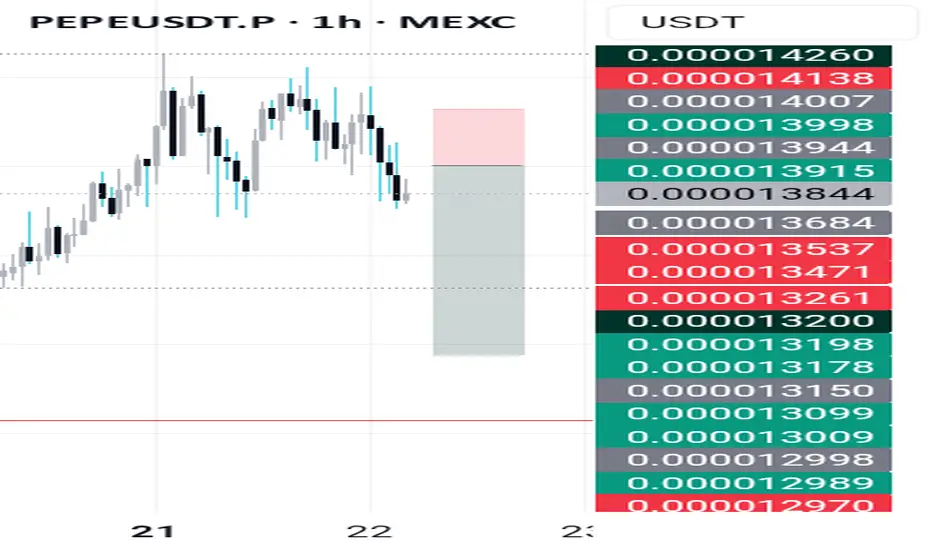
Bounce or Breakdown? PEPE Eyes 0.000016 Target!38% BounceHello✌
Let’s analyze PEPE memecoin’s upcoming price potential 📈.
BINANCE:PEPEUSDT is approaching a key daily support level, which also aligns with the 0.61 Fibonacci retracement. If this level holds, a potential bounce toward the 0.000016 area could offer around 38% upside. 📈🟢
✨We put lov


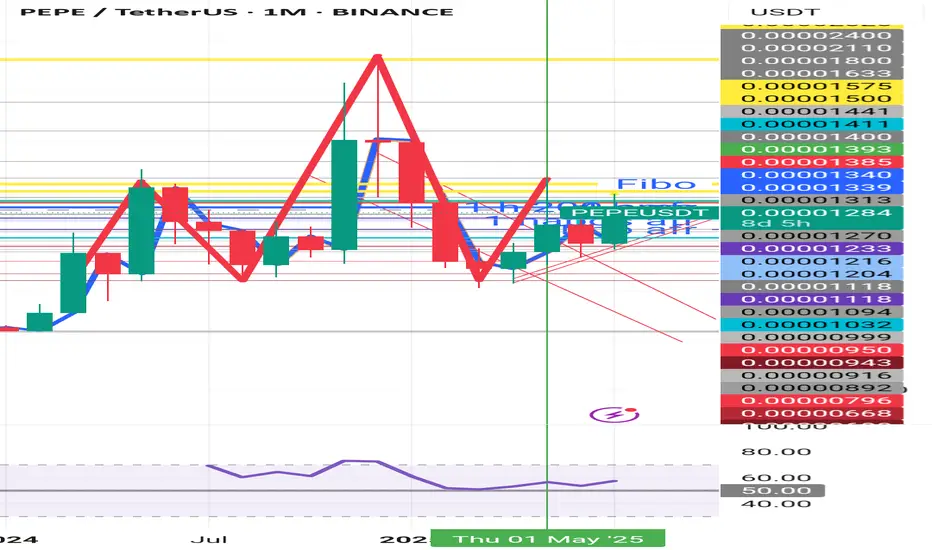
Was that all the offseason was for Pepe?PEPE
This is not a little suspicious to me. H&S is forming on a 1-month timeframe. I also discovered 4 divergences on a 4-hour timeframe looking back at the past few weeks, which may support my assumption that this is what the off-season was all about and a longer break may be in order.
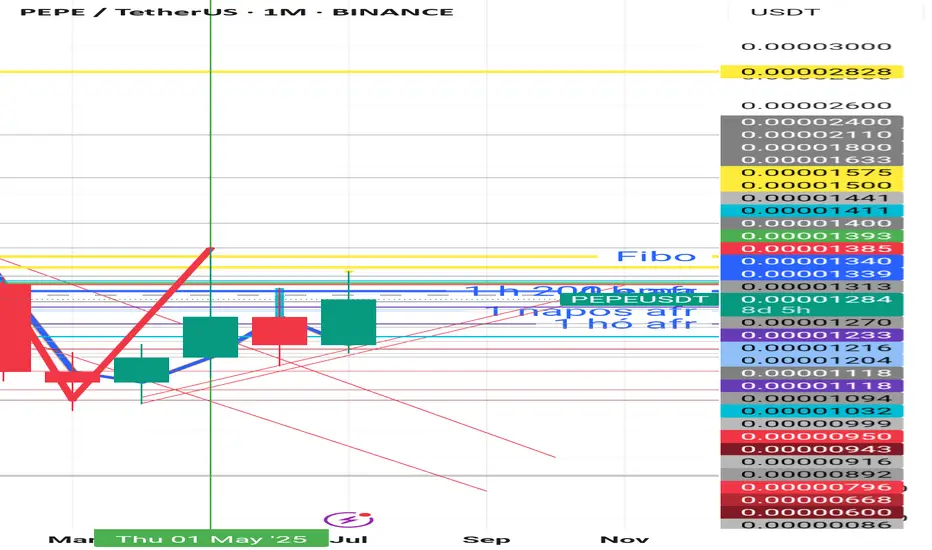
Is the alt season over at Pepe?PEPE
This is not a little suspicious to me. H&S is forming on a 1-month timeframe. I also discovered 4 divergences on a 4-hour timeframe looking back at the past few weeks, which may support my assumption that this is what the off-season was all about and a longer break may be in order.
PEPEUSDT – Downtrend Breakout & Golden Zone Retest in Play!📊 Chart Analysis:
On this daily timeframe chart of PEPEUSDT, price has successfully broken above the descending trendline that had capped the price since late 2024. This breakout is a strong early signal that bearish momentum is weakening and a potential trend reversal may be underway.
After the b

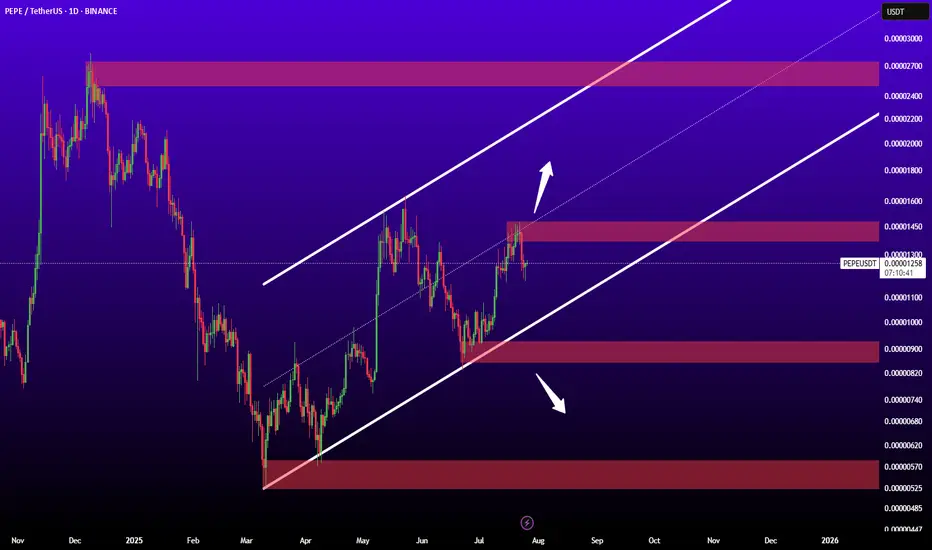
PEPEUSDTIf reaked midlle trend channel may ready for jump to nest levels.
Key levels:
0.00002700
0.0000145
0.00000900
0.00000570

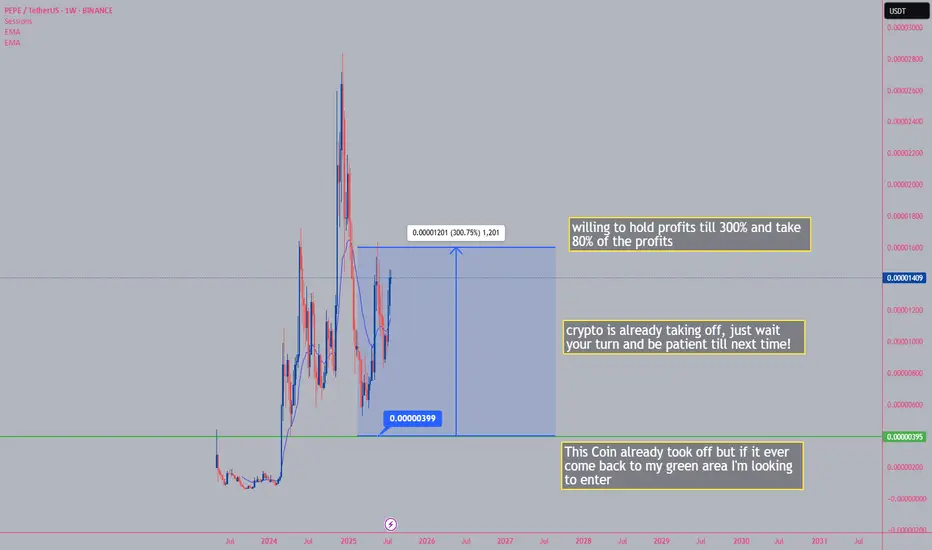
Crypto BOOMING What Does that Mean? PEPEI've entered crypto when it was low and it paid off it can take a long time, but you will make your profit back and some more as long as your patient I see this making 300% later if it comes back to my sweet spot
BINANCE:PEPEUSDT
See all ideas
Summarizing what the indicators are suggesting.
Oscillators
Neutral
SellBuy
Strong sellStrong buy
Strong sellSellNeutralBuyStrong buy
Oscillators
Neutral
SellBuy
Strong sellStrong buy
Strong sellSellNeutralBuyStrong buy
Summary
Neutral
SellBuy
Strong sellStrong buy
Strong sellSellNeutralBuyStrong buy
Summary
Neutral
SellBuy
Strong sellStrong buy
Strong sellSellNeutralBuyStrong buy
Summary
Neutral
SellBuy
Strong sellStrong buy
Strong sellSellNeutralBuyStrong buy
Moving Averages
Neutral
SellBuy
Strong sellStrong buy
Strong sellSellNeutralBuyStrong buy
Moving Averages
Neutral
SellBuy
Strong sellStrong buy
Strong sellSellNeutralBuyStrong buy
Displays a symbol's price movements over previous years to identify recurring trends.
Frequently Asked Questions
The current price of PEPE / TETHER (PEPE) is 0.0000129216 USDT — it has risen 1.79% in the past 24 hours. Try placing this info into the context by checking out what coins are also gaining and losing at the moment and seeing PEPE price chart.
PEPE / TETHER price has fallen by −6.02% over the last week, its month performance shows a 37.77% increase, and as for the last year, PEPE / TETHER has increased by 8.66%. See more dynamics on PEPE price chart.
Keep track of coins' changes with our Crypto Coins Heatmap.
Keep track of coins' changes with our Crypto Coins Heatmap.
PEPE / TETHER (PEPE) reached its highest price on Dec 9, 2024 — it amounted to 0.0000283998 USDT. Find more insights on the PEPE price chart.
See the list of crypto gainers and choose what best fits your strategy.
See the list of crypto gainers and choose what best fits your strategy.
PEPE / TETHER (PEPE) reached the lowest price of 0.0000001710 USDT on Apr 21, 2023. View more PEPE / TETHER dynamics on the price chart.
See the list of crypto losers to find unexpected opportunities.
See the list of crypto losers to find unexpected opportunities.
The safest choice when buying PEPE is to go to a well-known crypto exchange. Some of the popular names are Binance, Coinbase, Kraken. But you'll have to find a reliable broker and create an account first. You can trade PEPE right from TradingView charts — just choose a broker and connect to your account.
Crypto markets are famous for their volatility, so one should study all the available stats before adding crypto assets to their portfolio. Very often it's technical analysis that comes in handy. We prepared technical ratings for PEPE / TETHER (PEPE): today its technical analysis shows the buy signal, and according to the 1 week rating PEPE shows the strong buy signal. And you'd better dig deeper and study 1 month rating too — it's strong buy. Find inspiration in PEPE / TETHER trading ideas and keep track of what's moving crypto markets with our crypto news feed.
PEPE / TETHER (PEPE) is just as reliable as any other crypto asset — this corner of the world market is highly volatile. Today, for instance, PEPE / TETHER is estimated as 4.51% volatile. The only thing it means is that you must prepare and examine all available information before making a decision. And if you're not sure about PEPE / TETHER, you can find more inspiration in our curated watchlists.
You can discuss PEPE / TETHER (PEPE) with other users in our public chats, Minds or in the comments to Ideas.