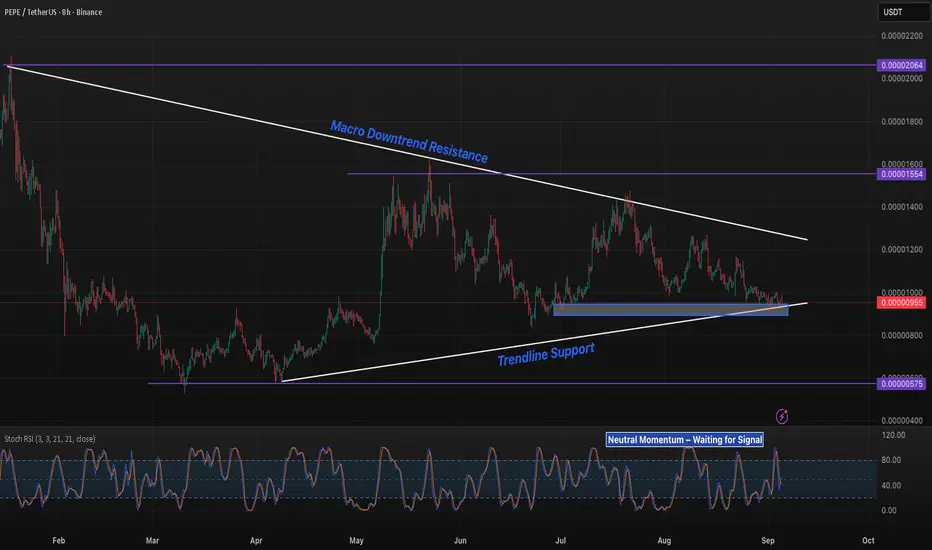
PEPE 8H – Compressing Between Trendlines, Liquidity Above 15–20PEPE is consolidating inside a tightening wedge between descending resistance and rising trendline support. Price is currently reacting at the demand zone near 0.0000095.
Upside resolution would target liquidity levels at 0.0000155 and 0.0000206. A breakdown, however, exposes lower liquidity at 0.0
Related pairs

PEPE 4H – Testing Key Demand Zone, Can 9.5–9.8s Hold the Floor?PEPE continues to consolidate on the 4H chart, pressing into the major demand zone between 0.00000950–0.00000980. This area has acted as the base of multiple rebounds since early August, making it the most critical level on the short-term chart.
EMA Structure: Price remains suppressed below the 20/

Can PEPE make a new ATH?!PEPE came out during the APR-2023 Bear Market and was an instant hit meme in the community. PEPE has already made a +5000% gain from its inception to current price point of 0.00000991.
PEPE is currently in a ' symmetrical triangle ' which is typically regarded as a neutral pattern with price cons

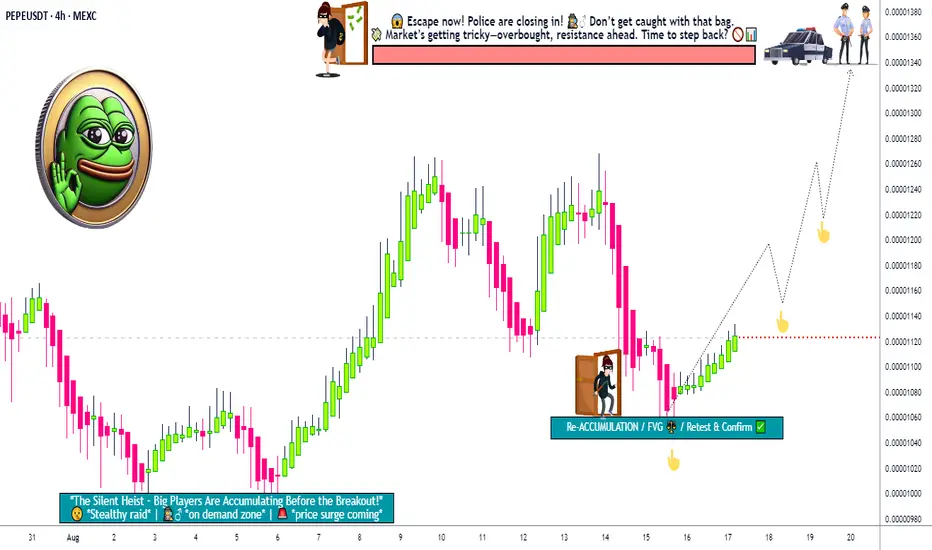
PEPE Bullish Attack Plan – Layer Entry, Escape Before Trap!💚🐸 PEPE/USDT Crypto Market Heist Plan 🕵️♂️💰
🌍 Hello Thief OG’s, Market Robbers & Money Grabbers!
Today we prepare a Bullish Heist on the PEPE/USDT Crypto Market – vault doors are open, the police are distracted, and the layers are waiting! 🚨💸
🏦 Entry Plan (Thief Layer Strategy) 📈
We don’t enter o
pepe will hit 0.00005 in next 4 month !! buy in 0.0000040pepe is one of the most bullish altcoins in this year. pepe has been completed its main wave 1 from Elliott's wave theory. I think the price will drop to 0.0000040 (due to Bitcoin price correction which may correct to $100k) and this point is the end point of wave 2. Wait and buy pepe at this time.

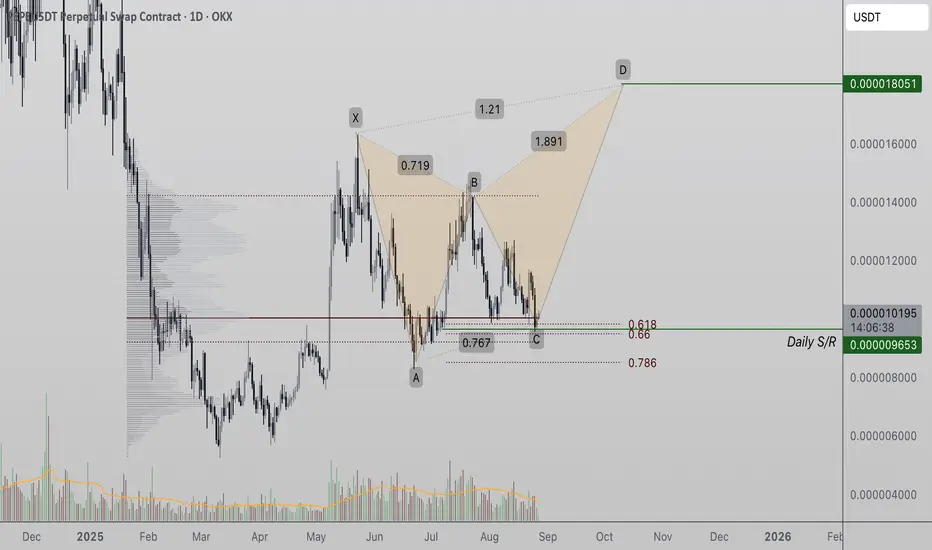
Pepe Shows Bullish C-to-D Extension Pattern With Potential RallyPepe (PEPE) is forming a bullish C-leg to D-leg extension while trading at daily support. With multiple technical confluences in play, the setup suggests potential for an impulsive rally higher.
Pepe’s price action is currently consolidating at a crucial support zone that holds multiple bullish tec
Critical PEPE/USDT – Bullish Reversal or Bearish Continuation?🔎 Overview
PEPE/USDT is currently trading around 0.000010155, sitting right at a key demand zone (0.00000950 – 0.00001100) that previously acted as a major resistance and is now being retested as support.
This zone is a decision point that will likely define whether the market builds a bullish base

Idea for PepeFor CRYPTOCAP:PEPE #PEPE, it looks like the main nearby long trader liquidations have been collected, and the next target seems to be the liquidation of short traders at a price of $0.000010000 (+6%) from the entry point.
Let’s see how it plays out.
Entry price: $0.000009445
Take Profit: $0.000

Pepe longs Pepe longs
Loading here
Looking for a breakout at 0.000011696
Targets
0.000014834
0.000016352
0.000028417
Possibly breaking all time highs.

See all ideas
Summarizing what the indicators are suggesting.
Oscillators
Neutral
SellBuy
Strong sellStrong buy
Strong sellSellNeutralBuyStrong buy
Oscillators
Neutral
SellBuy
Strong sellStrong buy
Strong sellSellNeutralBuyStrong buy
Summary
Neutral
SellBuy
Strong sellStrong buy
Strong sellSellNeutralBuyStrong buy
Summary
Neutral
SellBuy
Strong sellStrong buy
Strong sellSellNeutralBuyStrong buy
Summary
Neutral
SellBuy
Strong sellStrong buy
Strong sellSellNeutralBuyStrong buy
Moving Averages
Neutral
SellBuy
Strong sellStrong buy
Strong sellSellNeutralBuyStrong buy
Moving Averages
Neutral
SellBuy
Strong sellStrong buy
Strong sellSellNeutralBuyStrong buy
Displays a symbol's price movements over previous years to identify recurring trends.
Frequently Asked Questions
The current price of Pepe / USDT (PEPE) is 0.00000957 USDT — it has fallen −1.54% in the past 24 hours. Try placing this info into the context by checking out what coins are also gaining and losing at the moment and seeing PEPE price chart.
Pepe / USDT price has fallen by −1.84% over the last week, its month performance shows a −9.19% decrease, and as for the last year, Pepe / USDT has increased by 34.73%. See more dynamics on PEPE price chart.
Keep track of coins' changes with our Crypto Coins Heatmap.
Keep track of coins' changes with our Crypto Coins Heatmap.
Pepe / USDT (PEPE) reached its highest price on Dec 9, 2024 — it amounted to 0.00002837 USDT. Find more insights on the PEPE price chart.
See the list of crypto gainers and choose what best fits your strategy.
See the list of crypto gainers and choose what best fits your strategy.
Pepe / USDT (PEPE) reached the lowest price of 0.00000019 USDT on Apr 19, 2023. View more Pepe / USDT dynamics on the price chart.
See the list of crypto losers to find unexpected opportunities.
See the list of crypto losers to find unexpected opportunities.
The safest choice when buying PEPE is to go to a well-known crypto exchange. Some of the popular names are Binance, Coinbase, Kraken. But you'll have to find a reliable broker and create an account first. You can trade PEPE right from TradingView charts — just choose a broker and connect to your account.
Crypto markets are famous for their volatility, so one should study all the available stats before adding crypto assets to their portfolio. Very often it's technical analysis that comes in handy. We prepared technical ratings for Pepe / USDT (PEPE): today its technical analysis shows the strong sell signal, and according to the 1 week rating PEPE shows the sell signal. And you'd better dig deeper and study 1 month rating too — it's sell. Find inspiration in Pepe / USDT trading ideas and keep track of what's moving crypto markets with our crypto news feed.
Pepe / USDT (PEPE) is just as reliable as any other crypto asset — this corner of the world market is highly volatile. Today, for instance, Pepe / USDT is estimated as 2.62% volatile. The only thing it means is that you must prepare and examine all available information before making a decision. And if you're not sure about Pepe / USDT, you can find more inspiration in our curated watchlists.
You can discuss Pepe / USDT (PEPE) with other users in our public chats, Minds or in the comments to Ideas.