PIPPIN – Possible Short Move Up?Alright traders, hear me out.
PIPPIN had a great run,
profits were taken,
hands were shaken,
and yes… we got the pullback. 😅
But — and there’s always a but in crypto —
after taking some liquidity on the downside,
we could easily see a small relief rally up.
Nothing crazy.
Nothing moon-like.
Just a short, respectful bounce.
This move could happen before tomorrow’s macro,
and if it doesn’t…
I’ll simply cancel the idea and move on. No drama. 😄
That’s it:
• quick idea
• quick move
• quick decision
Let’s see if PIPPIN gives us one more little push.
Good luck traders — and manage your risk! 🚀📉
Market insights


PIPPIN USDT SHORT SIGNAL📢 Official Trade Signal – PIPPIN/USDT
📉 Position Type: SHORT
💰 Entry Price: 0.31266
🎯 Take-Profit Targets (Partial Exits)
• TP1: 0.29911
• TP2: 0.27687
• TP3: 0.25235
• TP4: 0.21886
• TP5: —
• TP6: —
🛑 Stop-Loss: 0.34031
📊 Timeframe: 15m
⚖️ Risk/Reward Ratio: —
💥 Suggested Leverage: 3× – 5×
🧠 Technical Analysis Summary
PIPPIN is under strong selling pressure after rejection from the 0.33–0.34 supply zone.
On the 15m timeframe, price structure has shifted bearish with a clear lower-high formation and breakdown of short-term support.
Liquidity zones below current price align with our TP levels:
0.29911 → initial liquidity sweep
0.27687 → continuation level
0.25235 → major downside liquidity
0.21886 → extended bearish target
A confirmed break below 0.3000 (TP1) can accelerate momentum toward deeper downside targets.
⚙️ Trade Management Rules
✔️ Take partial profit at TP1
✔️ Move SL to Break-Even once TP1 is reached
✔️ Trail SL as price approaches TP2–TP4
✔️ Do not re-enter if SL (0.34031) is hit
✔️ Always confirm bearish structure before entry
⚠️ Risk-Management Note
After TP1 → SL must be moved to Break-Even.
If price hits TP1 and then reverses to BE, it is not a losing trade — capital protection comes first.
📌 TradingView Hashtags
#PIPPINUSDT #PIPPIN #CryptoSignal #ShortSetup
#TradingView #FuturesTrading #TechnicalAnalysis

SHORT – PIPPIN🐻 SHORT – PIPPIN
A violent divergence has formed on the 4H timeframe, signaling structural weakness. Prolonged and extreme conditions point to exhaustion, increasing the probability of a sharp and fast downside move. Momentum deterioration aligns with a high-risk, high-reward short thesis.
🎯 TP: 0.01648
🛡️ SL: 0.50
📊 RR: 1 : 10.93
A conviction short: 4H divergence + sustained extremes → elevated reversal risk with asymmetric downside potential.

$PIPPIN: Ze Pump or Cooling Off?While much of the meme space has been choppy or outright weak, PIPPIN has held up notably well. On-chain activity suggests coordinated flow, with behavior that looks more like structured accumulation than organic retail buying. Price action doesn’t seem driven by broad retail demand; it appears tied to tight supply control instead. Supply still looks constrained, holders remain in place, and the overall structure hasn’t broken. Even with a soft macro backdrop, PIPPIN continues to trade on its own on-chain dynamics.
TECHNICAL OUTLOOK:
On the 4-hour chart, PIPPIN continues to show clean bullish continuation after breaking above prior structure. Does PIPPIN keep pushing higher, or is a brief reset due?
A push toward the 0.50–0.52 area is still possible here before any pullback, with a potential retrace into the $0.38–0.35 zone. As long as price holds above that area, the broader structure stays bullish, keeping higher levels firmly in play.

PIPPIN Update🚨📊 PIPPIN Update
PIPPIN is approaching the red resistance zone 🔴 again,
and this area remains critical.
A clean breakout above could shift momentum bullish,
but rejection here would keep the trend weak.
Watch how price reacts at this zone. 👀

The Big Short PIPPINUSDTThe Big Short PIPPINUSDT
Market Context
This idea is based on price structure, cycle, and confluence.
It represents a probability based scenario, not investment advice.
Higher timeframe context: D1
Price is currently reacting near a key technical level.
Strategy
Strategy name: The Big Short
This setup focuses on short confluence signals at higher timeframe extremes.
When multiple conditions align, price may move quickly.
Leverage amplifies both risk and reward.
Risk management is mandatory.
Entry Method
The position is split into multiple parts to reduce execution risk.
Example allocation:
30 percent
30 percent
30 percent
10 percent kept as cash reserve
No chasing.
No full size entry at once.
Signal Details
Signal type: Short confluence at D1 top
Entry zone: 0.34 to 0.49
Possible management plans:
Partial profit taking on spot
Risk defined leverage execution
Alternative scenario: continuation toward 0.15 to 0.20 if structure holds
Time Expectation
Estimated duration: 3 to 5 days
This idea follows the current cycle, not intraday noise.
Risk Note
Always define invalidation before entry.
If structure fails, the idea is invalid.
Capital protection comes first.

Short Pippin UsdPippin usd Short open as we large liquidity grab . It will Give a re enter chance as it might try to tick above the last candle high and come down fast then

Road to 0.83After a period of sideways consolidation, PIPPINUSDT has broken out from its short‑term accumulation range and is now attempting to establish a new higher low above the mid‑support zone around 0.1930.
From a classical technical perspective, this move shows the early phase of a potential impulsive recovery pattern. As long as price holds above the red support area, the breakout remains valid.
Key technical notes:
Support: 0.1930 – Previous resistance turned support
Interim Resistance: 0.3480 – Fib projection / top of the latest swing
Final Target: 0.8300 – Long‑term structural target based on full swing‑extension
Invalidation: A daily close back below 0.1850
The overall structure hints at the formation of a new wave‑sequence (A–B–C type), with buyers attempting to build strength for the next expansion leg.
Trading Plan (Conceptual Only):
If the structure continues respecting higher lows, the setup favors further accumulation toward 0.35–0.40, followed by an extension into the 0.83 major target zone.

Short points I keep it simple and logical, short only at these point as mentioned in fib levels , keep you risk check ✅ think always about the worse Case scenario. Would be glad to know your thoughts 🤔

Bullish, but not as strong as before.Hey guys, PIPPINUSDT just printed an absolute monster move, surging 60.50% in the last 24 hours from a low of $0.2200 to a high of $0.3966 before settling around $0.3571. This kind of explosive price action demands careful analysis because while the gains look incredible, the real question is whether we're looking at sustainable momentum or a classic pump setup ready to dump on latecomers.
Let's start with the trend structure, which is honestly pretty clean for such a volatile move. Price is holding above all three major exponential moving averages: EMA20 at $0.3249, EMA50 at $0.2758, and EMA200 at $0.2066. This creates what we call a bullish EMA stack, where faster averages sit above slower ones, and price maintains position above all of them. It's textbook trending behavior and exactly what you want to see if you're positioned long or looking for continuation entries.
The ADX is reading 57.2, which confirms we're in a strong trending environment rather than choppy consolidation. When ADX pushes above 50, it's telling you there's genuine directional conviction in the market, not just noise. Right now that direction is clearly bullish, supported by the internal market state showing a 5-to-1 bull-to-bear stack ratio. The directional confidence sits at 33.6%, which might seem low, but given the mixed signals from MACD and volume, it's actually reasonable - the trend is up, but momentum indicators are flashing some yellow flags.
Speaking of momentum, let's dive into the RSI and MACD situation. RSI at 64.7 is sitting comfortably in neutral territory, which is actually bullish because it means we've got room to run before hitting overbought conditions around 70-75 where profit-taking typically accelerates. We're not seeing extreme readings that would suggest an imminent reversal. However, the MACD is showing a bearish crossover with the MACD line at 0.0272 sitting below the signal line at 0.0308. This divergence often precedes short-term consolidation or pullbacks, especially after parabolic moves like we just witnessed. It's not screaming reversal, but it's definitely suggesting we might need to digest these gains before the next leg higher.
The Bollinger Bands are painting a really clear picture of the current price structure. Upper band sits at $0.3704, middle band (which is basically a 20-period SMA) at $0.3318, and lower band at $0.2932. Price is currently trading above the middle band but well below the upper band after getting rejected from $0.3966. That massive 19.4% upper wick from the session high is significant - it shows heavy supply came in at those elevated levels, and sellers were aggressive enough to push price down substantially. Compare that to the tiny 3.6% lower wick, and you can see buyers are still defending dips with conviction. The battle right now is whether bulls can reclaim that upper Bollinger Band at $0.3704 or if we consolidate/correct toward the middle band support.
Volume analysis is where things get a bit concerning for the immediate bullish case. Current volume sits at $152.9M, which is below the average of $214M. After a 60% rally, you'd ideally want to see sustained or increasing volume to confirm the move has legs. Declining volume after explosive gains often suggests the initial wave of buyers is exhausted, and we need fresh capital to push higher. The MFI (Money Flow Index) at 55.7 is neutral, not showing extreme buying or selling pressure, which keeps both continuation and correction scenarios on the table. We're not seeing the kind of volume capitulation that would signal a top, but we're also not seeing the accumulation that would confirm the next leg up is ready to fire.
From a support and resistance perspective, here are your critical levels to watch. Immediate support sits at the EMA20 around $0.3249, which has been tested and held multiple times during this rally. Below that, you've got the middle Bollinger Band at $0.3318 acting as a secondary support zone. If both of those fail, the EMA50 at $0.2758 becomes your major support, and breaking that would likely invalidate the bullish structure and trigger a deeper correction toward the lower Bollinger Band at $0.2932. On the resistance side, the immediate ceiling is that Bollinger upper band at $0.3704. Reclaiming this level with volume would open the door to retest the session high at $0.3966, which is now a proven supply zone. Breaking above $0.3966 would be incredibly bullish and could trigger FOMO buying toward psychological resistance at $0.4000 and potentially $0.4100+ if momentum really accelerates.
For anyone looking to trade this setup, here's how I'd structure it. Entry zone would be on a pullback to $0.3350-$0.3400, ideally coinciding with a test of the middle Bollinger Band or EMA20. This gives you a better risk-reward than chasing current levels. Stop loss needs to sit below $0.3180, just under the EMA20 with enough breathing room to avoid getting stopped out by normal volatility and wick action. Your target progression should be scaled: TP1 at $0.3750 (retest of Bollinger upper band and psychological resistance), TP2 at $0.3900 (approaching previous high), and TP3 at $0.4100 for the aggressive holders chasing extension moves. That structure gives you roughly 2.5:1 risk-reward on the conservative first target, scaling up to 4:1 if this catches another wave of momentum. Consider taking partial profits at each level and trailing your stop as price advances.
The bull case here is straightforward: strong ADX-confirmed trend, clean EMA alignment, RSI with room to expand, support levels holding firm, and overall market structure favoring continuation. If volume returns above average levels and we reclaim $0.3704 with authority, this setup could easily push toward $0.40-$0.42 as retail FOMO kicks in. The bear case centers on that MACD bearish divergence, declining volume, and the massive supply that showed up at $0.3966. If we break below EMA20 at $0.3249 on increasing volume, it would likely trigger stops and send price down to test EMA50 around $0.2758, potentially even the lower Bollinger Band at $0.2932 if selling accelerates.
Overall confidence on the bullish continuation sits around 67% - we've got more factors supporting upside than downside, but those momentum divergences and volume concerns keep this from being a slam-dunk high-conviction setup. The trend is your friend until it bends, and right now the trend is still intact despite some warning signs. Risk management is crucial here given the volatility and the parabolic nature of the recent move.
How are you playing this move - waiting for a deeper pullback or riding the momentum?

PIPPIN Range Trading SetupAlright traders, BTC is stuck in a range,
and when BTC ranges…
alts usually follow like obedient little ducks. 🦆
So PIPPIN?
Yeah — range mode activated.
Yesterday’s macros showed a tiny bit of strength,
but nothing spicy enough to trigger a real breakout —
neither on BTC nor on most alts.
With no major macro today,
I’m expecting good old-fashioned range trading —
probably today and through the weekend.
BUT…
this is crypto,
so everything is calm until Trump decides to tweet something
and the entire market forgets what a range is. 😂
So trade the box,
take quick profits,
and stay cautious.
⸻
👉 Range trades only
👉 Risk management ON
👉 Alert notifications ready
Good luck traders — may the range respect your levels 😄📈📉

PIPPIN/USDT — Massive Accumulation Base Breaking After 10 MonthsNovember 29, 2025
PIPPIN has spent almost the entire year trapped inside one of the most extended accumulation ranges in its chart history.
Now, for the first time since early 2025, it is breaking above the key resistance zone that capped every rally attempt.
This is the cleanest, strongest bullish shift the chart has shown all year.
🔍 Technical Overview
Current price: ~$0.095
4EMA cluster: ~$0.05 – $0.03 – $0.02
→ Price is well above all EMAs, indicating strong trend momentum.
Volume has exploded during the breakout phase → clear sign of real demand entering the market.
📊 Market Structure Breakdown
1. Long-term accumulation (March → November)
For nearly nine months, PIPPIN consolidated inside the same horizontal structure:
Support: ~$0.055–0.056
Resistance: ~$0.085–0.095
This range acted as a multi-month compression where volatility became extremely tight and liquidity dried out — the classic precursor to expansion.
2. First serious breakout attempt (mid–November)
Price tested the upper boundary multiple times before finally breaking above it:
Strong impulsive candles
Rising volume
No sharp rejection wicks
This indicates the breakout is driven by genuine buyers rather than a simple liquidity grab.
3. Retest + continuation setup
After touching the breakout zone, PIPPIN pulled back slightly but:
Held perfectly above the blue range
Maintained higher lows
Stayed above the 4EMA stack
This confirms a bullish market structure flip.
Above $0.089–0.095, the chart remains in a full expansion phase.
🧱 Key Levels
Major Support Zones
$0.089–0.095 → breakout zone (must hold)
$0.055–0.056 → bottom of the long-term accumulation
EMAs rising below price → dynamic support on any retrace
As long as PIPPIN stays above $0.089, the trend remains strongly bullish.
Upside Targets / Resistance Ahead
$0.1156 → minor resistance (current area)
$0.1809 → next major structural level
$0.30–0.32 → large historical supply zone (final target of this cycle)
This upper zone has been untouched since January — it’s the ultimate magnet if momentum continues.
🎯 Outlook
PIPPIN has officially transitioned from accumulation → breakout → expansion.
Bullish if:
Price holds above $0.089–0.095
EMAs continue to slope upward
Volume remains elevated on green candles
In this case, the next target is $0.115 → $0.18, with a possible push toward $0.30 later.
Bearish only if:
Price falls back under $0.089
Re-enters the blue range
Loses EMAs support
This would delay the breakout, not invalidate the entire structure.
good trading to all :-)

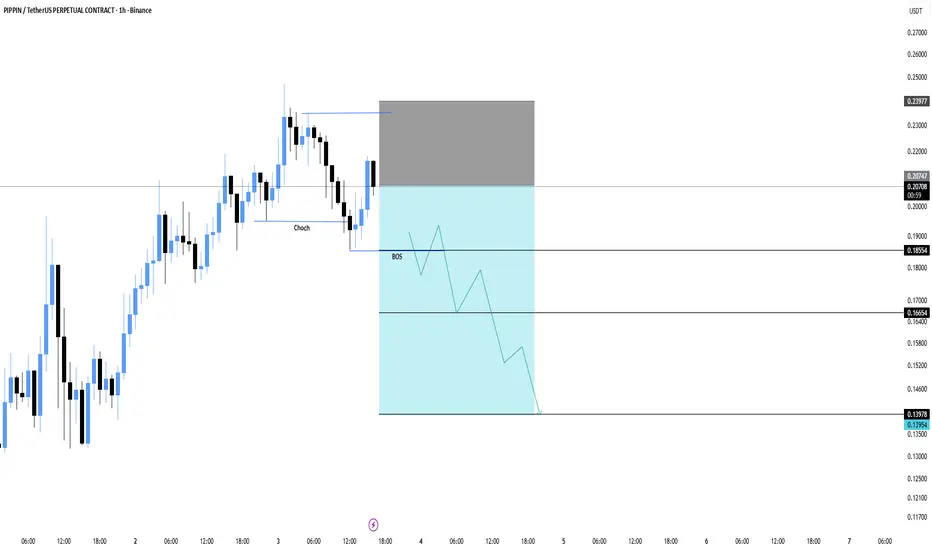
PIPPIN/USDT – Clean Short Setup, Dump Is coming!Price has shown a clear CHoCH followed by a BOS, confirming bearish structure. Current move is a retracement into the supply zone, giving a straightforward continuation-short opportunity.
Entry: 0.20747
Stop Loss: 0.23977
TP1: 0.18554
TP2: 0.16654
Final TP: 0.13978
PIPPIN short 4h divergence testShorting against trend is a bad idea, but we have tw to test evne our worst ideas, so let's see how it works!
Reasons for a short:
Retail long ratio is rising, meaning FOMO longs are entering at the top (smart money usually sells into this).
Price hit the resistance zone (0.195–0.205) where parabolic moves normally stops.
Open Interest is falling and the coin price rises, showing the pump is driven by liquidations, not by a real buyers.
Volume is going down.
Indicators (RSI/MACD) show divergence, confirming slowing momentum.

Scalp SHORT – PIPPIN🐻 Scalp SHORT – PIPPIN
“Price climbs the stairs but takes the elevator down” — and Pippin looks ready for that elevator.
RSI is extremely overbought across all timeframes, with the daily RSI hitting 95. On the 4H and 1H, multiple strong bearish divergences have formed, signaling exhaustion of buying pressure and a likely top. A sharp downside move can be triggered at any moment.
🎯 TP: 0.01614
🛡️ SL: 0.25765
📊 RR: 1 : 4.72
A textbook short setup: extreme overbought conditions + multi-timeframe bearish divergence → high probability of a strong correction.

PIPPIN/USDT — Path Toward $0.50 with 500M Market Cap PotentialPIPPIN/USDT — Path Toward $0.50 with 500M Market Cap Potential 🚀
PIPPIN is currently showing early structural strength after a long accumulation phase.
Based on current supply metrics and market behavior, a 500M market cap could push the price toward the $0.50 zone, representing a major expansion phase from current levels.
📊 Market Structure Overview:
Current base forming near $0.028
Next psychological and technical targets at $0.33 → $0.50
The $0.50 region aligns with ~500M market cap potential
If momentum continues building, PIPPIN could be entering a stage where new capital inflows drive a high-multiple move, similar to its previous historical run.
💡 Observation: The chart shows similar accumulation and volume buildup patterns seen before large runs — a breakout could mark the start of a new growth cycle.
📈 Outlook: Bullish scenario toward $0.50
🎯 Market Cap Target: 500M

PIPPIN 2H Bearish Divergence near 0.5 Fib ResistancePrice is in a strong uptrend, but it has reached the 0.5 Fibonacci level at 0.16345. This area is acting as resistance. At the same time, RSI shows a clear bearish divergence, price made a higher high and RSI made a lower high. This signals that momentum is slowing down, same as volume does.
The zone between 0.10 and 0.15 has almost no volume, so price can drive fast both up or down ignoring this area.
Main demand is still much lower, near 0.06, so we could also touch it, but before that we have to consider closer reaction zones and trade in trend.
Right now I see two scenarios:
1. Pullback before continuation.
Because of the divergence and resistance levels, a correction is more likely to happen. Possible pullback levels are the 0.618 (0.1248) and 0.65 (0.1144) Fibonacci levels = retest of previous local lows.
2. Breakout and continuation.
If price closes above 0.16345 with solid growth, the next target is around 0.20 levels.
Trend is still bullish overall, but short-term momentum is weakening. Waiting for RSI reset or a confirmed breakout is the safer before opening trade in a random place.
Trade carefully, PIPPIN is still down -55% from its ath and we don't know yet if Biconomy Trading Competition will resutl in new highs for this coin.

pippin usdt short signal---
📢 Official Trade Signal – PIPPIN/USDT
📉 Position Type: SHORT
💰 Entry Price: 0.15130
---
🎯 Take-Profit Targets (Partial Exits)
• TP1: 0.13430 — Partial Exit
• TP2: 0.12496 — Partial Exit
• TP3: 0.11153 — Partial Exit
• TP4: 0.09555
• TP5: 0.07476
---
🛑 Stop-Loss: 0.16000
📊 Timeframe: —
⚖️ Risk/Reward Ratio: 5.0
📌 Suggested Leverage: 3.5×
---
🧠 Notes
⚠️ Capital management is mandatory.
⚠️ Please confirm the chart structure before entering the trade.
---

pippinusdtSupport and press the rocket to cheer me up
Observe the ten percent loss limit
Stay away from Bitcoins
Feel free to buy and sell and post your comments

pippinusdtSupport and press the rocket to cheer me up
Observe the ten percent loss limit
Stay away from Bitcoins
Feel free to buy and sell and post your comments


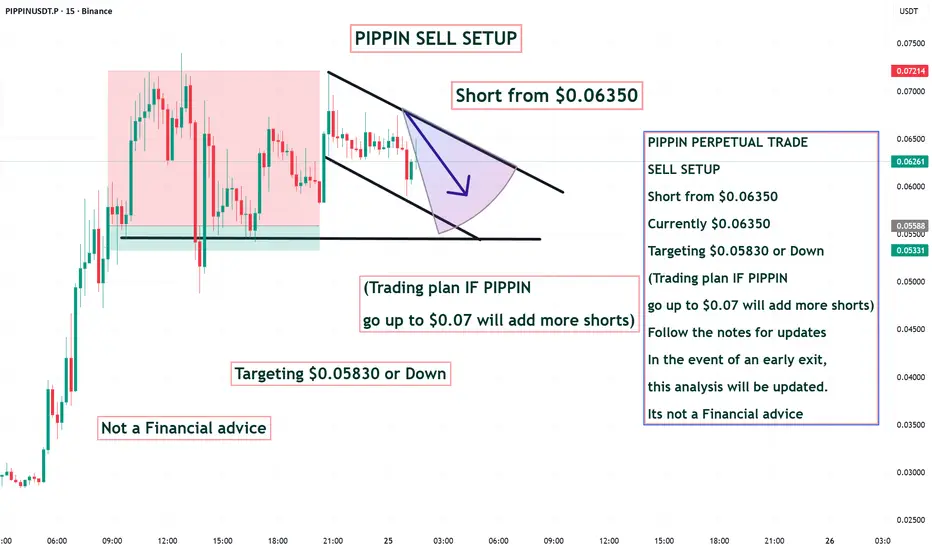
PIPPIN PERPETUAL TRADE SELL SETUP Short from $0.06350PIPPIN PERPETUAL TRADE
SELL SETUP
Short from $0.06350
Currently $0.06350
Targeting $0.05830 or Down
(Trading plan IF PIPPIN
go up to $0.07 will add more shorts)
Follow the notes for updates
In the event of an early exit,
this analysis will be updated.
Its not a Financial advice