SHORT – PIPPIN - Phase 2Scalp SHORT – PIPPIN
The bullish momentum is showing clear exhaustion, with extreme overbought conditions on the 15m, 1h, and 4h timeframes, indicating that buying pressure has been pushed to unsustainable levels. On the 15m chart, a strong bearish divergence has formed: price is making higher highs while RSI prints lower highs, signaling that selling pressure is quietly building up.
With such aggressive overbought conditions, the market is highly prone to a sharp pullback leading into an oversold phase, especially when the broader trend no longer supports further upside. This creates a favorable setup for a short scalp with strong reward potential.
🎯 Trade Setup:
TP: 0.01816
SL: 0.08213
RR: 1 : 5
Market insights

SHORT – PIPPINScalp SHORT – PIPPIN
The bullish momentum is showing clear exhaustion, with extreme overbought conditions on the 15m, 1h, and 4h timeframes, indicating that buying pressure has been pushed to unsustainable levels. On the 15m chart, a strong bearish divergence has formed: price is making higher highs while RSI prints lower highs, signaling that selling pressure is quietly building up.
With such aggressive overbought conditions, the market is highly prone to a sharp pullback leading into an oversold phase, especially when the broader trend no longer supports further upside. This creates a favorable setup for a short scalp with strong reward potential.
🎯 Trade Setup:
TP: 0.02198
SL: 0.05944
RR: 1 : 5.16


PiPPiN: $0.031 | Update for 2026 the real deal ahead of the curve
which inspired the rest
the recent depression was a gift
the recent pump is just 2 VCs getting volume
the recent correction is just dealer network setup
for an elegant Parabolic Rise come Dec 3-13 and next Generation of Ai Season

PIPPIN:USDT Market Outlook – Volume Range Formation💠 PIPPIN:USDT Market Outlook – Volume Range Formation
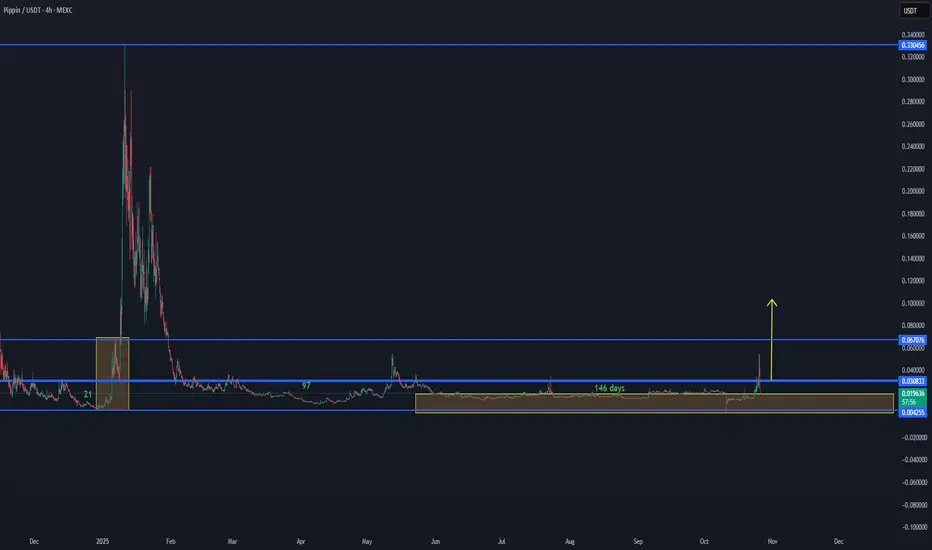
PIPPIN:USDT is showing early signs of new volume activation after an extended 146-day accumulation period within the lower range between 0.0042 – 0.0308 USDT.
This current setup indicates a potential volume range development, similar to the previous expansion phase observed earlier in the chart.
If momentum continues to build and volume sustains, the next major resistance zone sits around 0.067 USDT, followed by a broader target area toward 0.33 USDT on higher timeframes.
At this stage, stability above 0.018–0.020 USDT would confirm the base structure and strengthen the bullish outlook.
📊 Summary:
Range support: 0.0042 – 0.018 USDT
Key activation zone: 0.018–0.030 USDT
Target zones: 0.067 → 0.33 USDT
Structure: Accumulation → Early volume build-up
🔎 Focus: Watching for continuation of volume inflow and break above 0.0308 USDT to confirm next phase expansion.
PIPPINUSDT.P — Holding at Key Support ZoneCurrently, BINANCE:PIPPINUSDT.P is consolidating around a critical support area near 0.018–0.019.
If this zone continues to hold, there’s a strong potential for a technical rebound toward the next resistance levels around 0.0297 and 0.0366.
The structure suggests that the recent sharp drop might have found temporary exhaustion, and a relief rally could form if buyers step in to defend this base.
However, a clean break below 0.0147 would invalidate the bullish bias and open the door for further downside.

PIPPIN/USDT — Dip Buying Zone Formed After BreakdownPIPPIN/USDT — Dip Buying Zone Formed After Breakdown 💎
After the recent breakdown, PIPPIN has entered its volume zone, which often acts as a re-accumulation area before a potential rebound.
If the price can stabilize and build strength here, this level could represent a dip-buying opportunity with the possibility of a return toward previous highs.
📊 Key Range: $0.015 – $0.024
💡 Focus: Watching for a volume confirmation or strong reversal candle to signal a bounce

PIPPIN/USDTKey Level Zone: 0.02000 - 0.02060
LMT v2.0 detected.
The setup looks promising—price previously trended upward with rising volume and momentum, then retested this zone cleanly. This presents an excellent reward-to-risk opportunity if momentum continues to align.
Introducing LMT (Levels & Momentum Trading)
- Over the past 3 years, I’ve refined my approach to focus more sharply on the single most important element in any trade: the KEY LEVEL.
- While HMT (High Momentum Trading) served me well—combining trend, momentum, volume, and structure across multiple timeframes—I realized that consistently identifying and respecting these critical price zones is what truly separates good trades from great ones.
- That insight led to the evolution of HMT into LMT – Levels & Momentum Trading.
Why the Change? (From HMT to LMT)
Switching from High Momentum Trading (HMT) to Levels & Momentum Trading (LMT) improves precision, risk control, and confidence by:
- Clearer Entries & Stops: Defined key levels make it easier to plan entries, stop-losses, and position sizing—no more guesswork.
- Better Signal Quality: Momentum is now always checked against a support or resistance zone—if it aligns, it's a stronger setup.
- Improved Reward-to-Risk: All trades are anchored to key levels, making it easier to calculate and manage risk effectively.
- Stronger Confidence: With clear invalidation points beyond key levels, it's easier to trust the plan and stay disciplined—even in tough markets.
Whenever I share a signal, it’s because:
- A high‐probability key level has been identified on a higher timeframe.
- Lower‐timeframe momentum, market structure and volume suggest continuation or reversal is imminent.
- The reward‐to‐risk (based on that key level) meets my criteria for a disciplined entry.
***Please note that conducting a comprehensive analysis on a single timeframe chart can be quite challenging and sometimes confusing. I appreciate your understanding of the effort involved.
Important Note: The Role of Key Levels
- Holding a key level zone: If price respects the key level zone, momentum often carries the trend in the expected direction. That’s when we look to enter, with stop-loss placed just beyond the zone with some buffer.
- Breaking a key level zone: A definitive break signals a potential stop‐out for trend traders. For reversal traders, it’s a cue to consider switching direction—price often retests broken zones as new support or resistance.
My Trading Rules (Unchanged)
Risk Management
- Maximum risk per trade: 2.5%
- Leverage: 5x
Exit Strategy / Profit Taking
- Sell at least 70% on the 3rd wave up (LTF Wave 5).
- Typically sell 50% during a high‐volume spike.
- Move stop‐loss to breakeven once the trade achieves a 1.5:1 R:R.
- Exit at breakeven if momentum fades or divergence appears.
The market is highly dynamic and constantly changing. LMT signals and target profit (TP) levels are based on the current price and movement, but market conditions can shift instantly, so it is crucial to remain adaptable and follow the market's movement.
If you find this signal/analysis meaningful, kindly like and share it.
Thank you for your support~
Sharing this with love!
From HMT to LMT: A Brief Version History
HM Signal :
Date: 17/08/2023
- Early concept identifying high momentum pullbacks within strong uptrends
- Triggered after a prior wave up with rising volume and momentum
- Focused on healthy retracements into support for optimal reward-to-risk setups
HMT v1.0:
Date: 18/10/2024
- Initial release of the High Momentum Trading framework
- Combined multi-timeframe trend, volume, and momentum analysis.
- Focused on identifying strong trending moves high momentum
HMT v2.0:
Date: 17/12/2024
- Major update to the Momentum indicator
- Reduced false signals from inaccurate momentum detection
- New screener with improved accuracy and fewer signals
HMT v3.0:
Date: 23/12/2024
- Added liquidity factor to enhance trend continuation
- Improved potential for momentum-based plays
- Increased winning probability by reducing entries during peaks
HMT v3.1:
Date: 31/12/2024
- Enhanced entry confirmation for improved reward-to-risk ratios
HMT v4.0:
Date: 05/01/2025
- Incorporated buying and selling pressure in lower timeframes to enhance the probability of trending moves while optimizing entry timing and scaling
HMT v4.1:
Date: 06/01/2025
- Enhanced take-profit (TP) target by incorporating market structure analysis
HMT v5 :
Date: 23/01/2025
- Refined wave analysis for trending conditions
- Incorporated lower timeframe (LTF) momentum to strengthen trend reliability
- Re-aligned and re-balanced entry conditions for improved accuracy
HMT v6 :
Date : 15/02/2025
- Integrated strong accumulation activity into in-depth wave analysis
HMT v7 :
Date : 20/03/2025
- Refined wave analysis along with accumulation and market sentiment
HMT v8 :
Date : 16/04/2025
- Fully restructured strategy logic
HMT v8.1 :
Date : 18/04/2025
- Refined Take Profit (TP) logic to be more conservative for improved win consistency
LMT v1.0 :
Date : 06/06/2025
- Rebranded to emphasize key levels + momentum as the core framework
LMT v2.0
Date: 11/06/2025
- Fully restructured lower timeframe (LTF) momentum logic

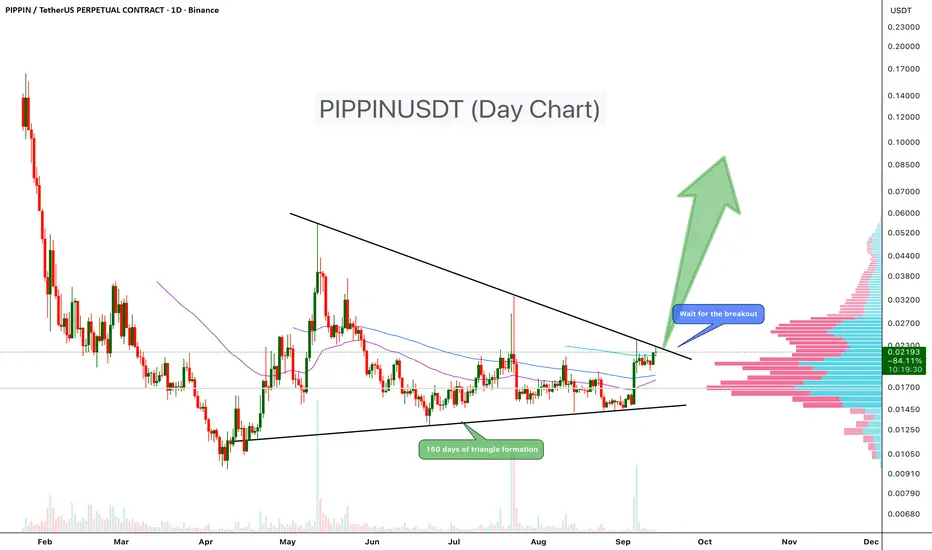
PIPPINUSDT Coiling for a Massive MovePIPPIN has been consolidating inside a symmetrical triangle pattern for the past 150 days, with price tightening between lower highs and higher lows. This long consolidation phase is creating strong pressure, and a breakout is likely to decide the next major move.
At present, the price is trading close to the upper trendline resistance of the triangle. A successful breakout and close above this level could trigger a strong bullish rally. On the other hand, rejection at resistance may push price back toward the lower boundary of the formation.
Key Points
- 150-day triangle formation indicates a major move ahead
- Price trading above 50,100,200 EMA in day chart
- Price consolidating near upper resistance trendline
-Volume profile shows heavy activity around current zone, a potential launchpad
- Upside potential remains strong if resistance is cleared
Trade Setup
✏️Entry: Wait for breakout confirmation above resistance trendline (~$0.0235)
✏️Stop-loss: $0.016)
✏️Targets: 150%-500%
Cheers
Hexa🧘♀️
PIPPIN/USDT April 2025 was a remarkable month for PIPPIN/USDT, with price surging +400% in less than a month. Since then, the pair has entered a healthy correction phase, allowing momentum to cool off and a new structure to form.
The first attempt at stabilization created a base support around the $0.013 zone, which has now become a key level. Currently, price is hovering around this support, making it an attractive DCA entry zone for accumulation.
If this base holds, upside targets are aligned with the next major resistance levels:
TP: $0.030 – $0.033
TP: $0.040 (extended target based on current structure)


Pippin · 5,895% Last Wave vs 3,000% Profits PotentialThis one looks good. Here the variation comes from the fact that in June there was a higher low compared to April, then again in July another higher low. Even before the last bullish wave we have higher lows and this is good.
PIPPINUSDT grew a massive 5,895% just 8 months ago. This reveals that this pair can do wild numbers. If done once, can happen again.
Then we have a full correction, the one that ended in April, and this is even better. Since the bullish move was corrected, it means a new one can develop. After the correction ended we have higher lows. Even when selling pressure was really strong (based on the volume) you can see how buyers were always present.
The next rise can hit an easy target of $0.208 for a massive 1,100%. A standard bull market with the current chart can yield 3,000% at $0.531. The end result can be something different.
Prices can end up moving up but not reaching our targets or everything can happen where prices move much higher. Lower is not likely and very low probability. 1,100% I would say is the minimum and an easy target because it was already hit in January 2025, much higher. With the higher lows in place, clear and strong, we aim for a higher high and that is a new all-time high. 3,000%. Seeing the 5,000% done easily months ago, we know it is possible and it is likely that it will be done. It is going to happen.
Namaste.

PIPPIN/USDT recently flipped the 0.017 major resistance into strong support, signaling a potential base for the next bullish leg. Price action is consolidating above this key level, showing strength and readiness for continuation. A healthy retest of the green box entry zone

PIPPIN/USDT Long Setup Update!!PIPPIN Breakout Alert – 100% Potential on the Table
Hey Traders — if you're into high-conviction setups with real momentum, this one’s for you.
PIPPIN is breaking out from a falling wedge pattern on the 4H timeframe after a long period of consolidation. This structure typically signals a potential reversal with strong upside momentum.
With the recent breakout, we’re looking at a fresh long opportunity:
Entry:
Current levels: 0.0172 and add more up to $0.0155
Stop-Loss:
Below support: 0.0141
Targets:
Target 1: 0.0336
Target 2: 0.0450
Target 3: 0.0550
Target 4: 0.0650
✅ Risk-reward remains highly favorable from this point.
✅ Tight stop-loss to manage risk in case of any invalidation.
✅ Watch for confirmation above immediate resistance for further strength.
Disclaimer: Always manage your position size and risk. Trade safe!

PIPPIN IS ABOUT TO EXPLODE AGAIN??!!🔍 Chart Structure
Descending Wedge Breakout:
Price has broken out of a long-term descending wedge pattern.
This breakout is typically bullish, especially when accompanied by increased volume or momentum indicators turning up.
Support/Resistance Levels:
Current Price: ~0.0201 USDT
Key Resistance Zones:
0.02200 – Minor resistance
0.02310 – More substantial historical resistance
0.02473 – Intermediate target
0.02847 – Major target from chart box
Support Zones:
0.01815 – Key local support
0.01600 – Lower risk invalidation/support
Trade Box:
Green box = Potential long trade setup.
Looks like a Risk/Reward ratio of about 2.5–3:1 based on entry and stop vs. target.
Entry: ~0.0200
Stop: ~0.0182
Target: ~0.0284
📊 Indicators
RSI (Relative Strength Index):
Current RSI: ~41.75
Still in a neutral zone, suggesting there’s room for upside before becoming overbought.
Mild bullish divergence could be forming if previous lows were lower than the RSI lows.
⚠️ Considerations
Volume Confirmation: Look for increasing buy volume after breakout to confirm strength.
Retest of Wedge Line: If price pulls back, a retest of the breakout line could be a good secondary entry.
Macro Resistance: 0.0284–0.0300 has historically been a supply zone; expect selling pressure there.
✅ Potential Strategy
Long Entry: 0.0200 (Confirmed breakout)
Stop Loss: Below 0.0182
Target(s):
TP1: 0.0220
TP2: 0.0247
TP3: 0.0284

PIPPIN Potential Bullish Impulse BrewingPippin (PIPP) exhibits a completed five-wave motive decline terminating towards a well-defined External Demand Zone, signaling a high-probability reversal area. The current structure reflects the onset of a corrective Wave 2 retracement, with early indications of a Wave 3 impulsive advance underway.
The Immediate Demand Zone has acted as a structural support base, with bullish rejection from the predefined sell-off zone confirming latent buying pressure. Price action recently formed an intra-wave correction around the 0.0457 pivot, likely marking the end of a minor wave within the developing larger impulsive cycle.
Sustained bullish momentum above the rejection zone would confirm the initiation of Wave 3, with Fibonacci-based extension targets projecting a medium-to-long-term rally toward $2.80. Conversely, failure to hold above the Immediate or External Demand Zones would invalidate the bullish impulse and expose the asset to a potential deeper corrective retracement.

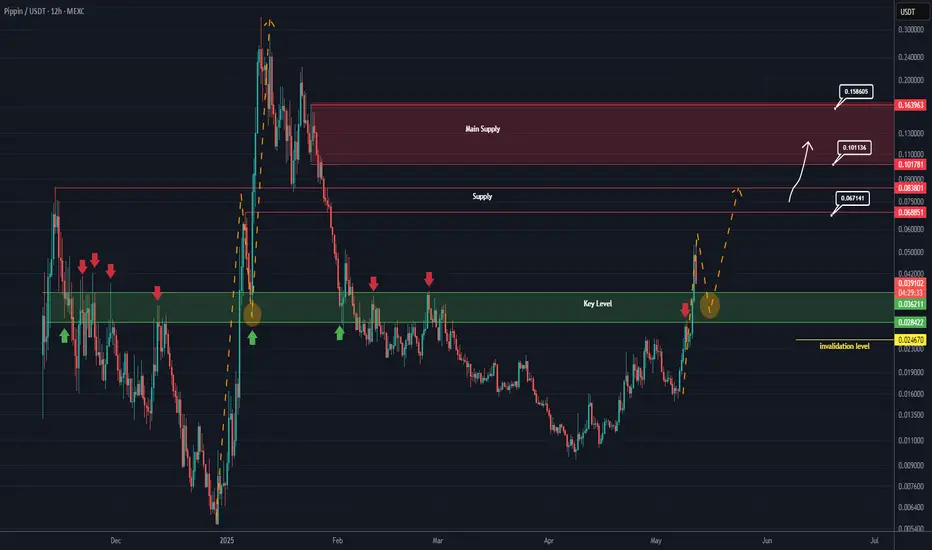
PIPPIN New Update (12H)It seems that a flip zone | or a key area | has been reclaimed here.
Previously, every time price touched this zone, it was rejected. But this time, the price has reclaimed it sharply and is now retesting the area.
Pay attention to the yellow arrows and circles.
Opening a sell/short position at this level might not be a good idea.
As long as the green zone is held, the price can move toward the marked supply levels.
If it drops below the green zone and a daily candle closes below the invalidation level, the bullish outlook on Pippin would still not be invalidated.
For risk management, please don't forget stop loss and capital management
When we reach the first target, save some profit and then change the stop to entry
Comment if you have any questions
Thank You
PIPPING breakout falling wegdeThere are must be a good move to the up direction.
P. S. If you want to get every day morning summary on a cryptomarket you could find me at the link in profile.

PIPPIN/USDT: LONG TRADE SETUP!!🚀 Hey Traders! PIPPIN Breakout Alert – Big Move Incoming? 👀🔥
If you’re excited for this setup, smash that 👍 and hit Follow for high-quality trade ideas that actually deliver! 💹🔥
🔥 PIPPIN Breakout & Retest – Time to Pump?
PIPPIN has broken out of a falling wedge on the 2H timeframe and is now retesting the breakout level. If this retest holds, we could see a strong rally ahead! 🚀
💰 Trade Setup:
📍 Entry: CMP, add more up to $0.019
🎯 Targets: $0.0225 / $0.0252 / $0.0294 / $0.0334
🛑 Stop-Loss: $0.018
⚡ Leverage: Low (Max 5x)
🔎 Strategy: Enter with low leverage now, scale in on dips, and ride the momentum to key targets!
💬 What’s Your Take?
Are you bullish on PIPPIN’s breakout? Drop your thoughts, analysis, and predictions in the comments! Let’s secure those gains and ride this wave together! 💰🚀🔥

PIPPINUSDTPippin/USDT to rise, and based on the chart analysis, that’s a possibility.
STRONG SUPPORT
- The 4HR trendline still holding, which indicates that the downtrend might slow down.
- The price has reached a key zone that was previously resistance and has now turned into support
DIVERGENCE
- The RSI is showing bullish divergence, which signals a potential price reversal.
CHAT PATTERN
- The price is forming a Falling Wedge Pattern which is usually a bullish pattern.
Possible Price Targets
- Short-Term Target: 0.049 USDT
- Long-Term Target: 0.087 - 0.110 USDT

PiPPiN: $0.06 | An Organic Discovery from the packager of LiNK GRAPH and high flying projects that spawned more projects
comes a BREAKTHROUGH in the next generation of building good stuff
enjoy reading the journal
long story short
this is close o the GOD PARTICLE that one can appreciate
took me days to digest and see through
MARVELOUS
strategy: own it and grow it
narrative: Elon will definitely love this more so the evil geniuses at OpenAi
catalyst: an invitation from the White House more so KREMLiN
playout: Bidding War is coming
