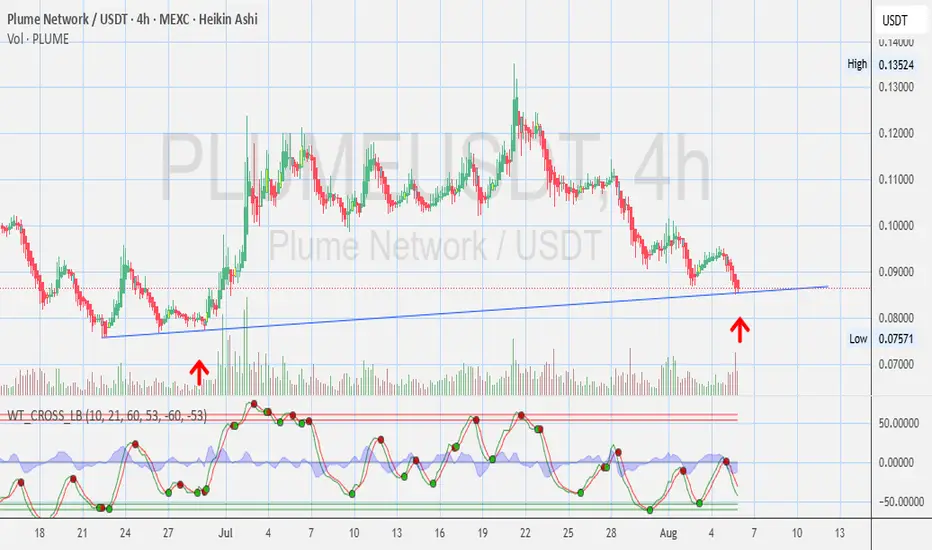
PLUME - PLUME NETWORK - 4 Hours Chart - Update Price is testing a rising trendline that has held strong since late June. Previous bounces from this level (🔴 arrows) led to significant upward moves.
Volume shows accumulation near this trendline, and the WT_CROSS indicator is near oversold, hinting at a possible bullish bounce.
If support holds,
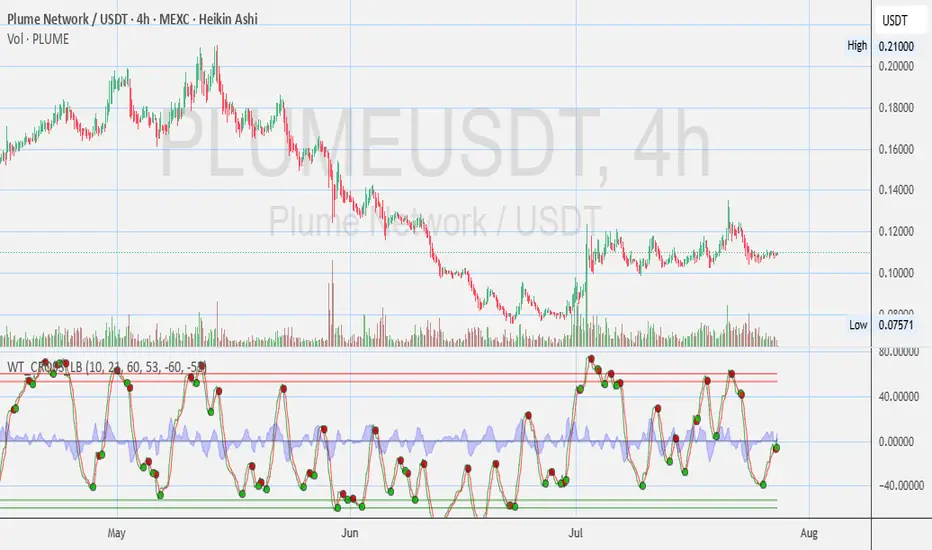
PLUME - PLUME NETWORK - 4 Hour Chart UpdatePLUME/USDT (4H)
Looks like the tide is turning! 🌊📈
PLUME is showing higher lows and steady support above $0.10, with momentum indicators pointing upward.
If volume picks up, we could see a test of the $0.13–$0.14 zone soon.
Watching for confirmation as the uptrend builds. 🚀
Disclosures:
This anal
PLUME $PLUME$PLUME is definitely going to be bullish this bull run. I can see an easy 2x - 10x+ from this price point. Technicals are very strong. Rumours are this RWAs token is connect to Donald Trump & UAE.

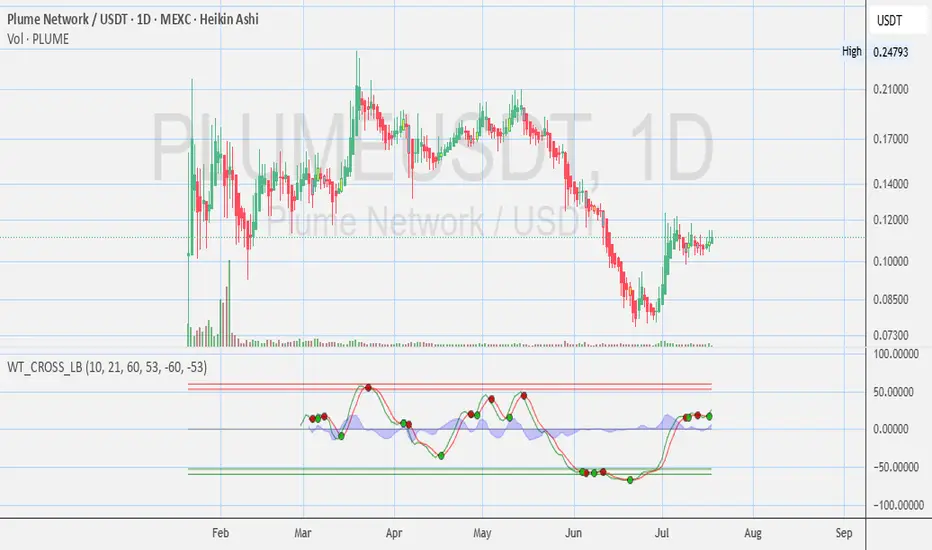
PLUME - PLUME Network - Daily Chart UpdatePrice has respected the ascending trendline for a second time (🔴 arrows), signaling strong support around the $0.08 zone.
The bounce from this level is accompanied by increasing volume and a bullish hook forming on the WT_CROSS indicator from the oversold zone – a classic reversal signal.
A daily

Plumeusdt trading opportunityPLUMEUSDT has broken down from its bullish pennant structure, with price currently holding below the support trendline. A confirmed close beneath the 0.1026 level would validate a shift toward deeper correction, redirecting focus to the marked re-accumulation zone as a safer buy opportunity.
Altern

PLUME Daily Chart Update Price holding steady near $0.11, consolidating after June recovery.
Momentum indicators (WT_CROSS) show a gradual bullish bias, but confirmation needed on a breakout above $0.115 for stronger upside potential.
Disclosures:
This analysis is for informational purposes only and is not financial advice

PLUME - fractal. long.It’s forming the same structure as last time: impulse – consolidation – impulse.
A long position can be opened.
Target: $0.15.

PLUME NETWORK - PLUME Daily Chart OpinionsHere's a breakdown and technical analysis of the **PLUME/USDT (1D, Heikin Ashi, MEXC)** chart you provided:
---
📊 **Chart Overview:**
* **Current Price:** Around **\$0.1115**
* **Price Action:** Currently in a short-term **uptrend** after a significant downtrend.
* **Volume:** Noticeable **increas
PLUME/USDTKey Level Zone: 0.1030 - 0.1060
LMT v2.0 detected.
The setup looks promising—price previously trended upward with rising volume and momentum, then retested this zone cleanly. This presents an excellent reward-to-risk opportunity if momentum continues to align.
Introducing LMT (Levels & Momentum Tr

PLUME | Level to LevelPLUME is displaying a strong bullish pattern with a clear "level to level" trading structure. The chart shows:
Key Observations:
Price has successfully broken above the blue support zone around $0.097
Currently testing the next resistance level at $0.1293
The projected path (pink arrow) suggests co

See all ideas
Summarizing what the indicators are suggesting.
Oscillators
Neutral
SellBuy
Strong sellStrong buy
Strong sellSellNeutralBuyStrong buy
Oscillators
Neutral
SellBuy
Strong sellStrong buy
Strong sellSellNeutralBuyStrong buy
Summary
Neutral
SellBuy
Strong sellStrong buy
Strong sellSellNeutralBuyStrong buy
Summary
Neutral
SellBuy
Strong sellStrong buy
Strong sellSellNeutralBuyStrong buy
Summary
Neutral
SellBuy
Strong sellStrong buy
Strong sellSellNeutralBuyStrong buy
Moving Averages
Neutral
SellBuy
Strong sellStrong buy
Strong sellSellNeutralBuyStrong buy
Moving Averages
Neutral
SellBuy
Strong sellStrong buy
Strong sellSellNeutralBuyStrong buy