$PNUT Bull Flag in Play, Breakout Loading?$PNUT is forming a clean bull flag on the 12H chart after a strong move up in early May.
Price is respecting the flag structure and just bounced from the lower boundary.
A breakout above $0.238 could trigger the next leg toward $0.35, nearly 60% potential upside.
Momentum building.
Flag breakout incoming?
DYOR, NFA
PNUTUSDT.P trade ideas

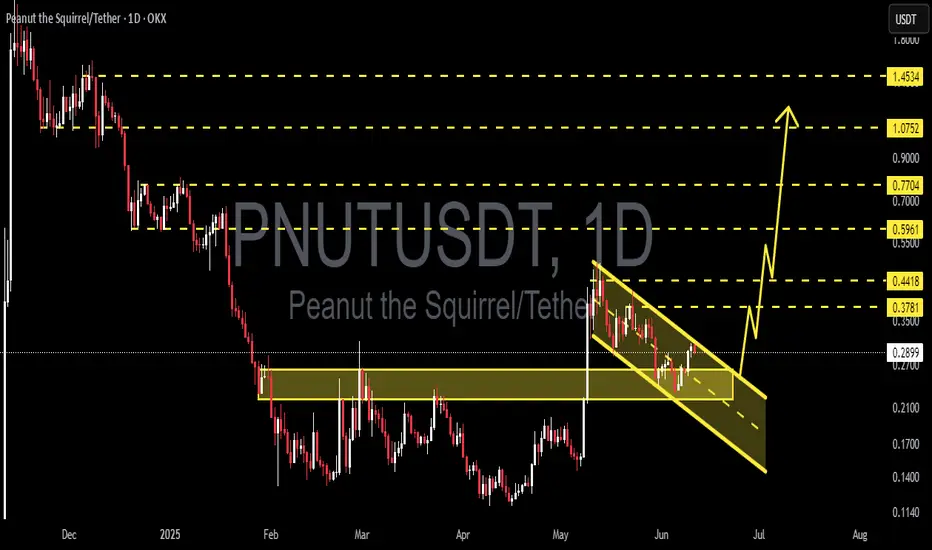
Falling Channel Breakout on PNUT/USDT – Next Stop: $0.76?📊 Pattern Analysis:
Falling Channel (Descending Channel): PNUT formed a clear falling channel from early May to late June 2025. This pattern typically signals a potential bullish reversal once a breakout occurs.
Confirmed Breakout: The price has successfully broken above the upper boundary of the falling channel, which is an early sign of a potential bullish trend.
Strong Support Zone: The horizontal zone around $0.20 – $0.26 USDT has acted as a solid demand base, as seen multiple times from March to June.
✅ Bullish Scenario:
If the breakout continues with momentum, the price could move upward gradually, aiming for the following resistance levels:
1. Target 1: $0.2986 – Minor resistance
2. Target 2: $0.3774 – Previous consolidation area
3. Target 3: $0.4403 – Major historical resistance
4. Target 4: $0.5951 to $0.7674 – Recovery zone from the falling channel
5. Extended Target (Long-Term): $1.0797 to $1.7957 (if a full rally occurs with strong bullish sentiment)
❌ Bearish Scenario:
If the price fails to hold the breakout and re-enters the channel:
Potential drop back to the support zone of $0.2000 - $0.1600
A breakdown below this range may lead to further downside toward $0.1300 to $0.1000 (previous historical low)
🔍 Summary:
The chart displays a classic bullish reversal pattern with a confirmed breakout from the falling channel.
The $0.26–$0.29 area now acts as a key confirmation zone. If the price holds above it and completes a successful retest, the bullish continuation is likely.
However, traders should stay cautious of false breakouts.
#PNUTUSDT #CryptoBreakout #AltcoinSeason #ChartAnalysis #BullishReversal #TechnicalAnalysis #BreakoutTrading #CryptoSignals #DescendingChannel

PNUT | Meme Mania Soon?PNUT/USDT presents a compelling bullish setup on the daily timeframe. The price has been consolidating within a strong support zone (green box) and is now approaching two critical breakout levels:
Key Technical Factors:
- Price trading near descending trendline resistance
- 90-day VWAP (red line) acting as dynamic resistance around current levels
- Strong support base established in the $0.15-0.20 range
- RSI showing neutral momentum with room for upside expansion
Bullish Scenario:
A simultaneous break above both the trendline and VWAP-90 would signal a significant shift in momentum. The projected path (purple arrow) targets the upper resistance zone around $0.58-0.65, representing substantial upside potential.
Entry Strategy:
- Conservative: Wait for confirmed breakout above both levels
- Aggressive: Position ahead of breakout with tight risk management
Risk Factors:
Failure to break these levels could result in continued consolidation or retest of support. The setup requires patience as both technical barriers must be cleared convincingly for the bullish thesis to materialize.

PNUTUSDT Forming Falling Wedge — Breakout Incoming?NUTUSDT is forming a falling wedge pattern, a classic bullish reversal setup. Price action is tightening, and if momentum builds, a breakout to the upside could follow. Traders are watching closely to see if PNUT can break resistance and push toward higher targets, signaling a potential trend shift.

PNUT/USDT – Bullish Rebound from Channel Support | Long SetupPNUT/USDT is currently respecting the ascending parallel channel on the 4H timeframe. Price bounced off the lower boundary of the channel, showing signs of a potential bullish continuation. A long position is entered near support, with a target toward the upper range of the channel and a tight stop loss just below the structure.
🔹 Entry: ~0.2218
🔹 Stop Loss: ~0.2140 (below channel support)
🔹 Take Profit: ~0.2521 (upper channel resistance)
🔹 Risk-to-Reward: ~4.2R
The trade aligns with the trend structure and offers a favorable R:R setup. Break of the channel may invalidate the setup.

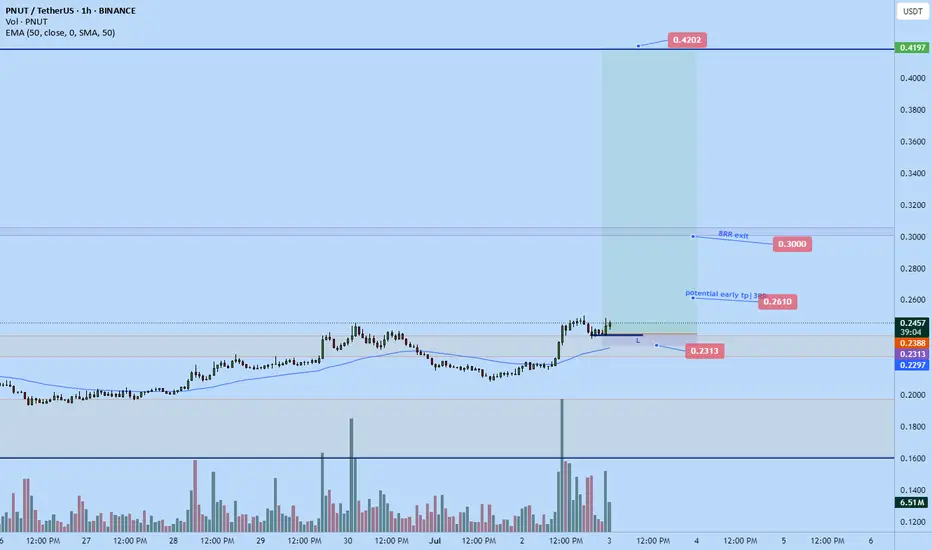
PNUT BIG BIG LONGTIme sensitive. whales are accumulating pnut, about to take off.
Based on my analysis we could pump as high as 0.42 but for today am just aiming for $0.3 which is roughly 8 RR from my entry. More than happy with that
Manage risk if following long though one could size up a little on this setup as its highly probable.
I trade price action don't know how to describe all the confluences it be too long.
DTT setup
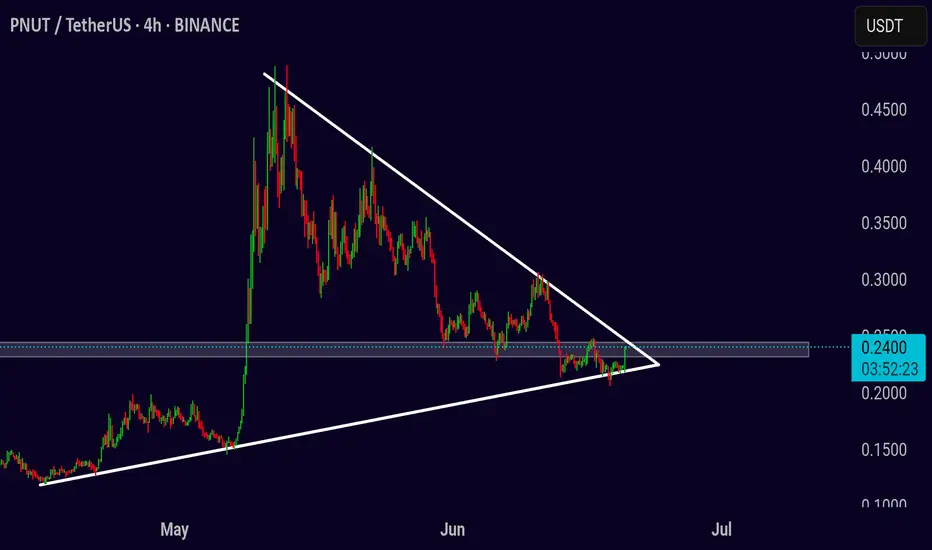
PNUT/USDT – Breakout Watch from Symmetrical TrianglePNUT/USDT – Breakout Watch from Symmetrical Triangle
Chart pattern: Symmetrical Triangle
Timeframe: 4-Hour
Published: June 20, 2025
PNUT/USDT is nearing the apex of a symmetrical triangle that has been forming over several weeks. The price is tightening between rising support and descending resistance, indicating a breakout is likely approaching soon.
Price is currently testing the upper boundary near 0.24. A breakout from this level with strong volume may trigger a bullish move, while rejection could keep price inside the range a little longer.
Bullish scenario
Entry: 4H close above 0.245 with volume
Target 1: 0.28
Target 2: 0.33
Stop-loss: Below 0.22
Bearish scenario
Entry: Break below 0.215
Target 1: 0.18
Target 2: 0.14
Stop-loss: Above 0.24
Wait for confirmation before acting — momentum will likely follow once the triangle breaks.
PNUTUSDT UPDATEPattern: Falling Wedge
Current Price: $0.2276
Target Price: $0.42
Target % Gain: 80.64%
Technical Analysis: PNUT is forming a falling wedge on the 1D chart, showing signs of a potential breakout. A breakout above the wedge resistance could trigger an 80% move. Monitor volume and candle structure for confirmation.
Time Frame: 1D

PNUTUSDT Forming Falling WedgePNUTUSDT is presenting a compelling falling wedge pattern, signaling a high-probability bullish reversal. This technical formation typically occurs after a sustained downtrend and is characterized by converging trendlines sloping downward. In the case of PNUTUSDT, the wedge is nearing its apex, indicating that a breakout is likely imminent. The setup is further supported by healthy volume levels, adding credibility to the expected move. Historically, falling wedges often lead to explosive upside moves, and this pair is currently projecting a potential gain of 90% to 100%+ if the breakout confirms.
Market interest in PNUTUSDT is steadily growing, as indicated by rising trading activity and increased visibility across community forums and social platforms. This surge in attention aligns with the volume spike seen during recent trading sessions — a classic precursor to bullish breakouts. As more investors start to take positions in anticipation of a breakout, price momentum can accelerate rapidly, creating ideal conditions for short- to mid-term gains.
From a technical standpoint, a confirmed breakout above the wedge’s upper resistance line could open the door to rapid price expansion, especially with limited overhead resistance. Traders should watch for confirmation signals such as strong bullish candlesticks, increasing volume, or a retest of the breakout level. PNUTUSDT is shaping up as an exciting opportunity for swing traders looking to capitalize on pattern-based moves in the altcoin space.
With bullish sentiment, clear technical structure, and improving market participation, PNUTUSDT could be on the verge of a significant breakout. It’s a setup that combines strong technicals with growing investor interest — a powerful combination in crypto trading.
✅ Show your support by hitting the like button and
✅ Leaving a comment below! (What is You opinion about this Coin)
Your feedback and engagement keep me inspired to share more insightful market analysis with you!

$PNUT/USDT Breakout Trade Setup$PNUT / USDT - Breakout Trade Setup.
Entry: $0.2963 - $0.3002
Stop Loss: $0.2682
Targets: $0.3603 / $0.4305 / $0.4891
Breakout & retest of descending trendline
60 %+ upside potential
DYOR | NFA

$PNUT in Freefall – Can $0.20 Hold as Support?$PNUT is dropping like a falling knife!🚨
Technically, we have support around $0.22 and $0.20.
According to the Fibonacci levels, the 0.786 level may
act as strong support near $0.20, making that area a key zone to watch.
So unless this support range is reached, the price may continue to drop toward that zone.
If you're currently stuck in this coin, you could consider adding funds and setting your liquidation point below $0.18 for safety.
If you're looking to enter or accumulate, the range between $0.22 and $0.20 is ideal for accumulation.
However, even with these support levels, we still need to wait for clear reversal patterns before expecting a trend reversal in the shorter time frame.
Thank you so much for reading, I hope my updates help you in your trading journey.
DYOR, NFA

PNUTUSDT 1D Analysis PNUT ~ 1D Analysis
#PNUT Buy when retesting this support block or buy after successfully breaking this resistance line with a short-term target of at least 15%++
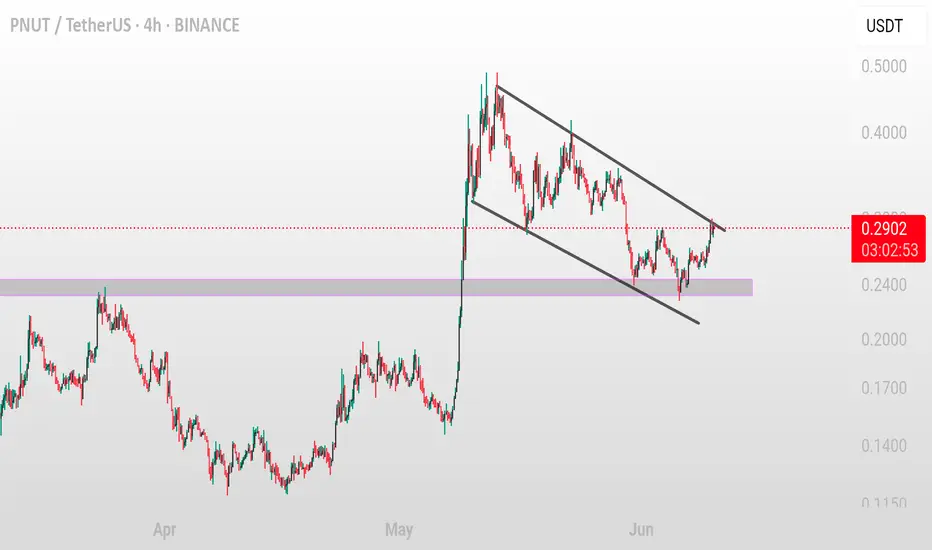
PNUT/USDT – Bullish Breakout from Falling Channel!PNUT Breakout Alert – 200% Potential on the Table
Hey Traders — if you're into high-conviction setups with real momentum, this one’s for you.
PNUT has officially broken out of a textbook falling channel after a healthy consolidation. This pattern often signals trend reversal and renewed bullish momentum — and PNUT looks ready to move.
🔹 Pattern: Falling Channel
🔹 Breakout Confirmation: Clear candle close above resistance
🔹 Previous Move: +204% before entering the channel
🔹 Current Setup: Long entry with defined risk-to-reward
🔹 Target: ~0.85
🔹 Stop: Just below the breakout zone
🧠 Technical Perspective:
Volume uptick during breakout confirms buyer strength
Strong support retest zone around 0.28–0.29
Holding above this range could fuel a significant leg higher
📌 This setup offers a clean structure with a high R:R potential. PNUT has proven it can move fast — now it’s about following the breakout with tight risk management.
📥 Add to your watchlist and let price action lead the way.

PNUT - LONG SET-UPBINANCE:PNUTUSDT
𝐏𝐍𝐔𝐓/𝐔𝐒𝐃𝐓
PnuT is forming a bullish base above support and pushing against descending trendline resistance. A breakout above $0.3275 could ignite a 100% move higher. Setup looks clean and coiled

PNUT/USDT (4H) – Bull Flag Breakout Setup PNUT/USDT (4H) – Bull Flag Breakout Setup
Pattern: Bull Flag 📉📈
Timeframe: 4-Hour ⏱️
Pair: PNUT/USDT 💱
Published: June 10, 2025 📅
Technical Overview:
PNUT/USDT is forming a classic bull flag on the 4-hour chart following a strong impulsive rally. The price has been consolidating inside a descending channel — a typical continuation structure in bullish trends. Currently, the price is testing the upper trendline resistance, signaling potential breakout pressure building up 🔥
Potential Trade Setup:
Bullish Scenario ✅
Entry: On a confirmed breakout and close above the flag resistance (\~0.3000)
Targets:
* First target at 0.4200 🎯
* Second target at 0.5000–0.5200 zone 🎯
Stop-loss: Below recent swing low (\~0.2500) 🛑
Risk Management ⚠️
If PNUT gets rejected at the upper trendline and fails to break out, it could revisit the lower channel support near 0.2300. Look for a volume spike on breakout for added confirmation 📊
Conclusion:
PNUT is at a key decision point. A clean breakout above the descending channel could unlock a fresh bullish wave. As always, wait for confirmation and manage your risk accordingly 🔍📈
PNUT | Is This A Flag Pattern?PNUT shows a descending channel pattern, indicating a downtrend. The price recently broke below mid-channel support and is currently trading at $0.2839, down 3.11%. The descending trendlines suggest continued bearish pressure. A long position is marked on the chart, with an entry near the current level, a take-profit target around $0.34 near the upper trendline, and a stop-loss near $0.2090 below the lower channel boundary. This setup implies a bullish counter-trend trade within the channel, anticipating a bounce from the lower support trendline. Volume has recently increased, hinting at stronger market activity as price approaches the lower boundary.

PNUTUSDTA Falling Wedge (Bearish) pattern has breakout the resistance, and it is targeting $0.45 with a profit of 65% on the 4-hour chart.

PNUT/USDT – Bull flag breakout attemptPNUT/USDT – Bull flag breakout attempt
PNUT is currently showing signs of breaking out from a bull flag pattern. This pattern typically indicates a continuation of the previous uptrend if confirmed with strong volume.
The price is testing the upper trendline of the flag. If it breaks and closes above this resistance, we may see bullish momentum ahead. However, a rejection from this zone could lead to consolidation or a short-term pullback.
Key levels to monitor:
* Breakout confirmation area
* Support near the flag base
* Volume activity for breakout strength
Keep a close watch — a successful breakout could lead to the next upward move.

PNUT – Breakout Cooling Down, Not Done Yet - 3x is Near!
$PNUT is far from over. Clean breakout followed by a healthy cooldown—looking like a setup for continuation.
Would love to bid below 3c, as it's a pivotal level with strong confluence. If we see a market-wide pullback in the next couple of weeks, there’s a good chance those bids get filled.
Targeting the yearly open around 7c for an exit.
BINANCE:PNUTUSDT

PNUT projects to a Dollar.TWO Clear patterns
Double bottom
and a Bull Flag.
Two respective Log Projections for you to consider.
This suggest strong Solana performance is incoming and another round of #Memecoin frenzy.

PNUTUSDT – Breakout Brewing from Bullish Pennant!PNUT Bullish pennant Formation – 200%+ Potential Incoming?! 👀🔥
Hey Traders! If you're all about high-conviction plays and real alpha, smash that 👍 and tap Follow for more setups that actually deliver!
PNUT is consolidating inside a bull pennant after a massive 200%+ rally earlier this month. Currently, it's sitting near the lower support zone, forming higher lows—a sign of growing pressure for an upside move.
🔍 Setup Highlights:
Bull Pennant forming
Strong bounce zone (green box)
Potential breakout path marked in projection
📌 Trade Idea:
Entry: $0.31–$0.28 support zone
Targets: $0.39 / $0.46 / $0.55 / $0.72
SL: Below $0.27
Leverage: 5x–10x (only for experienced traders)
Keep a close eye—once PNUT clears the triangle resistance, things could move fast.
What are your thoughts?

PNUTUSDT 12H AnalysisPNUT ~ 12H Analysis
#PNUT Buy after breaking this resistance line with a short term target of at least 15%+ and a long term target of $1.07++
