BUY/LONG PNUTUSDT FOLLOWING D1 PEAKBUY/LONG PNUTUSDT FOLLOWING D1 PEAK
Hello,
I currently recommend a pair for you to BUY/LONG: PNUTUSDT.
Why should you BUY/LONG PNUTUSDT?
The D1 peak is still ongoing, with no signs of a confirmed D1 top for PNUT.
H4 is currently in a corrective pullback after rallying to form a peak at $0.49.
The likelihood of breaking above the recent H4 All-Time High (ATH) is high, making it a good opportunity for a LONG/BUY position.
So, what should we do?
Trend: BUY
Entry: When H4 corrects, the price is expected to return to around $0.3167. At this level, allocate your capital and enter a BUY position.
Close Buy: When H4 forms a peak (has a peak on H4).Alternatively, refer to the price levels on the chart.
Wishing you success!
PNUTUSDT trade ideas


PNUT – Breakout Cooling Down, Not Done Yet - 3x is Near!
$PNUT is far from over. Clean breakout followed by a healthy cooldown—looking like a setup for continuation.
Would love to bid below 3c, as it's a pivotal level with strong confluence. If we see a market-wide pullback in the next couple of weeks, there’s a good chance those bids get filled.
Targeting the yearly open around 7c for an exit.
BINANCE:PNUTUSDT

PNUT/USDT: FALLING WEDGE BREAKOUT ALERT!!🚀 PNUT Breakout Alert – 100%+ Potential Incoming?! 👀🔥
Hey Traders! If you're all about high-conviction plays and real alpha, smash that 👍 and tap Follow for more setups that actually deliver! 💹💯
PNUT has officially broken out of a falling wedge structure — a bullish reversal pattern we've been eyeing for weeks! After weeks of consolidation and pressure along the wedge resistance, the price has now made a clean breakout with increasing volume.
🔹 Last time it broke out from this zone, we witnessed a massive 109% move.
🔹 Currently, it’s showing a similar breakout structure with room for a big upside move.
🔵 Entry Zone: $0.158–$0.162
🎯 Targets:
• Target 1: $0.21
• Target 2: $0.27
• Target 3: $0.31+
🛑 Stop-loss: $0.142
📊 Leverage: 3x–5x (low to moderate risk)
⚠️ As always, manage your risk and don’t chase pumps. Setup looks strong as long as the breakout holds and we don’t see a fakeout candle back inside the wedge.
📍Let me know what you think — will PNUT fly again?

PNUT Reversal Arc: From Panic Low to 120% Rebound Potentia
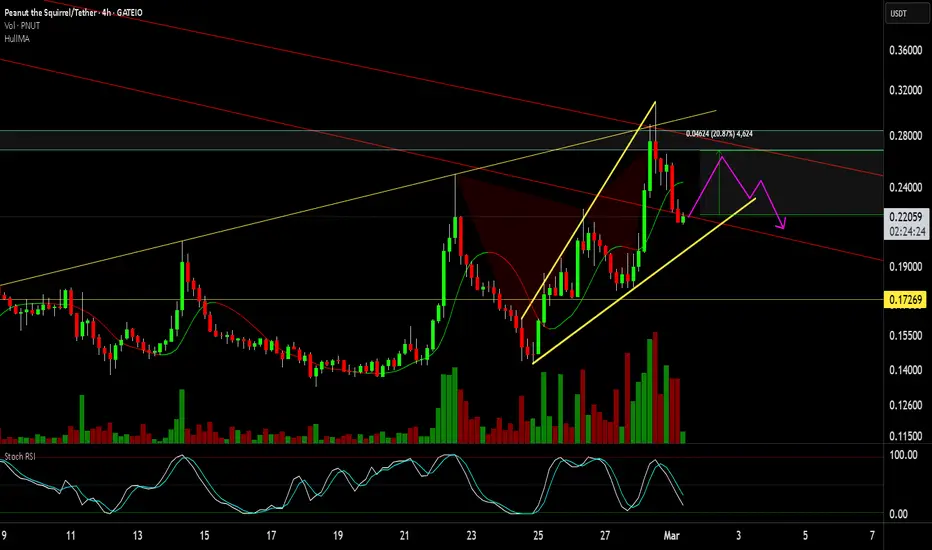
The PNUT/TetherUS daily chart from May 10, 2025, presents a compelling case for a powerful recovery rally, despite today's sharp correction (-12.87% on 364.19M volume). While current price action appears bearish at first glance, the broader technical structure reveals an exceptional buying opportunity forming.
--- The Macro Technical Framework ---
The chart shows PNUT has been trading within a well-defined ascending channel (white boundaries) since the January 2025 low. What makes this pattern particularly significant is the recent development:
1. Major Breakout + Pullback Scenario - After breaking out from months of consolidation, PNUT has experienced a sharp pullback, creating the classic "shakeout before the breakout" pattern that often precedes major moves
2. Historical Supply/Demand Zone (purple rectangle) - The 0.55-0.60 region that previously acted as strong support before the late 2024 breakdown
3. Structural Support Level (gray horizontal line) - Additional confirmation of support around the 0.22 level
--- Technical Analysis: The Pendulum Swing Setup ---
The recent price action follows a textbook reversal pattern:
Phase 1: Accumulation & Breakout - The extended consolidation from January through April 2025, followed by the explosive green candle breaking above the channel's midline
Phase 2: Current Shakeout - Today's sharp 12.87% decline represents a classic shakeout move, designed to clear out weak hands before the next leg up
Phase 3: Projected Recovery (blue pathway) - The anticipated price movement shows:
- Pullback to the 0.2213 entry zone (confluence of channel support and horizontal support)
- Series of higher lows and higher highs as the pattern develops
- Ultimate target at 0.4671, representing a 111% gain from the projected entry
--- Why This Pattern Is Particularly Compelling ---
Three key factors make this setup exceptionally attractive:
1. Volume Profile Analysis - Despite today's negative price action, the volume signature shows characteristics of a selling climax rather than distribution, indicating potential exhaustion of sellers
2. Channel Integrity - The lower boundary of the ascending channel has held on multiple tests since January, establishing its significance as structural support
3. Historical Precedent - Similar pattern formations in PNUT during 2024 resulted in significant rallies after comparable shakeout moves
--- Strategic Entry Approach ---
The optimal strategy for this opportunity involves:
1. Waiting for the projected pullback to the 0.22 level, which provides both technical confluence and an excellent risk-reward ratio
2. Using a stop loss below the channel boundary (approximately 0.19) for clear invalidation
3. Taking partial profits at the mid-channel area (around 0.33) before allowing the remainder to run toward the 0.46 target
4H VIEW HERE
This technical setup suggests PNUT is preparing for a significant recovery rally over the coming weeks, offering a well-defined opportunity with precise entry, target, and invalidation levels.
HELP US WITH LIKE AND FOLLOW GUYS .. THANK YOU

#PNUT/USDT#PNUT
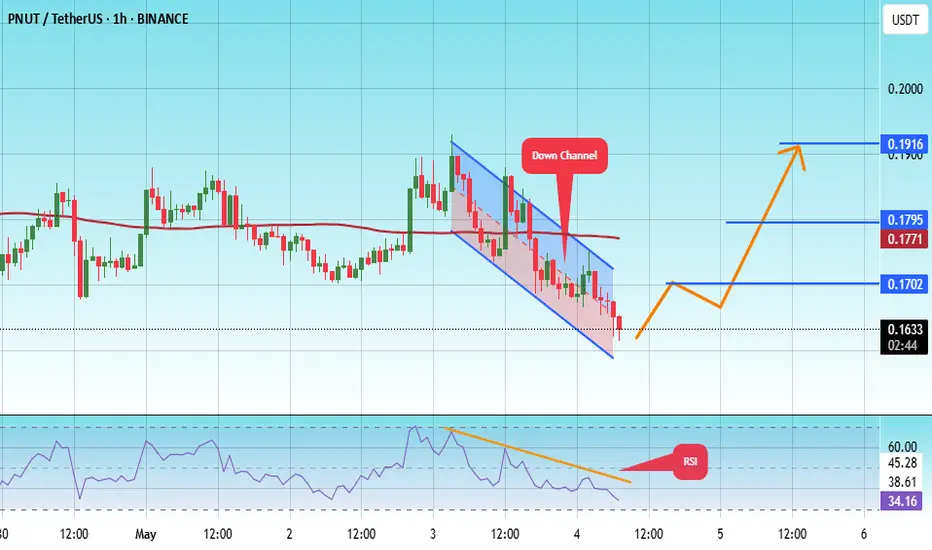
The price is moving within a descending channel on the 1-hour frame, adhering well to it, and is on its way to breaking it strongly upwards and retesting it.
We are seeing a bounce from the lower boundary of the descending channel, which is support at 0.1595.
We have a downtrend on the RSI indicator that is about to break and retest, supporting the upward trend.
We are looking for stability above the 100 Moving Average.
Entry price: 0.1633
First target: 0.1700
Second target: 0.1771
Third target: 0.1916
Testing Red Resistance – Breakout Potential!🚀 $PNUT Testing Red Resistance – Breakout Potential! 📈
$PNUT is currently testing the red resistance zone. If the price breaks through, the first target could be the green line level! 📊
Let’s catch this breakout together! 💼💸

"Deep Dive into PNUT: Chart Setup + Market Sentiment + Risk WarnPNUT (Peanut the Squirrel) is a meme-based ERC-20 token with a total supply of around 1 billion and a circulating market cap of approximately $287 million. Despite lacking any technical utility or innovative features, PNUT has seen massive short-term growth, gaining over 124% in the past 30 days, though it has corrected by over 21% in the last week. It reached an all-time high of $2.44 in November 2024. Technically, it recently broke out of a falling wedge pattern and shows bullish divergence on the RSI, indicating potential for another upward move. PNUT thrives on social media hype and community-driven momentum rather than fundamentals. While its current setup on the chart shows a favorable risk-reward for a spot trade, it remains a highly volatile and speculative asset. Investors should be cautious and fully aware that PNUT’s price is heavily influenced by internet trends and crowd sentiment, not intrinsic value or utility.

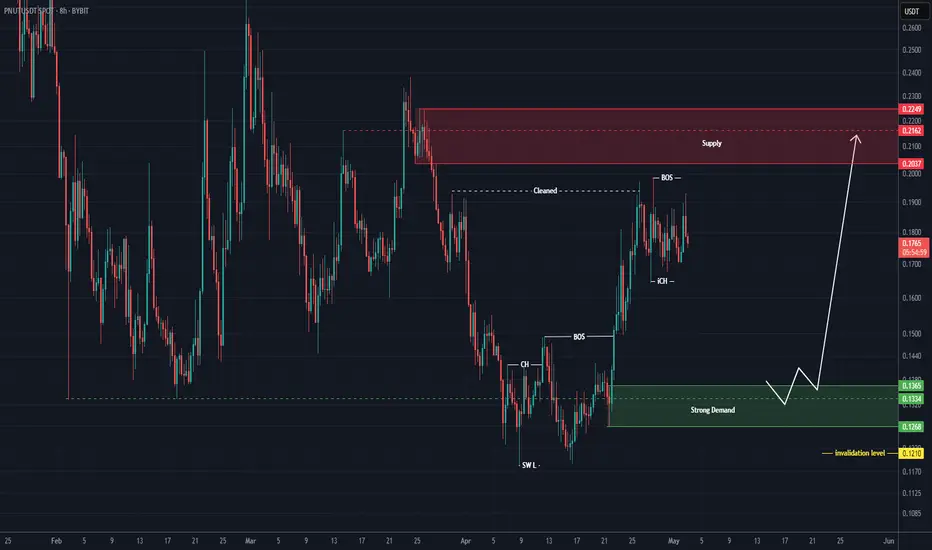
Strong rebuy setup for PNUT (8H)Note: This is not a sell/short setup | it is a buy/long setup.
After clearing resistance order blocks and a strong bullish move, buyers seem to have exhausted their momentum and may need a retracement for price to return to their base.
We are looking for a rebuy within the green zone. The price is likely to move from this area toward the red box.
A daily candle closing below the invalidation level will invalidate this analysis.
For risk management, please don't forget stop loss and capital management
Comment if you have any questions
Thank You
PNUTUSDT Analysis D1PNUTUSDT Building Up For Solid Breakout, Test Descending Trendline & On Verge Of Solid Breakout, usually This Type Consolidation Under Resistance Lead Massive Breakout, Expecting 2x After Breakout.

PNUTUSDT Ready to Rally!PNUTUSDT Technical analysis update
PNUTUSDT is breaking out of a wedge pattern on the daily chart after three months of formation. We also observed a bullish RSI divergence in the daily timeframe, along with a MACD bullish crossover a few days ago. A 50–100% move could be seen in the mid-term.

PNUTUSDT 1D AnalysisPNUT ~ 1D Analysis
#PNUT Buy gradually from here with a short -term target of at least 10%+ from here.

PNUT / USDT – Daily AnalysisBullish divergence spotted!
Price is printing lower lows, but RSI is making higher lows — a classic bullish divergence pattern. This signals potential trend exhaustion on the downside.
#PNUT is holding above a horizontal support level around 0.12–0.13 USDT, aligning with the divergence signal.
Volume is tapering off, indicating decreasing selling pressure.
RSI is currently around 37–38 and showing a higher low structure.
Key levels to watch:
Support: 0.1220–0.1300 USDT (current demand zone).
Resistance: 0.1650 USDT (local high), followed by stronger resistance at 0.2000–0.2200 USDT.
Scenario ideas:
If PNUT can hold above support and RSI continues climbing, we might see a relief rally towards the next resistance zones.
A breakdown below 0.1220 would invalidate this bullish setup and could lead to continuation of the downtrend. Still... bullish divergence then will become even more obvious....
Bias:
bullish short-term, watching for confirmation.
⚠️ Not financial advice. Always manage your risk!
#PNUT #Crypto #Altcoins #BullishDivergence #RSI #TradingView

Pnut scalp short to $0.2036I just opened a scalp short position on #pnut the squirrel memecoin.
In terms of structure its a a relatively high price and I think market will likely correct down further to find stronger support before any continuation.
This is also one of my DTT setups.

Peanut the Squirrel PNUT price analysis🐿 For #PNUT holders, there is good news and a little bit of "not so good" news)
🟢 Good - the formation of a reversal pattern continues
🟡 Not so good - so far, buyers have not managed to gain a foothold above $0.26
As soon as this happens, OKX:PNUTUSDT price will go up to at least $0.40 and $0.57
_____________________
Did you like our analysis? Leave a comment, like, and follow to get more

PNUTUSDT CHART ANALYSİS - EDUCATIONAL POSTHow NFT Technology Developed
NFT technology was created in 2017 based on Ethereum smart contracts. Since then, we have witnessed many successful NFT projects and deals. Stories like these perfectly describe the current and future possibilities of the technology.
The development of blockchain technology and the emergence of NFT services coincided with other processes in society and the economy. Many new players appeared in the stock markets, including non-professional traders and amateur investors.
The democratization of financial markets coincided with the pandemic: being in self-isolation, alone with their devices, many people began to pay attention to new financial instruments.
The information that arose around them also played a specific role in the “revival” of NFTs. The big names in the news headlines supporting NFTs couldn’t help but draw attention to them. That is one of the reasons why the success of the technology was inevitable.

PNUTUSDT 1DPNUT ~ 1D Analysis
#PNUT Buy after successfully penetrating this resistant line or buy after re -testing this support block with a short -term target of at least 15%+.

pnut the squirrel big short! -10%I shorted pnut.
Target $0.1565
Setup aligns with my DTT strategy.(Direction, Target and Timing)
Roughly 5 RR trade. Might scale in later on.
Still monitoring my entry to exit and re-enter if needed. Am confident in the direction and target just a matter of timing the entry now.
Should be relatively smooth drop once 0.1687 weak support is cleared.

PNUT looks bearish (4H)It appears to be completing a triangle, currently in Wave E.
From the red zone, it may move downward.
Below the chart, there is a liquidity pool, which could be the price target for a sweep.
The invalidation level is slightly far, so proper risk management and position sizing should be maintained
For risk management, please don't forget stop loss and capital management
When we reach the first target, save some profit and then change the stop to entry
Comment if you have any questions
Thank You

PNUT Technical Outlook
A hold above $0.1406 (Fibo buy zone) increases confidence in upside continuation.
A failure to hold this support could lead to another retest before confirming reversal.
✅ Conclusion: #PNUT is forming a bullish structure near its major support. If it holds and confirms bullish momentum, expect a potential rally towards $0.3184 - $0.4490. 🚀🔥
🎯 Price Targets:
🔹 T1: $0.3184 - Initial resistance target.
🔹 T2: $0.3845 - Key breakout level.
🔹 T3: $0.4490 - Potential full bullish extension.

PNUT Sell/Short Setup (2H)A large liquidity pool has formed below the price.
We have not yet seen a bearish CH on the chart, but in the supply zone, considering the invalidation level as a stop, we can enter a sell/short position.
If the invalidation level is touched, it will invalidate this setup.
Do not enter the position without capital management and stop setting
Comment if you have any questions
thank you

$PNUT continues its bearish trend
$PNUT unable to break the resistance and couldn't hold the trendline, gave a sell setup as it continues its overall bearish trend.
Let's ride this short setup to 0.14
TP 1: 0.18
TP 2: 0.14

PNUT Ascending Broadening WedgePrice completed a Harmonic pattern with subsequent decline to 0.21 and is now within an Ascending Broadening Wedge, which is a bearish pattern. Just posting what I see and the potential that could play out...