Pop chat chartPop cat chart with key levels.
Price should keep support and climb on top of resistance for the bull run to continue, if it goes under support it will drop to the initial pump point
POPCATUSDT trade ideas

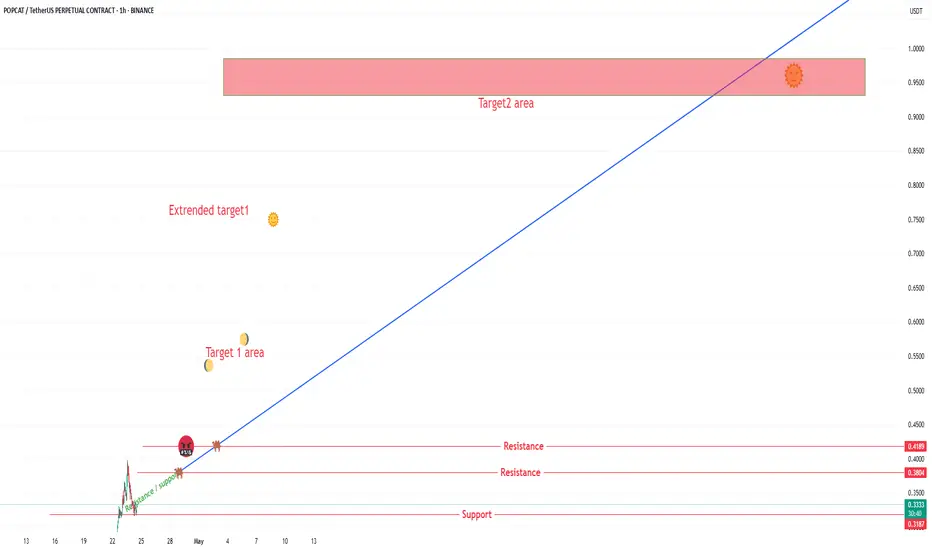
Pop cat chartPop cat chart. Key levels, right now price is at major resistance, and it can turn bullish once on top of it.
Each target can reject to a new low, or push to a new high.
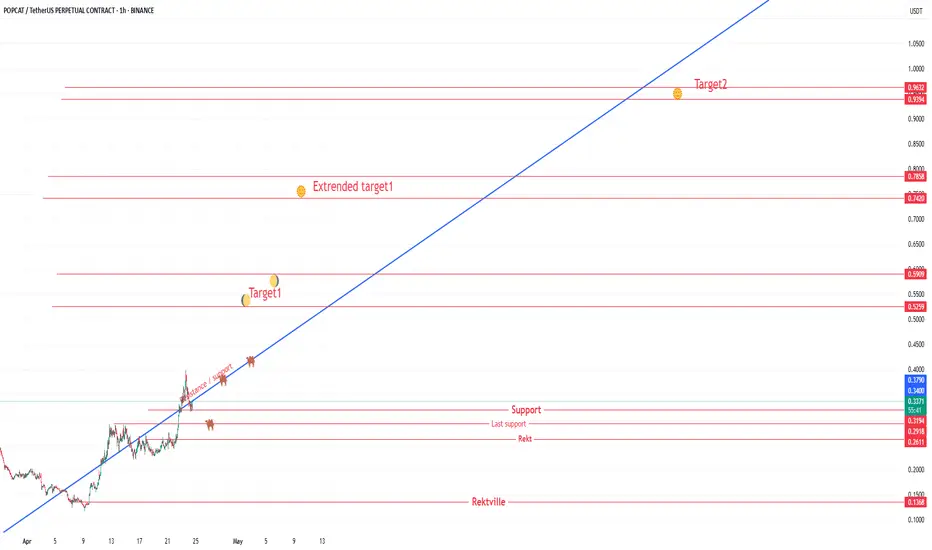
Pop cat chartPop cat chart.
All lines are support / resistance and can reject to new lows or push to new highs.
The little pictograms don`t mean anything, or do they? I guess we will find out.
If support is broken price will drop to the point of the initial pump.
we wait for BTC... we wait BTC to touch trendline again somewhere at 78-80k$ ... so, in that case I think PopCat will fall and then rise wit him

POPCAT SHORTCrypto Introduction
$Popcat is a meme coin on the Solana chain on a recent vertical run — now showing signs of overheating printing lower low/high. Entry at volume area high + 0.382fib + 15m gap.
Stop just above the highs, targeting a retrace to the next support for 2.55R.

...bounce back from 61. fibonacci on 4h chart?...bounce back from 61. fibonacci on 4h chart?
... it looks like nice support,... If BTC bounce back... POPCAT will follow

POPCAT/USDT Analysis – Trend Reversal
The short-term downtrend on this coin has shifted into a strong bullish trend.
During the rally, we broke through the sell zone at $0.182–$0.195 without any significant reaction, forming a mirrored zone as a result.
At this point, entry opportunities could be considered on a pullback to the $0.195–$0.18 zone , or from the lower support area at $0.173–$0.16 .

POPCAT rally stopped. False breakoutPOPCAT is testing the trend resistance.
The counter-trend growth is stopped by the descending resistance. Bears are not ready to give up. A false breakout is formed against 0.2143 and downtrend resistance
Scenario: false breakout of resistance and correction or continuation of the trend.
Consolidation below 0.2143 (or below the downtrend line) will be the entry point.

POPCAT at the verge of Breakout $POPCAT/USDT is forming a falling wedge on the daily chart, a bullish reversal pattern. Price recently bounced from the descending support and is now approaching the minor resistance zone near $0.21.
A breakout above the resistance trendline could signal a trend reversal and trigger upside momentum. RSI at 45.93 is rising, supporting the bullish bias. Confirmation above the wedge is key for further upside.
DYOR, NFA

popcat Outlook after the Dip. What to expect NOW?Finally, the price broke the wedge, and the price experienced a significant drop. I think now is the time for POPCAT to rise again to 0.26 . STRONG SUPPORT 0.382=0.18.
Give me some energy !!
✨We spend hours finding potential opportunities and writing useful ideas, we would be happy if you support us.
Best regards CobraVanguard.💚
_ _ _ _ __ _ _ _ _ _ _ _ _ _ _ _ _ _ _ _ _ _ _ _ _ _ _ _ _ _ _ _
✅Thank you, and for more ideas, hit ❤️Like❤️ and 🌟Follow🌟!
⚠️Things can change...
The markets are always changing and even with all these signals, the market changes tend to be strong and fast!!

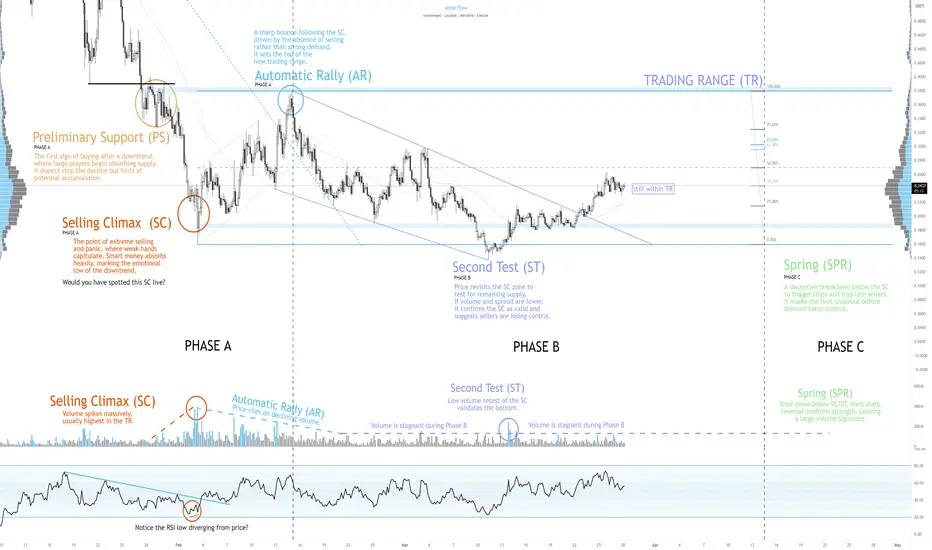
Accumulation, when spring?This is $POPCAT / #POPCAT
I don’t think the bottom is in yet. The volume signature and price action still don’t align with a true Spring. but hey, alts have bottomed like this before.
This doesn’t mean the top of this rally is in either.
If we stall around the 0.5–0.618 fib, I’d expect one more leg down, a proper Spring would be ideal.
But if we rip to the top of the trading range, I’ll be watching the 0.618 retrace measured from the ST low to the Phase B high.
Just something to keep on your radar
POPCAT...Hello friends
Given the good price growth and the arrival of buyers, you can enter into a transaction during the price correction with capital and risk management.
*Trade safely with us*

POPCAT ideaGreetings, fellow traders!
My analysis suggests a developing potential for a bullish move in POPCAT/USDT. I'm observing a possible breakout scenario, and I'll outline a potential long trade setup.
Entry Rationale:
A long entry is suggested above the $0.2135 level, contingent upon a confirmed breakout from the currently established neutral-bullish channel. This breakout would serve as confirmation of increasing bullish momentum.
Trade Setup:
Entry: Above $0.2135 (post-breakout confirmation)
Target 1: $0.2435
Target 2: $0.2650
Stop-Loss: $0.1910 (This provides a risk management level below a recent swing low, it's just an idea.)
Risk Management:
A stop-loss order placed around $0.1910 is recommended to mitigate potential losses should the trade move against the anticipated direction.
Disclaimer and Call to Action:
I welcome your constructive feedback and alternative perspectives on this analysis. Please conduct your own independent research and due diligence, including thorough risk assessment, before making any trading decisions. This analysis is for informational purposes only and does not constitute financial advice.

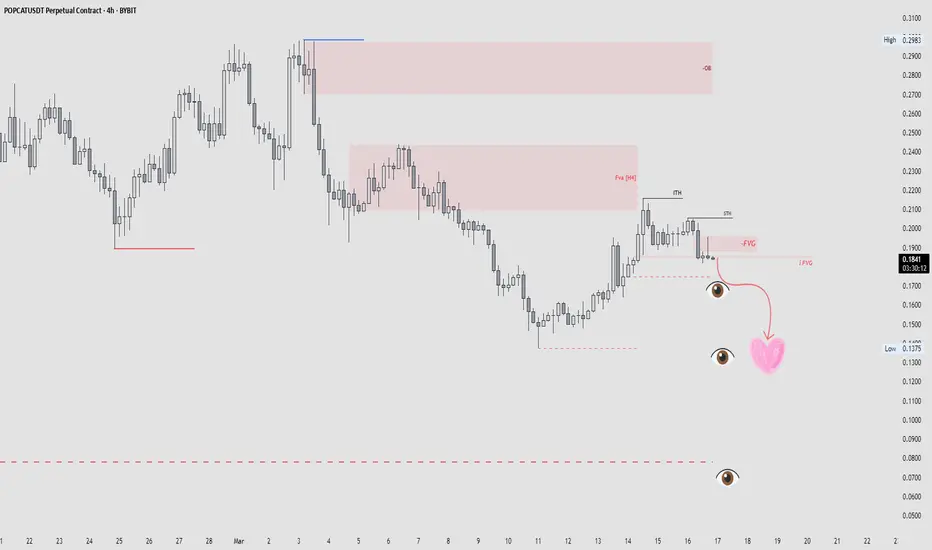
POPCCATUSDT Sell IdeaI’m currently selling PopcatUSDT based on the H4 bearish order flow. My target is the recent low. There’s also an unmitigated order flow zone above near a key level — if price retraces there, I’ll look for another sell entry from that zone as well
POPCATUSDT → False breakout of bearish trend resistanceBINANCE:POPCATUSDT.P is testing trend resistance on the 4H timeframe. A sharp approach and a false breakdown of the upper boundary of the channel may provoke a correction or continuation of the decline
The global trend is downtrend, the locational trend also coincides with the global trend. Bitcoin cannot become a bullish driver for altcoins yet. Yesterday's economic news also had a negative impact on the market. In addition, the cryptocurrency community was betting big on Trump, but he has put cryptocurrencies on the back burner.
Technically, POPCAT is testing the channel resistance with a false breakout within the downtrend. Consolidation of the price below 0.322 could trigger further selling.
Resistance levels: 0.322, correction resistance
Support levels: 0.2386, 0.1596
I do not exclude the possibility of retesting the resistance of the correction channel, but due to bearish pressure and weak market the decline may continue.
Regards R. Linda!

POPCAT 1D MARCH 2025If this Bullish Flag go for its target we will be in the real bottom of the Abyss (Going to fking ZERO XD)
But there’s still a chance to form a Falling Wedge pattern to save the day
We’ll see

Technical Analysis of POPCATUSDT (1D)1. Trend and Market Structure
The price is in a potential reversal phase after a prolonged downtrend.
A base formation can be observed at the bottom, indicating possible accumulation.
There is a consolidation channel, marked in blue, which could serve as an accumulation zone before a potential upward move.
2. Support and Resistance Levels
Support:
The main support zone is at 0.2376 USDT.
If the price fails to hold above this level, a retest of the area below 0.22 USDT is possible.
Resistance:
The nearest resistance zones are at 0.40 USDT, 0.60 USDT, 0.80 USDT, with a global target at 1.00 USDT.
These levels align with the pink horizontal lines on the chart.
3. Indicators and Divergences
RSI Divergence Indicator:
A bullish divergence is visible on the RSI, marked in green (Bull), signaling a possible upward move.
The RSI is currently around 45.39, not indicating overbought conditions, leaving room for potential growth.
Volume:
The 24-hour volume is 68.32M, suggesting increased interest in the asset.
4. Possible Scenario
Bullish Scenario (Primary):
A breakout above the upper boundary of the channel (around 0.27–0.28 USDT) with a retest could push the price toward 0.40 USDT.
If market support continues, the price could reach 0.60–0.80 USDT in the medium term.
Bearish Scenario (Alternative):
If the price fails to stay above 0.2376 USDT, a decline to lower support levels could follow.
Conclusion
A bullish divergence and accumulation are present, providing a basis for an upward breakout.
The key level to confirm the uptrend is 0.27–0.28 USDT.
Main targets in case of an uptrend: 0.40, 0.60, 0.80, 1.00 USDT.
Control level below: 0.2376 USDT (if broken downward, the bullish scenario is at risk).
☑ Recommendation: Monitor the volumes and price reaction around 0.27–0.28 USDT. A breakout above this zone could open the door for a stronger rally.

POPCATUSDT is setting up for a potential long opportunity!
🚀 The price BINANCE:POPCATUSDT.P is testing a critical support level at 0.2056 USDT , and if bulls hold, we could see a strong upward push.
🔑 Key Levels:
Support:
- 0.2056 USDT – Key support, maintaining the trend.
- 0.2010 USDT – Deep liquidity zone for potential wicks.
Resistance:
- 0.2200 USDT – Short-term target for scalpers.
- 0.2774 USDT – Major resistance; breaking above could trigger a rally.
🚀 Trading Strategy:
Long Entry: On a clear bounce from 0.2056 USDT with volume confirmation.
Stop-Loss: Below 0.2010 USDT to avoid liquidity grabs.
Profit Targets:
- 0.2200 USDT – First take-profit for quick gains.
- 0.2500 USDT – Solid mid-term target.
- 0.2774 USDT – Full extension if momentum builds.
📊 Technical Outlook:
- The trend remains bullish as long as support holds.
- Increased volume at support suggests whale accumulation.
- A break below 0.2010 USDT may invalidate the bullish setup.
💡 What to Watch?
- Volume spikes = strong bullish interest.
- Retest of support with a strong bounce = long entry signal.
- Manage risk and avoid FOMO!

POPCAT (What a beautiful previous prediction days ago)i posted a chart days ago about POPCAT.
That short gave us 10% 👍
Now there are some new levels, which each can give at least 2% reject for Short.
Lets see how POPCAT acts when reaches those levels (volume and TA etc.)
Look at it previous Signal here. Link :
Follow for more ideas/Signals. 💲
Look at my other ideas ;)
Just donate some of your profit to Animal rights and rescue or other charity :)✌️

Long POPCATInverse Head and Shoulders pattern has formed on the Popcat chart. The bullish movement to the resistance level at $0.38 is expected to happen

POPCatit doesnt look really well (like many other altscoins.
there are very possible dump again.
Very bad Volume situation !
Maybe its even too late to short right from here 🙄
Follow for more ideas/Signals. 💲
Just donate some of your profit to Animal rights and rescue or other charity :)✌️

POPCAT due for a rallyOnce the most pumpy of memes, has fallen from grace... but I believe a big rally is on the horizon..
Testing high timeframe trendline, macro 786..
Falling wedge pattern forming..
And bullish divergence on 4h and 12h timeframe.. Selling volume decreasing...
This is in the process of bottoming out in my honest opinion..

POPCAT is due to pop (upwards). Beach ball underwaterTo add to my previous analysis on the linear scale, the log scale paints an even clearer picture that this is indeed, the most ideal spot for a reversal in popcat.
Log 786 retracement tapped, lower bound of the channel tapped, fib time 0.618 reached, bullish divergence on the oscillators.
This is a generational entry, with targets as high as $12 possible during this crazy bullrun we are about to witness in crypto.
