K-Electric Ltd. (KEL) - Technical AnalysisChart Date: November 21, 2025 | Current Price: PKR 5.69 (-0.35%)
📊 Market Overview
K-Electric is currently trading at PKR 5.69, showing consolidation after a significant decline from the August highs of 8.50+. The stock is forming a critical technical pattern that suggests an imminent directional move.
🔍 Technical Pattern Analysis
Symmetrical Triangle/Pennant Formation
The price action over the past month has created a symmetrical triangle (pennant) pattern, characterized by:
Lower highs following the rejection from 8.50 resistance
Higher lows supported by an ascending trendline from August
Converging trendlines indicating decreasing volatility
Compression zone suggesting a breakout is approaching
Pattern Implication: Pennants typically act as continuation patterns, but context matters. Given the recent price action and support structure, this could resolve bullishly.
📈 Key Technical Levels
Resistance Zones
Immediate Resistance: 6.00 - 6.10 (breakout confirmation level)
Primary Target: 6.70 - Major horizontal resistance with significant prior consolidation
Extended Target: 7.30 - 7.50 (previous support turned resistance)
Major Resistance: 8.00 - 8.50 (all-time high zone marked in brown)
Support Zones
Immediate Support: 5.50 - 5.69 (current price level)
Critical Support: 5.20 - 5.30 (ascending trendline)
Strong Support: 4.90 - 5.00 (multi-touch support from August/September)
Ultimate Support: 4.60 (rising trendline base)
🎯 Price Projection: The Case for 6.70
Why 6.70 is a Realistic Target:
1. Historical Price Action
The 6.70 level acted as a significant consolidation zone in late October/early November
Multiple candlesticks clustered around this area show strong institutional interest
This represents approximately 18% upside from current levels
2. Technical Pattern Measurement
The pennant's height (from consolidation high to low) projects to similar targets upon breakout
Risk-reward ratio favors bullish positioning with tight stop-loss below 5.20
3. Market Structure
Higher lows pattern since August indicates underlying accumulation
Each dip has been met with buying interest at progressively higher levels
📉 Volume Analysis
Declining volume during the pennant formation (typical pre-breakout behavior)
Volume spikes visible at key reversal points
A breakout requires volume confirmation - watch for 2-3x average volume on the breakout candle
🔔 Trading Strategy
Bullish Scenario (Probability: Moderate-High)
Entry: Break and close above 6.00-6.10 with strong volume
Target 1: 6.70 (Primary objective)
Target 2: 7.30 (Extended target)
Stop Loss: Below 5.20 (below ascending trendline)
Risk-Reward: Approximately 1:3
Bearish Scenario (Alternative)
Trigger: Break below 5.20 support
Target: 4.90 - 5.00 support zone
Invalidation: Reclaim above 5.50
⚠️ Key Catalysts to Watch
Breakout Confirmation: Clean break above 6.10 with volume
Trendline Test: Any retest of 5.20-5.30 support should hold
Sector Sentiment: Monitor broader Pakistan equities and utility sector performance
Volume Surge: Accumulation or distribution patterns
🎓 Conclusion
K-Electric is at a critical inflection point within a well-defined pennant pattern. The technical setup suggests:
✅ Strong support structure from the ascending trendline
✅ Decreasing volatility indicating a breakout is near
✅ 6.70 target is achievable with proper breakout confirmation
✅ Favorable risk-reward for swing traders
Recommendation: Watch for a decisive break above 6.10 with volume. If confirmed, the path to 6.70 becomes highly probable. However, a break below 5.20 would negate the bullish thesis.
📱 Trade Plan Summary
Parameter Value
Current Price PKR 5.69
Entry Zone 6.00 - 6.10 (on breakout)
Target 1 6.70 (+18%)
Target 2 7.30 (+28%)
Stop Loss 5.15 (-9%)
Pattern Symmetrical Triangle/Pennant
Timeframe 2-4 weeks
Disclaimer: This is technical analysis for educational purposes only. Always do your own research and consult with a financial advisor before making investment decisions. Past performance does not guarantee future results.
Chart Source: TradingView | Analysis Date: November 21, 2025
K-Electric Ltd.
No trades
Trade ideas

PSX KELChart characteristic
43% 44% correction then start new rally
Now 40% correction is complete anticipation for new rally new high.

KELprice make a new weekly High but fail to sustain above that level.
In the very next week the price drop sharply.
High then Drop

KEL (LONG)🔹 Chart Characteristics (KEL Weekly – PSX)
1. Repetitive Time Cycle Behavior
Each bearish or sideways phase lasts about 43–48 bars (weeks) — roughly 300–340 days (around one year).
This indicates that KEL follows a repeating yearly cycle:
→ One year of decline or accumulation, followed by a strong breakout rally.


K-Electric Ltd. (Daily chart analysis):Current Situation: 📊
Price: 5.62 PKR, down 7.57% 📉
Volume: 194.9M - MASSIVE panic selling! 😱
This is a high-risk, volatile stock with wild swings ⚠️
The Story So Far: 📖
K-Electric has been a roller coaster ride for the past 2+ years! Multiple boom-bust cycles with no sustained trend. Recently had a parabolic spike to 8.70 (the highest in years) and is now crashing back to reality. 🎢
Key Support/Resistance Levels: 🎯
Resistance:
Immediate: 6.00-6.20 (psychological + recent lows)
Strong: 6.60-6.80 (previous consolidation)
Major: 7.00-7.40 (multiple rejection zone)
Extreme: 8.50-8.70 (recent blow-off top)
Support:
Current: 5.40-5.60 (trying to hold here)
Critical: 5.00-5.20 (psychological round number)
Strong: 4.50-4.70 (previous consolidation base)
Major: 4.00-4.20 (deep support from earlier this year)
Ultimate: 3.60-3.80 (multi-year low zone)
Pattern Analysis: 📐
Repeated pump and dump cycles - Classic speculative stock behavior
Three major spikes in 2 years (Dec 2023, Dec 2024, Oct 2025) all followed by crashes
Each spike slightly higher, but corrections equally brutal
No sustained uptrend - just violent moves in both directions
Currently in free fall from the latest spike
Volume Behavior: 📊
Huge volume spikes during rallies = Speculative frenzy 🌊
Today's 194.9M is elevated = Distribution/panic
Volume comes in waves - quiet periods then explosions
High volume on down days = More pain ahead 😰
Technical Outlook: 🔮
Short-term (1-2 weeks): 📉
Bearish - Expect continued downside
Target: 5.00-5.20 zone (-10% more)
No buying interest visible yet
Dead cat bounces possible but risky 🐱
Medium-term (1-3 months): 😐
Could base between 4.50-5.50
Needs time to shake out weak hands
Watch for volume to dry up (bullish sign)
Likely choppy, sideways action
Long-term (3+ months): 🤷♂️
History suggests another spike eventually
But timing is impossible to predict
Could stay dead for months before next pump
Not an investment - purely speculative play
Trading Strategy: 💡
For Current Holders: 😰
If you're down big, consider cutting losses at 5.40 break
If you're profitable from lower levels, take some profits!
This stock doesn't reward loyalty 💔
Stop loss: 5.30 (limit damage)
For New Buyers: 🤔
Stay away from falling knives! 🔪
Wait for clear base formation at 4.50-5.00
Only for aggressive traders with tight stops
Risk/reward not favorable here
Better opportunities elsewhere
For Speculators: 🎲
IF you're brave: Watch for capitulation at 5.00
Tiny position with stop at 4.80
Target quick 10-15% bounce to 5.60-5.80
Don't marry the trade - in and out quickly! ⚡
Risk Assessment: ⚖️
🔴 VERY HIGH RISK 🔴
Extreme volatility stock
No fundamental story visible
Pure speculation/momentum play
Easy to get trapped
History of brutal reversals
What Could Go Right: ✅
Finds support at 5.00 and bounces
Sector news/catalyst emerges
Speculators return for another round
Technical oversold bounce
What Could Go Wrong: ❌
Breaks 5.00 and cascades to 4.50 or lower
More distribution ahead
Gets stuck in low-volume doldrums
Another 20-30% drop possible
Bottom Line: 🎯
K-Electric is a speculative trader's stock, not an investor's holding. The recent spike to 8.70 was pure euphoria, now reality is setting in. The smart move is to wait on the sidelines until it finds a solid base around 4.50-5.00. Don't try to catch this falling knife - let it hit the ground first! 🔪➡️📍
Stock Character: 🎭
This is the "bad boy" of PSX - exciting but dangerous. Great for 20-30% momentum trades but will break your heart if you hold too long! 💔

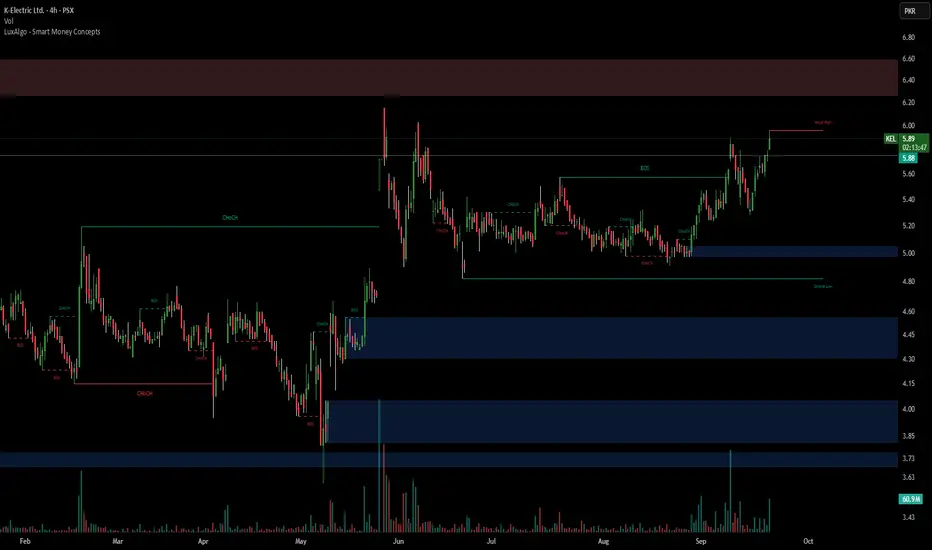
K-Electric Ltd. (KEL) - Technical Overview K-Electric Ltd. (KEL) - Technical Overview
Current Status: The stock is trading at 6.27 PKR, down 0.06 (-0.97%) with a volume of 38.32M shares.
Key Technical Observations:
Recent Price Action:
Strong uptrend from September 2025, rallying from around 5.10 to a peak near 8.50
Sharp rejection at the 8.50 resistance zone (marked in brown)
Currently in a corrective phase, down approximately 26% from the recent high
Support & Resistance Levels:
Immediate Support: 5.90-6.00 (recent swing low)
Major Support Zone: 5.10-5.30 (blue zone - previous consolidation area)
Key Resistance: 7.50-8.50 (brown zone - recent rejection area)
Lower Support: 4.20-4.50 (blue zone) and 3.60-3.80 (major historical support)
Technical Structure:
Multiple BOS (Break of Structure) and CHoCH (Change of Character) labels suggest smart money concepts/liquidity sweeps
The price shows a pattern of ranging between major support/resistance zones
Volume spike during the recent rally and selloff indicates institutional participation
Current Outlook:
Bearish short-term momentum after the sharp rejection
Testing the 6.00-6.27 area which could act as minor support
A break below 5.90 could lead to a retest of the 5.10-5.30 support zone
For bullish continuation, needs to reclaim 7.10+ levels
The chart suggests the stock is in a corrective phase after an overextended rally, with key support zones below that could provide buying opportunities.

KEL Technical OutlookKEL faces initial resistance around 7.60. A sustained break above this level could pave the way for a test of the initial resistance zone around 9.25 and then final resistance around 10.85. However, failure to surpass 7.60 may result in a rejection towards the support area around 6.31, below this is considered the stop-loss level for the price. Overall trend is positive, watch out the levels of support and resistance to make a trade in it.
Note: Whenever a resistance level breaks price comes back to make it support for the next pull up.

KEL Weekly Breakout SetupKEL has broken out of its weekly supply zone and is currently trading above it. A retracement toward the breakout zone or the 0.382 Fibonacci level can offer a good buy opportunity, with a stop loss below the last low and a take profit target near the all-time high.

KEL – TECH BUY CALL | 1W | 01 OCT 2025 | By The Chart Alchemist KEL – TECH BUY CALL | 1W | 01 OCT 2025 | By The Chart Alchemist
The stock reversed upward sharply after completing its severe downtrend, achieving a high of PKR 6.3. After a lateral pullback forming a DB bull flag, the stock has broken out of a key resistance level at PKR 6.80.
📢 Disclaimer: Technical analysis by Mushtaque Muhammad (The Chart Alchemist).

K-Electric - Quick AnalysisCurrent: 5.90 PKR (-2.61%)
Key Points:
Trading in sideways range 5.0-6.0 PKR since May
Failed breakout attempts above 6.0 PKR
Currently at upper range resistance
Low volume = weak momentum
Signal: NEUTRAL/RANGE BOUND
Action:
Range traders: Sell at 5.9-6.0 PKR, buy at 5.0-5.2 PKR
Breakout traders: Wait for volume confirmation above 6.0 PKR
Stop loss: Below 4.9 PKR
Targets:
Resistance: 6.0-6.2 PKR
Support: 5.0-5.2 PKR
Risk: Low volatility stock, suitable for range trading until breakout occurs.
KEL is heading to 5KEL technically enters in bullish trend and it is expected to cross 5 level.
Note: this is not a buy sell call. Use SL too.

KEL🚀 Stock Alert: KEL
📈 Investment View: Technically Bullish 📈
🔍 Quick Info:
📈 Entry Level: 4.50
🎯 First Target: 5
🎯 Second Target: 5.50
⚠ Stop Loss: 4
⏳ Nature of Trade: Short Term (Scalping)
📉 Risk Level: Medium
☪ Shariah Compliant: YES
💰 Dividend Paying: NO
📰 Technical View: The price action pull back from its trend line and currently trading in a consolidation phase. Upon break out price can test its initial resistance around 5 and upon breaching secondary resistance lies around 5.50. Use stop loss at 4.50 if it breaks downward to manage risk.

Avoid buying KEL right nowHead & Shoulder pattern has been formed on KEL and it has already break the neckline. Buying in KEL should be consider on the levels of 3.70 - 3.50. Strong bearish divergence on RSI weekly and Monthly is also there. Trade with strict stoploss.

KELAB=CD pattren play beark B point and retracment complete at fib level 0.50%
buy 5.32
SL 3.53
TP 8.07

KEL K-Electric LimitedThe stock displays a bullish flag pattern on strong volume, trading confidently above both the 20 and 200-day EMAs, suggesting robust upward momentum. Yesterday witnessed some profit-taking following the formation of a double top. However, a decisive break above the flag's resistance level will confirm the continuation of the bullish trend.
Trading Strategy:
* Buy: Enter at 5.91
* Targets: 8.84, 11.59
* Stop-Loss: 4.79

KEL | Death CrossTechnical Analysis of KEL (K-Electric Limited) Shares
Current Price Behavior and Key Indicators:
Establishing Pattern of Death Cross: KEL shares are currently exhibiting a technical pattern known as a "death cross," which occurs when the 50-day Simple Moving Average (SMA) crosses below the 200-day SMA. This pattern is often interpreted as a bearish signal, suggesting that a downtrend may be in place or could be developing.
Resistance Level: The stock is facing significant resistance around the 4.45 level. This price point has proven challenging for the stock to surpass, indicating a potential barrier for upward momentum. If KEL fails to break through this resistance, the bearish outlook may continue to gain strength.
Support Level: Major support is identified around the 4.00 level. This price point has historically provided a floor for the stock’s price, where buying interest tends to emerge. A break below this support could signal further declines and might lead to testing lower levels.
Trading Below 200-Day Simple Moving Average: KEL shares are currently trading below their 200-day SMA, a key long-term trend indicator. When a stock trades below this moving average, it typically suggests a prevailing downtrend and indicates that market sentiment is negative.
Overall Sentiment:
Given the establishment of a death cross pattern, resistance at 4.45, major support around 4.00, and trading below the 200-day SMA, the overall technical outlook for KEL shares is bearish. Investors should be cautious and consider these indicators when making trading decisions.

KEL - BULLISH KEL is currently in a bearish trend on 15min chart,
divergence was printed there's a possibility of reversal from this zone
long entry is recommended

KEL | Next Support!KEL is facing selling pressure and can test its support level of 4. If the selling pressure resumes and the buyer gets active then a possible pull back is expected towards the trend line resistance around 5.50.

KEL🚀 Stock Alert: KEL
📈 Investment View: Technically Bullish 📈
🔍 Quick Info:
📈 Buying Range: 4.70-4.80
🎯 First Target: 5.40
🎯 Second Target: 6
⚠ Stop Loss: 4.25
⏳ Nature of Trade: Short Term (Scalping)
📉 Risk Level: Medium
☪ Shariah Compliant: YES
💰 Dividend Paying: NO
📰 Technical View: The price is rejecting after making a top of 5.41 and currently near to its support level that lies around 4.80-4.70 from where pull back is expected. Upon confirmation long position can be consider for the target of 5.40 and upon break and sustain it can trigger towards 6 rupees. Use stop loss at 4.25 to manage risk.

KEL Inverted Head & Shoulder PatternIt is advisable to consider the formation of an inverted head and shoulders pattern, suggesting a potential trading opportunity. A suggested entry point would be at the right shoulder, indicated at 4.50. Following the breakout above the neckline, resistance is anticipated at 5.80, presenting a potential gain of 30% post-accumulation. It is noteworthy that a significant supply zone is identified at 6.30.
Thank you for reading.
If you boost, I know you enjoyed the content and I can continue to publish more.
Feel free to follow.
Thanks a lot for your support.
Assalam O Alikum.

KEL🚀 Stock Alert: KEL
📈 Investment View: Technically Bullish 📈
🔍 Quick Info:
📈 Entry Level: 4.35
🎯 First Target: 4.85
🎯 Second Target: 5.20
⚠ Stop Loss: 3.90
⏳ Nature of Trade: Short Term (Scalping)
📉 Risk Level: Medium
☪ Shariah Compliant: YES
💰 Dividend Paying: NO

