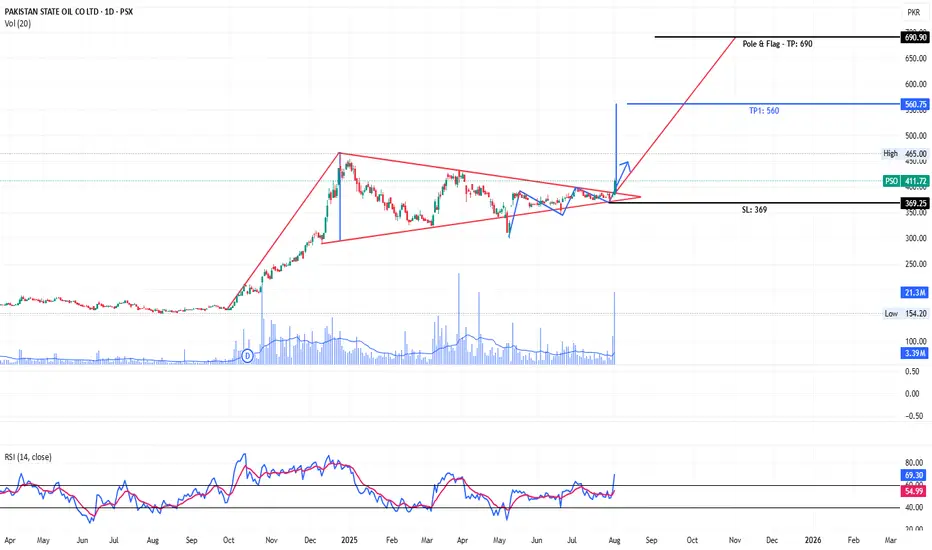
PSO TO THE MOON ...The script PSO has formed a bullish flag pattern and the breakout is seen on the charts... the potential target looks like at Rs. 619 with resistances in between.... it seems an easy setup to make 1:3 risk reward trade.....
The company is fundamentally strong and technical at good levels to enter into the trade....
Trade ideas

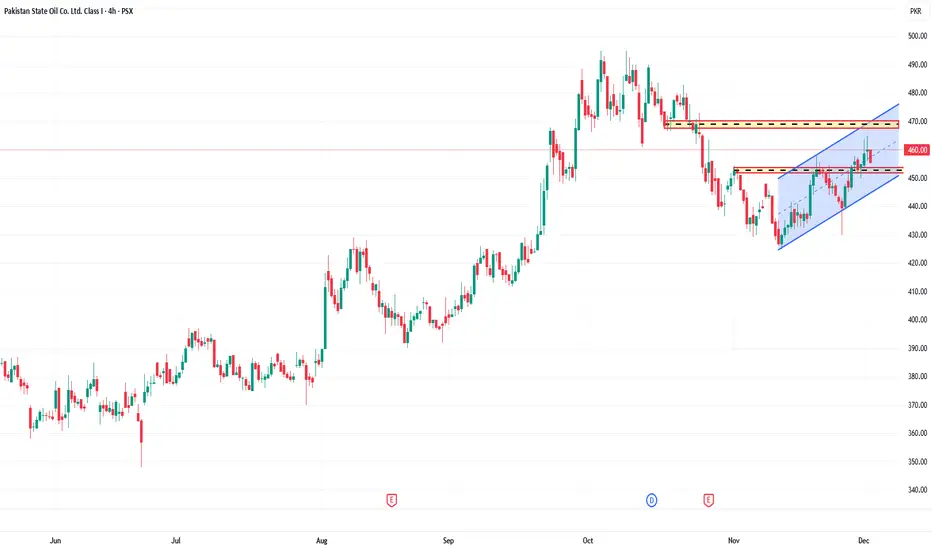
PSO - Short Term Round bottom formationPSO is developing a well-defined rounded bottom on the 1H chart, with price now approaching the major neckline at 480. A decisive breakout above this zone would confirm the reversal pattern and open the door for continuation toward higher resistance levels. Bullish structure remains intact while holding above 450–455

PSOPSO is currently trading inside a rising channel, showing short-term bullish momentum after completing a major correction from the 480₨ area.
Channel Support: ~442–445
Channel Resistance: ~468–472
Price is closer to the upper boundary of the channel, meaning upward momentum is present but a pullback is possible.
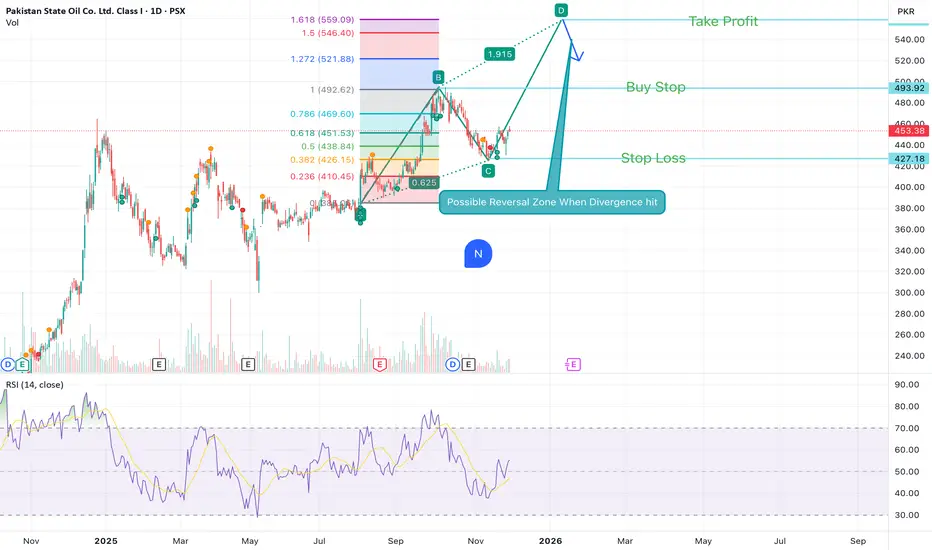
PSO PSX Chart Analysis 29-Nov-25Bullish AB=CD Continuation Pattern.
Stop Loss:427 PKR
Buy Stop:493 PKR
Take Profit:558 PKR
After hitting 558 PKR there is a (Possible Reversal Zone)
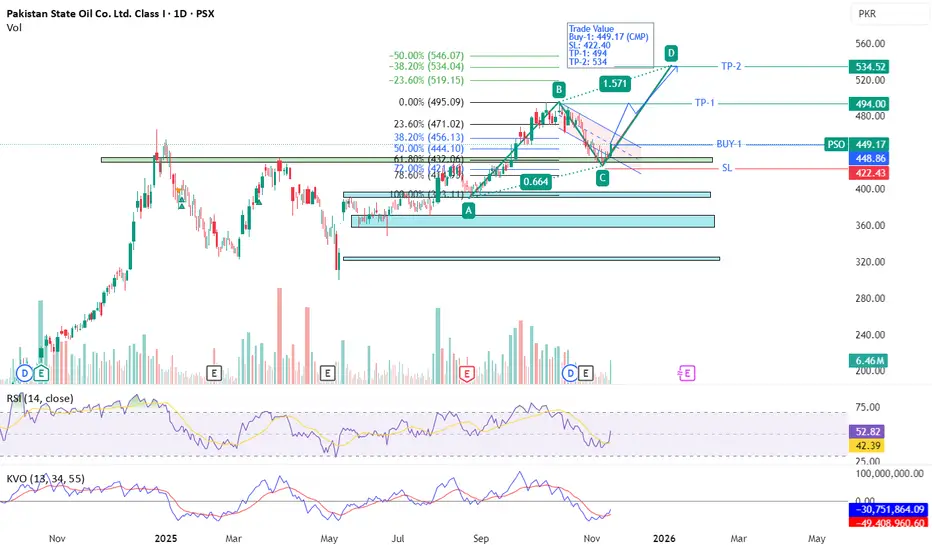
PSO - PSX - Technical Analysis AB=CDOn daily TF, PSO has retraced to Fib 62% and then went up after staying there for a few days. Closing of a Green Candle with volumes indicates that Buyers are active now. Also noted that KVO trigger line (Blue) has just crossed over the Signal line (red) indicating interest of Buyers although it is yet below zero level but its direction seems quite vertical. Also RSI is also moving up very sharply and still it has room to move up quote a bit. AB=CD pattern has been drawn to arrive to the TP.
Trade Value
Buy-1: 449.17 (CMP)
SL: 422.40
TP-1: 494
TP-2: 534
PSOPSO has bounced strongly from the 430–440 support with RSI turning upward, signalling renewed momentum. On the weekly timeframe, the structure has formed a classic Cup & Handle, adding confluence to the bullish bias.
Upside Targets: 494, 522, 560, 614
Bias remains bullish as long as price holds above 435–440.

PSO possible short trade setupUpon the basis of monthly range,
This can be a good short setup idea.
Only one confirmation is required more which will make it high probability A+ setup.
The candle body close below 429 before further retracement.
We can expect this setup on coming Tuesday or Wednesday

Play on Levels.PSO
Closed at 439.77 (07-11-2025)
Though Bullish on bigger time frame but
there is a Strong Bearish Divergence that
is dragging the price down.
However, Short Term Traders may find a
Quick Gain of 15 - 30 rupees from the
current level but the real upside momentum
will start once it will cross 490.
& if the current level is Not Sustained, we
may find the Next Support around 385 - 390.

PSO – Daily Time Frame AnalysisBuy Setup:
Buy above: 497
Stop Loss: 447
Target Price: 615
Technical Outlook
The chart shows a strong ascending channel (green trendline).
Current price (~343) is consolidating above the trendline support near 466, indicating strength.
A breakout above 497 would confirm bullish momentum continuation.
Target 615 aligns with the upper red resistance channel, marking a potential major upside zone.
Stop-loss 447 is just below key support and trendline
PSX - PSO - Long PositionTrend: Bullish
DivergencE: No
---
Green candle close above entry level
----
Trade Plan:
Entry: CMP
SL: 299.50
TP:650

PSO | Bullish Outlook AheadPSO is displaying a classic cup formation, which has now broken out to the upside, signaling bullish momentum. The breakout point aligns with the neckline around the 452 level, which also coincides with the 0.5 Fibonacci retracement zone. A potential retest of this level could offer a favorable entry for a long position.
If the retest holds and buyers step in, the next upside targets can be identified using Fibonacci extensions:
First target: 538.94 (0.786 retracement)
Final target: 604 (full retracement level)
The price action suggests that strength above 452 maintains the bullish outlook, while sustained weakness below this zone would invalidate the pattern and call for caution. Overall, the structure supports a continuation of the upward trend following a successful retest. Use stop loss if closes below 414 to manage risk.

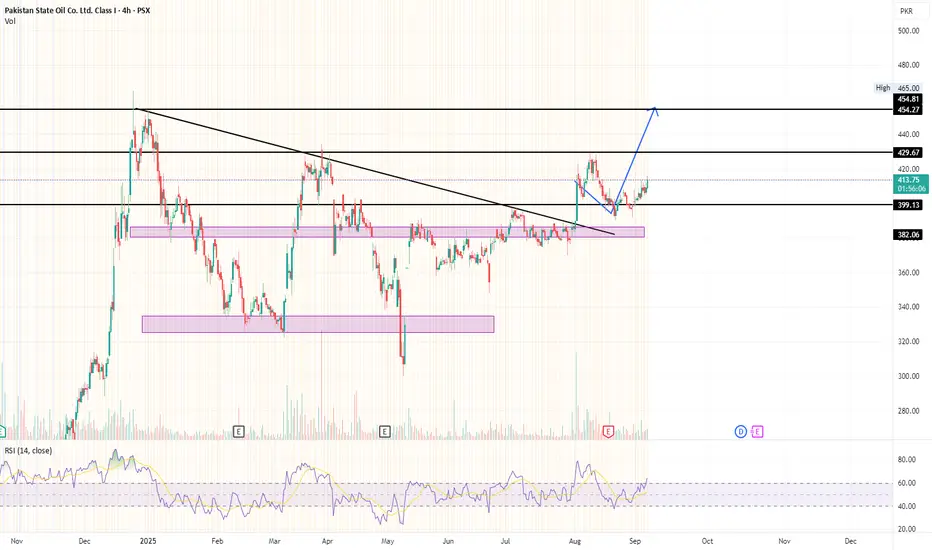
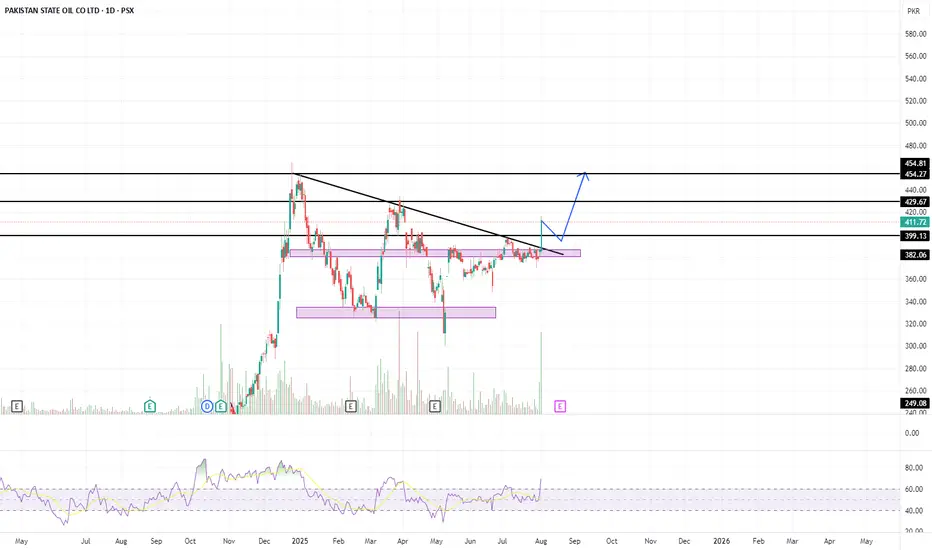
Still Bullish but ..PSO CMP 415.97 (12-08-2025 12:47PM)
Still Bullish but it may re-test its breakout level around 380 - 405.
Upside Targets Intact.
Important to Cross & Sustain 435 - 437 for further Upside.

PSO buying OpertunityPSO share buying strategy
PSO current price 415 buying on dip around 413-410
1st target 426
further hold if break 426 and sustain
stop loss 400
PSO LongFib 2.618 level suggests target price of 731 while triangle and AB=CD patterns suggest 723.
For the safe side, 720 can be kept in mind as the final target.

PSO – TECHNICAL BUY CALL | 31 AUGUST 2025 PSO – TECHNICAL BUY CALL | 31 AUGUST 2025
The stock broke out of a reaccumulation phase, achieved a high of Rs. 429, pulled back, and now seems to be forming a double flag pattern, indicating potential upside.

#PAKISTAN STATE OIL CO.LTD. (PSO) LOOKING FOR BREAKOUTTechnical Analysis: Pakistan State Oil Co. Ltd. (PSO)
Time Frame: Weekly
Trend: Bullish
Pattern: Bullish Flag
Technique Used: Trend Lines
🔎 Chart Structure
PSO is forming a Bullish Flag pattern, a continuation setup usually seen before the next leg higher.
Price has been consolidating inside converging trendlines after a sharp rally.
This indicates strong accumulation before a potential breakout.
📈 Trade Plan
Buy Stop: Rs. 431.29 → Enter on breakout confirmation.
Stop Loss: Rs. 345.89 → Below consolidation support.
Targets:
TP1: Rs. 519.02
TP2: Rs. 602.45
TP3: Rs. 715.92
🚀 Breakout Outlook
A confirmed weekly close above Rs. 431 would validate the bullish flag breakout.
Initial rally may target Rs. 519, followed by Rs. 602, with the long-term projection towards Rs. 715+.
Trendlines are guiding higher, supporting continuation of the bullish structure.
⚠️ Risk Considerations
Failure to hold above Rs. 345 would invalidate the flag setup.
Watch for false breakouts; confirmation with weekly candle close is key.
Market sentiment in energy and PSX performance will also influence momentum.
✅ Conclusion: PSO is coiling within a Bullish Flag on the weekly chart. A breakout above Rs. 431 could open the path toward Rs. 519, 602, and 715. Long-term momentum remains bullish as long as Rs. 345 holds.

PSO – TECHNICAL BUY CALL | 17 AUGUST 2025 (1H TF)PSO – TECHNICAL BUY CALL | 17 AUGUST 2025 - 1H TF
The stock previously went through a Wyckoff re-accumulation phase, broke out, and marked a high of Rs. 429. After a pullback, the stock is now forming a DB bull flag, which is a confluence of two bullish structures.

Bullish Flag Pattern.
Bullish Flag Pattern.
Crossing 435 with Heavy volumes will
trigger more positivity & will expose
New Highs targeting 700+
On flip side, breaking 300 now, will
bring more selling pressure.


PSO buying Strategy📈 Trade Setup: PSO Call Buy
Buy Zone: 411 – 390
Stop Loss (SL): 380
Target 1: 433
Target 2: 460
further hold if sustain above 460 or use a trailing stop loss
PSO Breaks Out of the Triangle – Momentum Ignites!After months of coiling up in a tight symmetrical triangle, PSO has finally exploded out with a massive bullish candle and huge volume! 📈🔥
💡 Entry was at 395.11, and we’re already seeing strong follow-through at 411.72. Momentum traders are watching closely as the breakout gains traction.
🎯 Targets:
TP1: 421.24
TP2: 461.15
TP3: 598.84 (full measured move!)
📊 RSI is heating up at 69.30 but still has room to run. The volume spike is a major confirmation that buyers are stepping in aggressively!
🔻 Stop-loss: 367.93 (a drop below this would invalidate the setup).

Pso bullish flag PSO Chart Analysis – Bullish Flag Formation
Date: July 21, 2025
Ticker: PSO (Pakistan State Oil)
Timeframe: 1W (Weekly Candle)
Chart Pattern: Bullish Flag with Fibonacci Retracement
⸻
🧩 Technical Breakdown
• Massive Uptrend: The chart shows a strong parabolic move from under PKR 150 in late 2024 to nearly PKR 480 by early 2025 — indicating powerful bullish momentum.
• Bullish Flag Formation: After topping around PKR 480, price action has consolidated in a downward-sloping flag channel, marked clearly by two green trendlines. This is a textbook continuation pattern, often signaling further upside after a breakout.
• Fib Retracement Zones:
• Price has respected the 0.382 Fib level (~PKR 340) multiple times as support.
• Currently hovering around PKR 380, just under the 0.236 level, indicating consolidation in a healthy range after the impulse move.
• Lower support zones lie near 0.5 (PKR 300) and 0.618 (PKR 260), which could act as demand areas if the pullback deepens.
• Breakout Projection:
• A potential breakout from the upper flag trendline could push price toward the measured move target of approximately PKR 674.61, as projected in the chart.
• This target aligns with the vertical height of the initial flagpole added to the breakout point.
⸻
📅 Outlook
• If PSO maintains its structure and breaks the upper trendline with volume, it could trigger a strong continuation of the prior uptrend.
• Keep watch on weekly closes above the flag resistance (~PKR 400) for confirmation.
⸻
⚠️ Disclaimer
This chart is for educational and informational purposes only. It does not constitute financial advice. Please conduct your own research before making any investment decisions.
