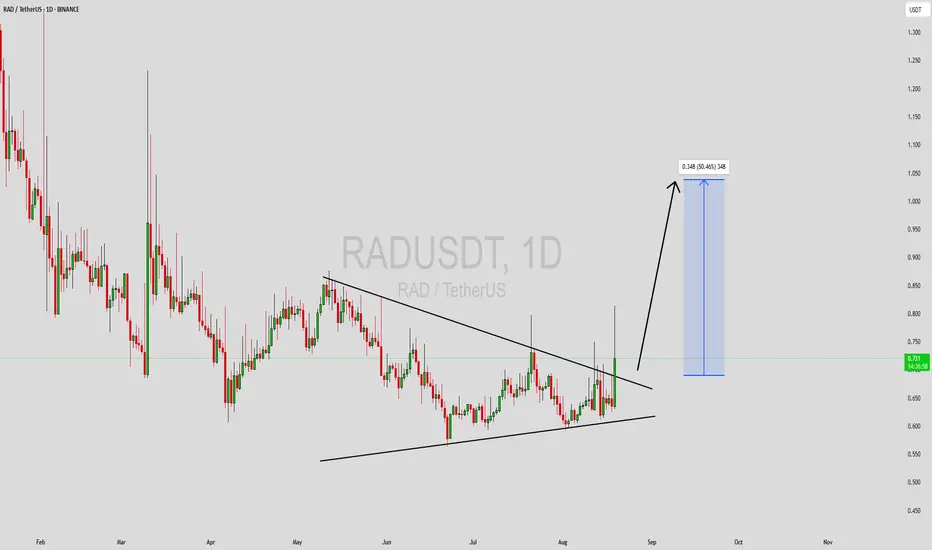
RADUSDT 1D#RAD after several attempts to break above the falling wedge, finally managed to break out of the pattern and also above the daily EMA100. It can go higher only if a successful retest is completed and the support holds. In this case, the potential targets are:
🎯 $0.868
🎯 $1.056
🎯 $1.208
🎯 $1.360
🎯

RADUSDT Forming Descending WedgeRADUSDT is currently forming a classic descending wedge pattern, a structure often recognized for its bullish reversal potential. This pattern indicates that while prices have been trending downward, the rate of decline has been slowing — often a sign that sellers are losing momentum and buyers are
RADUSDTRAD can make 3x easy they have great project
Good Entry now with these price, you can keep it for long term investment.

RADUSDT UPDATE
Pattern: Falling Wedge Breakout
Current Price: \$0.819
Target Price: \$1.45
Target % Gain: 80.77%
Technical Analysis: RAD has broken out of a long-term falling wedge on the 1D chart. Price is consolidating above the breakout level, signaling potential continuation. A measured move targets 80% u

RADUSDT CHART ANALYSİS - EDUCATIONAL POSTHow NFT Technology Developed
NFT technology was created in 2017 based on Ethereum smart contracts. Since then, we have witnessed many successful NFT projects and deals. Stories like these perfectly describe the current and future possibilities of the technology.
The development of blockchain tech

RADlike the trades I posted already it a long-term trade and a very good opportunity to trade stick with the stoploss
best wishes .

Trading opportunity for RADUSDTBased on technical factors there is a Buy position in :
📊 RADUSDT
🔵 Buy Now
🪫Stop loss 1.260
🔋Target 1.490
📏 R/R 1.6
💸RISK : 1%
We hope it is profitable for you ❤️
Please support our activity with your likes👍 and comments📝

RADUSDT: %220 Daily Volume Spike – The Smartest Entry Revealed!RADUSDT is seeing a massive %220 daily volume spike , signaling an intense surge of activity. For those looking to capitalize on this momentum, the blue box zone represents the most rational and carefully chosen entry point.
Why This Matters:
The Blue Box Advantage: This zone has been meti

Trading opportunity for RADUSDTBased on technical factors there is a Buy position in :
📊 RADUSDT
🔵 Buy Now
🪫Stop loss 1.190
🔋Target 1.600
📏 R/R 2
💸RISK : 1%
We hope it is profitable for you ❤️
Please support our activity with your likes👍 and comments📝

RAD Pump to 2.4XX $ is about to happen after break 1.8XX $ Area Radicle (RAD) has recently experienced a significant price surge, but it's important to be cautious about its future direction.
Key Technical Analysis:
* Fakeout: to 2.4XX is more likely to happen
* Potential Correction: A deeper correction towards the $1.6 or $1.5 support levels is possible.
R

See all ideas
Summarizing what the indicators are suggesting.
Oscillators
Neutral
SellBuy
Strong sellStrong buy
Strong sellSellNeutralBuyStrong buy
Oscillators
Neutral
SellBuy
Strong sellStrong buy
Strong sellSellNeutralBuyStrong buy
Summary
Neutral
SellBuy
Strong sellStrong buy
Strong sellSellNeutralBuyStrong buy
Summary
Neutral
SellBuy
Strong sellStrong buy
Strong sellSellNeutralBuyStrong buy
Summary
Neutral
SellBuy
Strong sellStrong buy
Strong sellSellNeutralBuyStrong buy
Moving Averages
Neutral
SellBuy
Strong sellStrong buy
Strong sellSellNeutralBuyStrong buy
Moving Averages
Neutral
SellBuy
Strong sellStrong buy
Strong sellSellNeutralBuyStrong buy
Displays a symbol's price movements over previous years to identify recurring trends.